
Oct 20
Coffee Weekly Report - 2023 10 20
Back to main blog page
- A surprising drawdown in EU stocks occurred in August, marking a 12.8% decrease to 10.23M bags, contrary to seasonal trends.
- Import volumes for June and July were below average, notably 7% lower in July, yet cumulative imports are at 38.6M bags, reflecting a 4.6% decrease from the previous year.
- The decline in stocks is not solely a result of reduced imports; in the first month of the 22/23 cycle (October 2022), stocks fell by 26%, surpassing replenishment rates. This deviation is linked to higher stocking costs.
- Apparent consumption, currently at 38.6M bags, exceeds expectations. This could impact the 22/23 and 23/24 cycles, with reported balances of -4.8M bags and -1.5M bags, respectively, providing some support amid economic challenges across the supply chain. Despite potential trade flow disruptions, yearly balances remain resilient, indicating a nuanced picture in the EU coffee market.
Coffee Market Shifts in EU
In our previous report regarding European Union apparent consumption, considering the data released up to June, indicators were already bullish – signaling that the bloc was rebuilding stocks at a lower rate than expected, when accounting for imported volumes.
In this update, we will look at the consolidated data up until July, and markers remain supportive of prices, although the dynamic between imports and stocks has changed.
First, stocks started to drawdown in July, according to ECF data. The movement was against seasonality, with stocks reaching 10.23M bags in August (-12.8% compared to the beginning of the year, when stocks are usually 10% higher in August vs. January, Chart #1).
As for imports, volumes have indeed been lower than average in June and July (in the last one, specifically, 7% below average, Chart #2). Nonetheless, the drop in imports has been tamer than the subsequent decrease in stocks.
Image 1: Coffee Stocks – European Union (M bags)
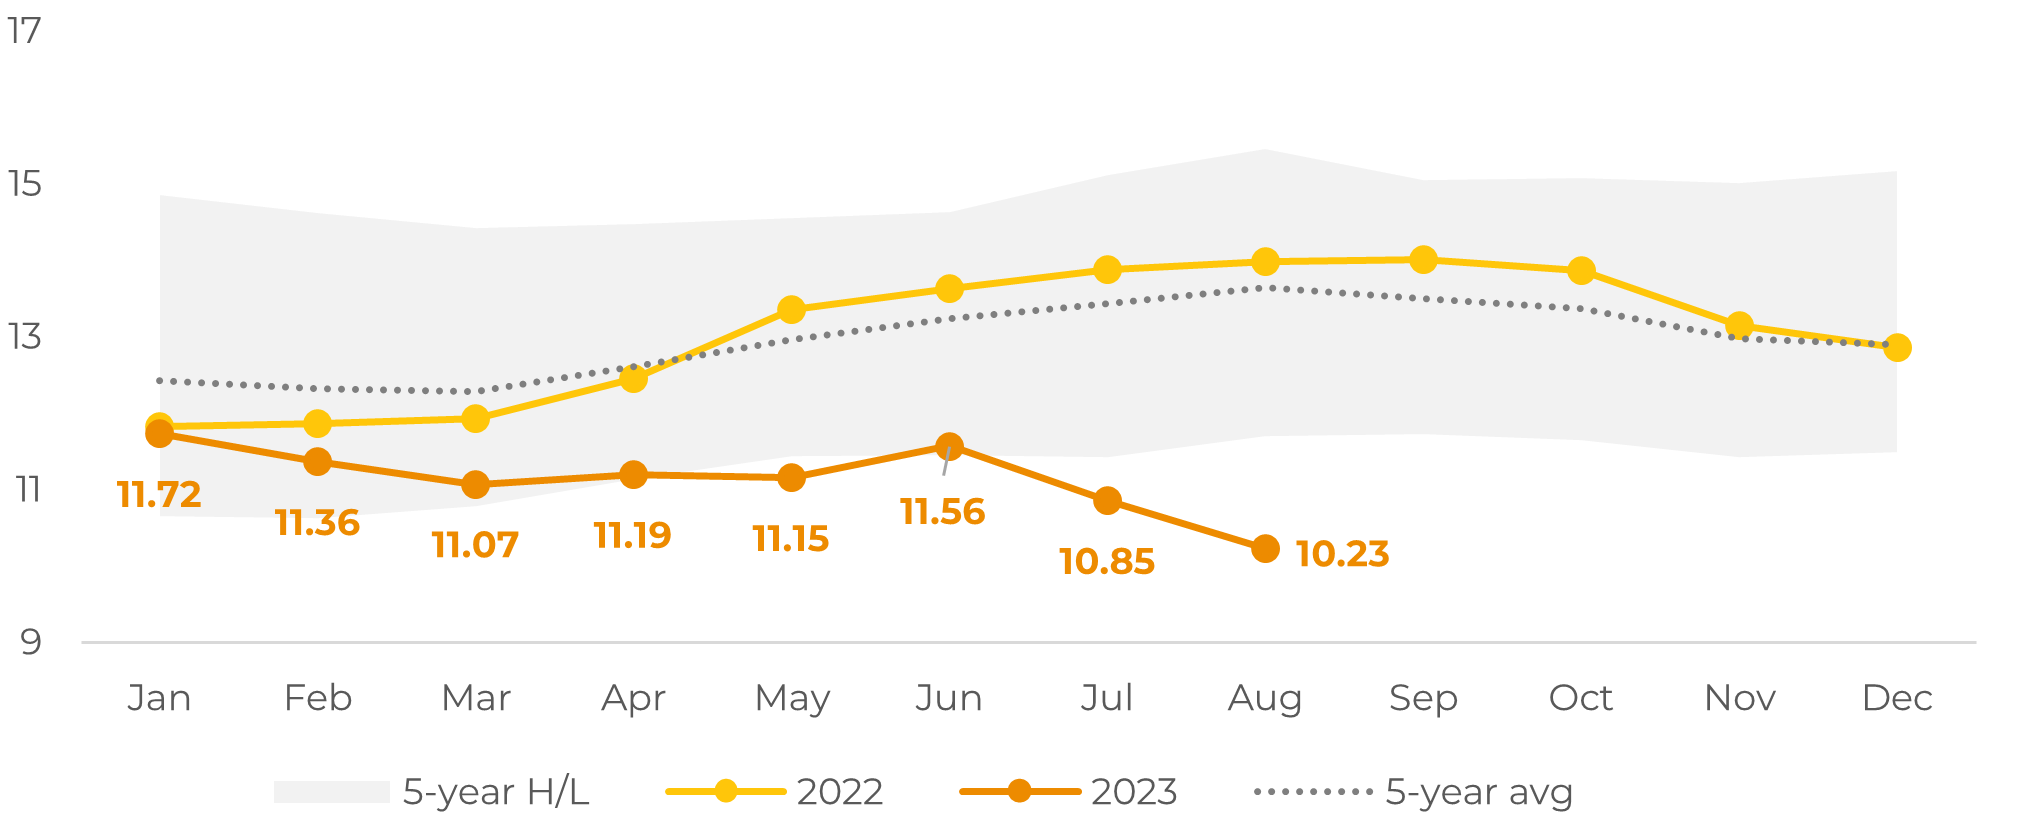
Source: European Coffee Federation, hEDGEpoint
Image 2: Coffee Imports – European Union (M bags)
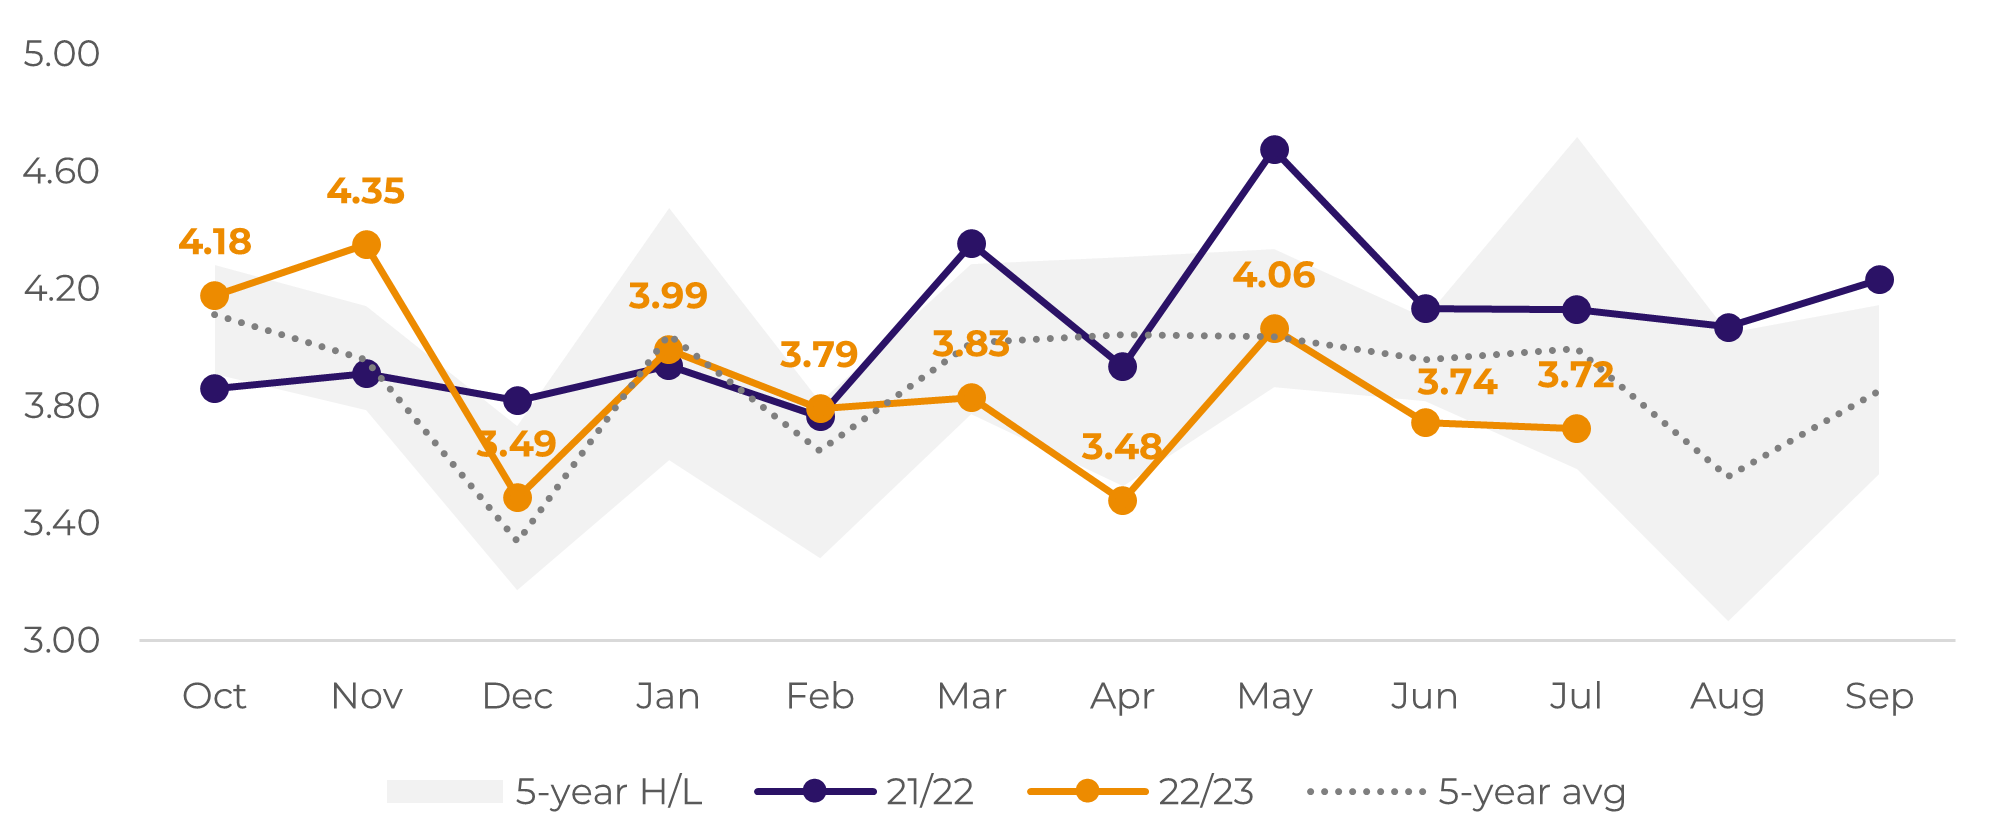
Source: Eurostat, hEDGEpoint
In the cumulative figure, imports are at 38.6M bags, which is 4.6% below last year’s levels during the same period, and 5% below the expected metric between October and July, considering an estimate of 48.3M bags imported throughout the entire cycle.
Now, the decrease in imports only accounts for 5 percentage points of the stock drawdown. Considering the first month of the 22/23 cycle, October 2022, stocks fell by 26%. This means that, even though the EU has been importing less coffee over the recent months, stocks fell by more than the replenishment rate – a fact that is inherently linked to higher stocking costs in destinations.
Consequently, the apparent consumption metric is slightly above what would be expected for the same October 2022 – July 2023 window: 38.6M bags vs. 37.3M bags. Accounting for the -3.5% deviation seen up until now, apparent consumption in the EU will likely be readjusted up in our supply & demand balance, staying in the range between 44.3M and 45.8M bags (+1.5M), which affects the consolidated 22/23 S&D and estimates for 23/24 as well.
Currently, we are working with a -4.8M bags balance for the 22/23 cycle, that ended in September 2023, and a -1.5M bags balance for the current 23/24 cycle. Therefore, even though trade flows might suffer from the economic challenges presented by higher costs across the chain, in terms of yearly balances, some support is still being reported.
Currently, we are working with a -4.8M bags balance for the 22/23 cycle, that ended in September 2023, and a -1.5M bags balance for the current 23/24 cycle. Therefore, even though trade flows might suffer from the economic challenges presented by higher costs across the chain, in terms of yearly balances, some support is still being reported.
Image 3: Coffee Imports – European Union (M bags)
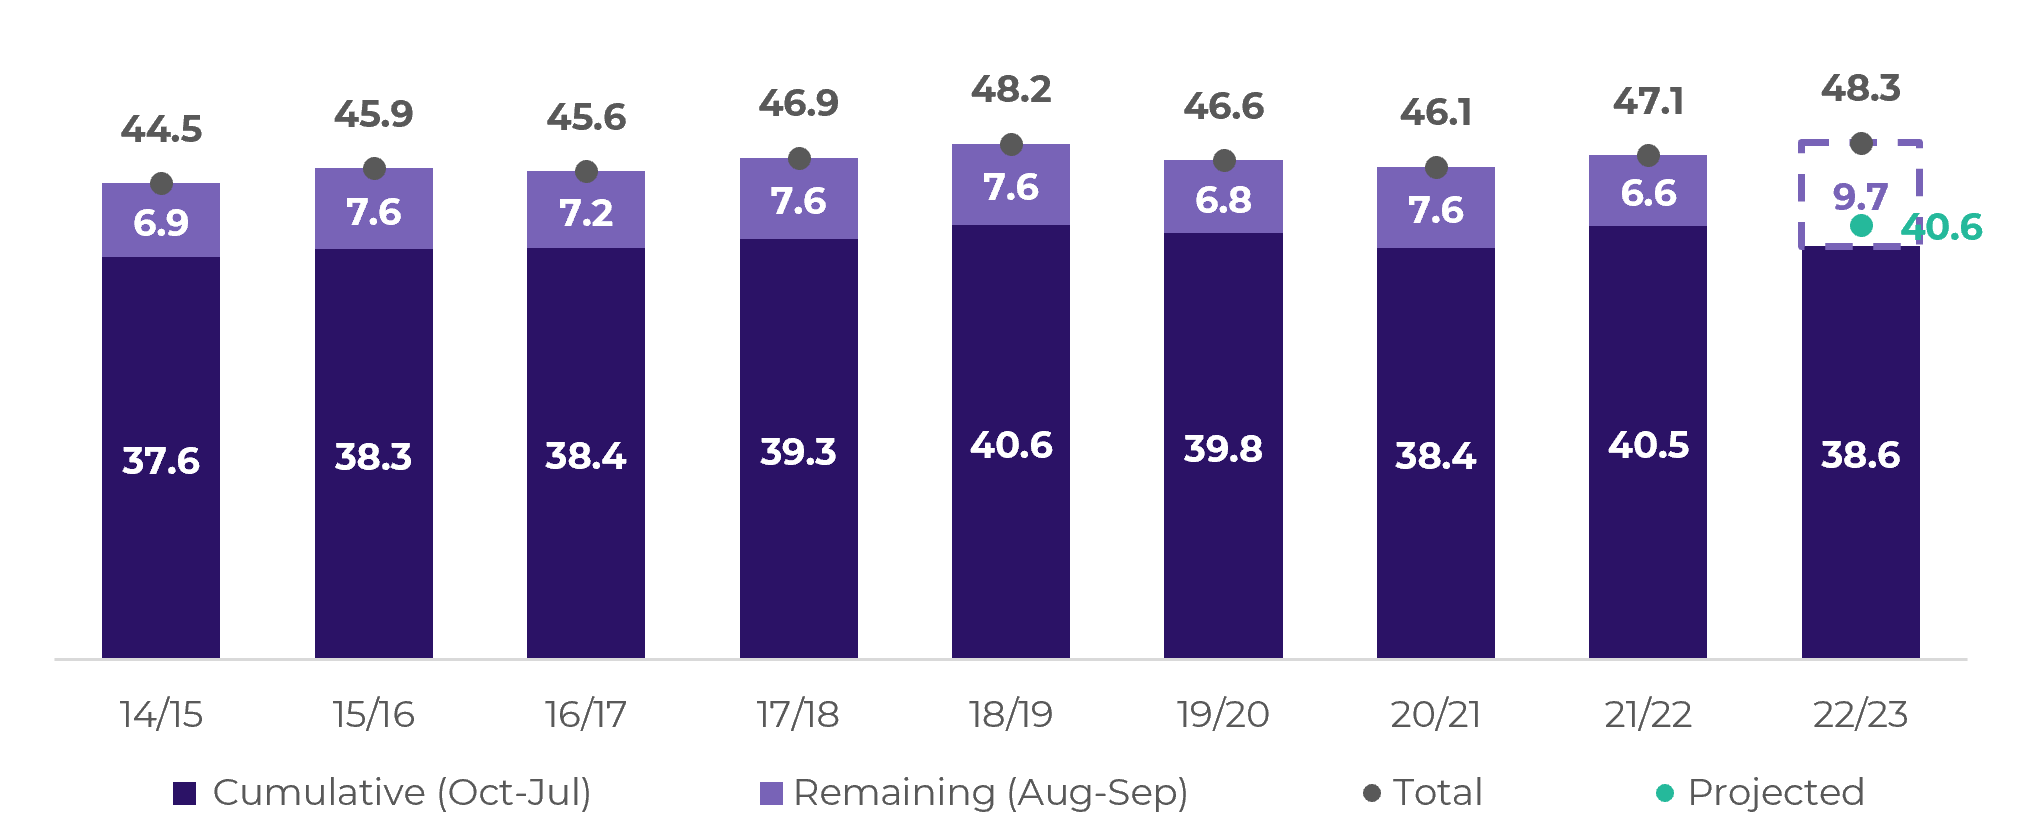
Source: Eurostat, hEDGEpoint
Image 4: Apparent Consumption – European Union (M bags)
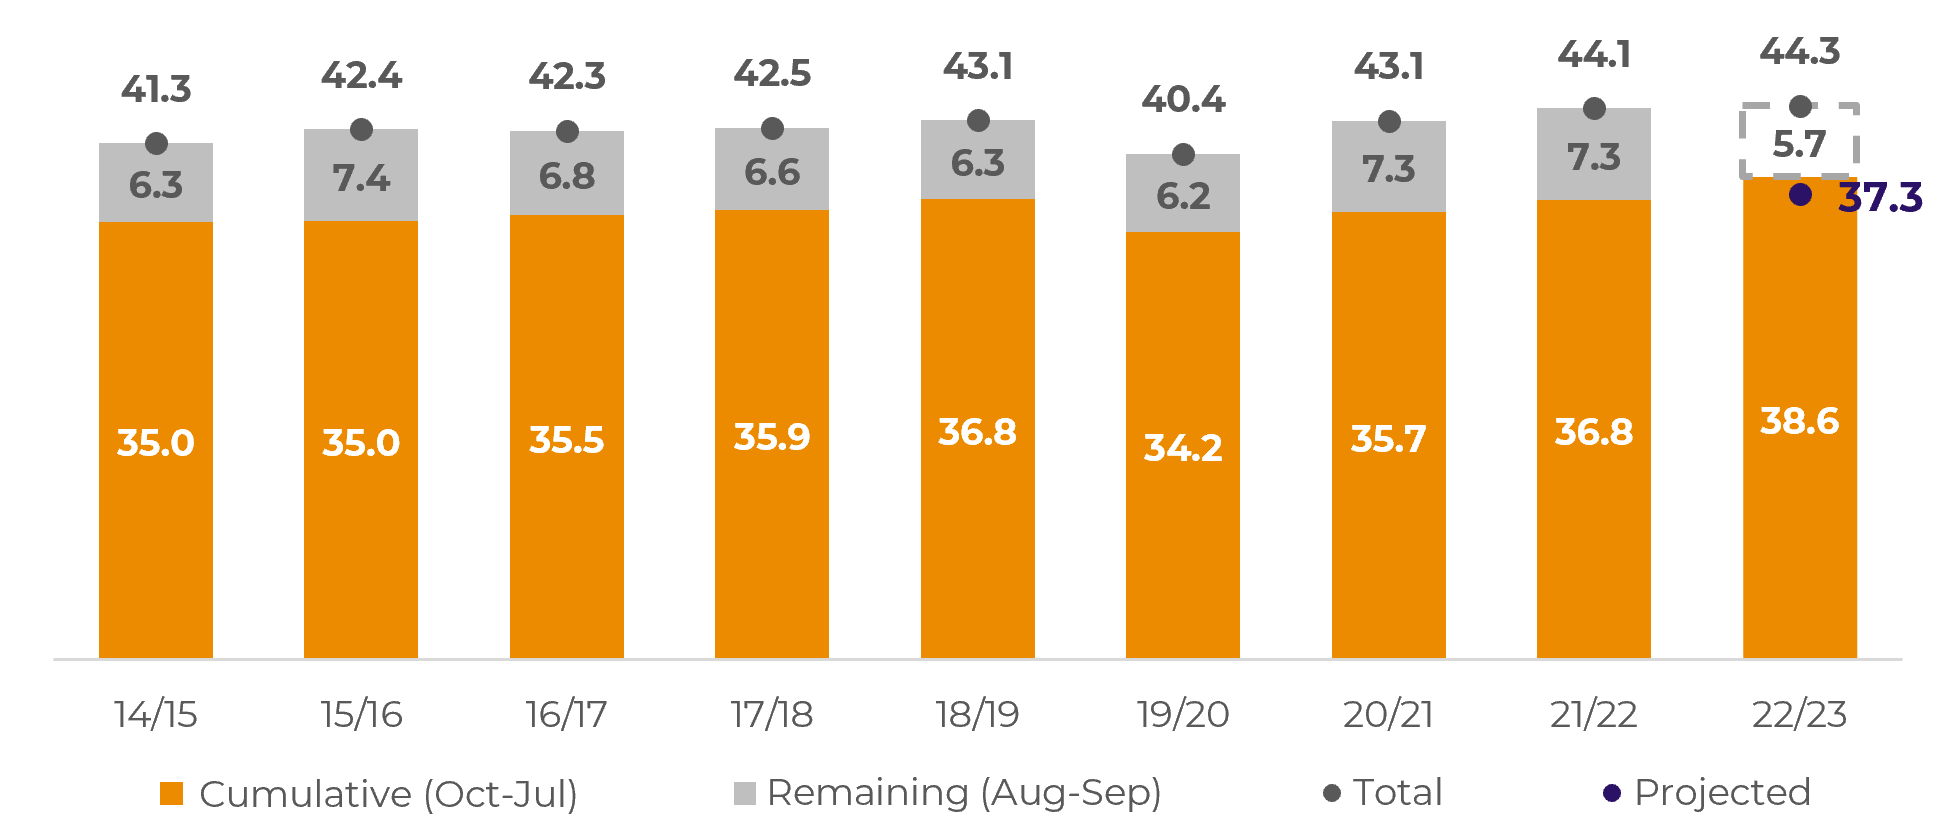
Source: European Coffee Federation, Eurostat, hEDGEpoint
In Summary
The European Union's coffee market shows a decline in stocks amid lower-than-average imports, resulting in a 12.8% decrease in August. While imports are 4.6% below last year's levels, the stock drawdown is attributed to higher stocking costs. Apparent consumption exceeds expectations at 38.6M bags, prompting a potential adjustment in the supply-demand balance for 22/23 and 23/24 cycles.
Despite economic challenges, yearly balances remain supportive, with a -4.8M bags balance for the 22/23 cycle and -1.5M bags for the current 23/24 cycle. On the other side, other fundamentals may still exert pressure on prices, namely Brazil’s 24/25 crop potential.
Despite economic challenges, yearly balances remain supportive, with a -4.8M bags balance for the 22/23 cycle and -1.5M bags for the current 23/24 cycle. On the other side, other fundamentals may still exert pressure on prices, namely Brazil’s 24/25 crop potential.
Weekly Report — Coffee
Written by Natália Gandolphi
natalia.gandolphi@hedgepointglobal.com
natalia.gandolphi@hedgepointglobal.com
Reviewed by Lívea Coda
livea.coda@hedgepointglobal.com
www.hedgepointglobal.com
Disclaimer
This document has been prepared by hEDGEpoint Global Markets LLC and its affiliates ("HPGM") exclusively for informational and instructional purposes, without the purpose of creating obligations or commitments with third parties, and is not intended to promote an offer, or solicitation of an offer, to sell or buy any securities or investment products. HPGM and its associates expressly disclaim any use of the information contained herein that may result in direct or indirect damage of any kind. If you have any questions that are not resolved in the first instance of contact with the client (client.services@hedgepointglobal.com), please contact our internal ombudsman channel (ouvidoria@hedgepointglobal.com) or 0800-878-8408 (for clients in Brazil only).


Contact us
hedgepointhub.support@hedgepointglobal.com
ouvidoria@hedgepointglobal.com
Funchal Street, 418, 18º floor - Vila Olímpia São Paulo, SP, Brasil
Check our general terms and important notices.
This page has been prepared by Hedgepoint Schweiz AG and its affiliates (“Hedgepoint”) solely for informational and instructional purposes, without the purpose of instituting obligations or commitments to third parties, nor is it intended to promote an offer, or solicitation of an offer of sale or purchase relating to any securities, commodities interests or investment products. Hedgepoint and its associates expressly disclaim any use of the information contained herein that directly or indirectly result in damages or damages of any kind. Information is obtained from sources which we believe to be reliable, but we do not warrant or guarantee the timeliness or accuracy of this information. The trading of commodities interests such as futures, options, and swaps involves substantial risk of loss and may not be suitable for all investors. You should carefully consider wither such trading is suitable for you in light of your financial condition. Past performance is not necessarily indicative of future results. Customers should rely on their own independent judgement and/or advisors before entering in any transaction.Hedgepoint does not provide legal, tax or accounting advice and you are responsible for seeking any such advice separately.Hedgepoint Schweiz AG is organized, incorporated, and existing under the laws of Switzerland, is filiated to ARIF, the Association Romande des Intermédiaires Financiers, which is a FINMA-authorized Self-Regulatory Organization. Hedgepoint Commodities LLC is organized, incorporated, and existing under the laws of the USA, and is authorized and regulated by the Commodity Futures Trading Commission (CFTC) and a member of the National Futures Association (NFA) to act as an Introducing Broker and Commodity Trading Advisor. HedgePoint Global Markets Limited is Regulated by the Dubai Financial Services Authority. The content is directed at Professional Clients and not Retail Clients. Hedgepoint Global Markets PTE. Ltd is organized, incorporated, and existing under the laws of Singapore, exempted from obtaining a financial services license as per the Second Schedule of the Securities and Futures (Licensing and Conduct of Business) Act, by the Monetary Authority of Singapore (MAS). Hedgepoint Global Markets DTVM Ltda. is authorized and regulated in Brazil by the Central Bank of Brazil (BCB) and the Brazilian Securities Commission (CVM). Hedgepoint Serviços Ltda. is organized, incorporated, and existing under the laws of Brazil. Hedgepoint Global Markets S.A. is organized, incorporated, and existing under the laws of Uruguay. In case of questions not resolved by the first instance of customer contact (client.services@Hedgepointglobal.com), please contact internal ombudsman channel (ombudsman@hedgepointglobal.com – global or ouvidoria@hedgepointglobal.com – Brazil only) or call 0800-8788408 (Brazil only).Integrity, ethics, and transparency are values that guide our culture. To further strengthen our practices, Hedgepoint has a whistleblower channel for employees and third-parties by e-mail ethicline@hedgepointglobal.com or forms Ethic Line – Hedgepoint Global Markets.Security note: All contacts with customers and partners are conducted exclusively through our domain @hedgepointglobal.com. Do not accept any information, bills, statements or requests from different domains and pay special attention to any variations in letters or spelling, as they may indicate a fraudulent situation.“HedgePoint” and the “HedgePoint” logo are marks for the exclusive use of HedgePoint and/or its affiliates. Use or reproduction is prohibited, unless expressly authorized by HedgePoint. Furthermore, the use of any other marks in this document has been authorized for identification purposes only. It does not, therefore, imply any rights of HedgePoint in these marks or imply endorsement, association or seal by the owners of these marks with HedgePoint or its affiliates.