Dec 15

Coffee Weekly Report - 2023 12 15

  Back to main blog page
  • Brazilian coffee exports witnessed a significant surge, hitting 4.3M bags in November, surpassing the average by 1.3M bags (a remarkable 42% increase).

  • The upswing is attributed to heightened availability in the 23/24 Brazilian crop and competitive pricing, reshaping destination patterns.

  • Despite a decline in imports, the United States continues to be the primary destination, receiving 5.47M bags in 2023 (constituting 15.63% of the total).

  • Notably, Japan experienced a 22% rise in Brazilian coffee imports, associated with stock withdrawal, while China's imports skyrocketed by an impressive 221%.

  • Brazil has successfully displaced Ethiopia as China's primary natural arabica supplier, with a 194% surge in exports driven by favorable price differentials. This shift underscores evolving dynamics in the global coffee trade landscape.

Brazil’s coffee exports and shifting global trends

In previous reports, we’ve looked at the performance of demand in destinations, with data from the European Union suggesting a stronger growth than initially expected – since the decrease in imports did not fully explain the trend in stocks.

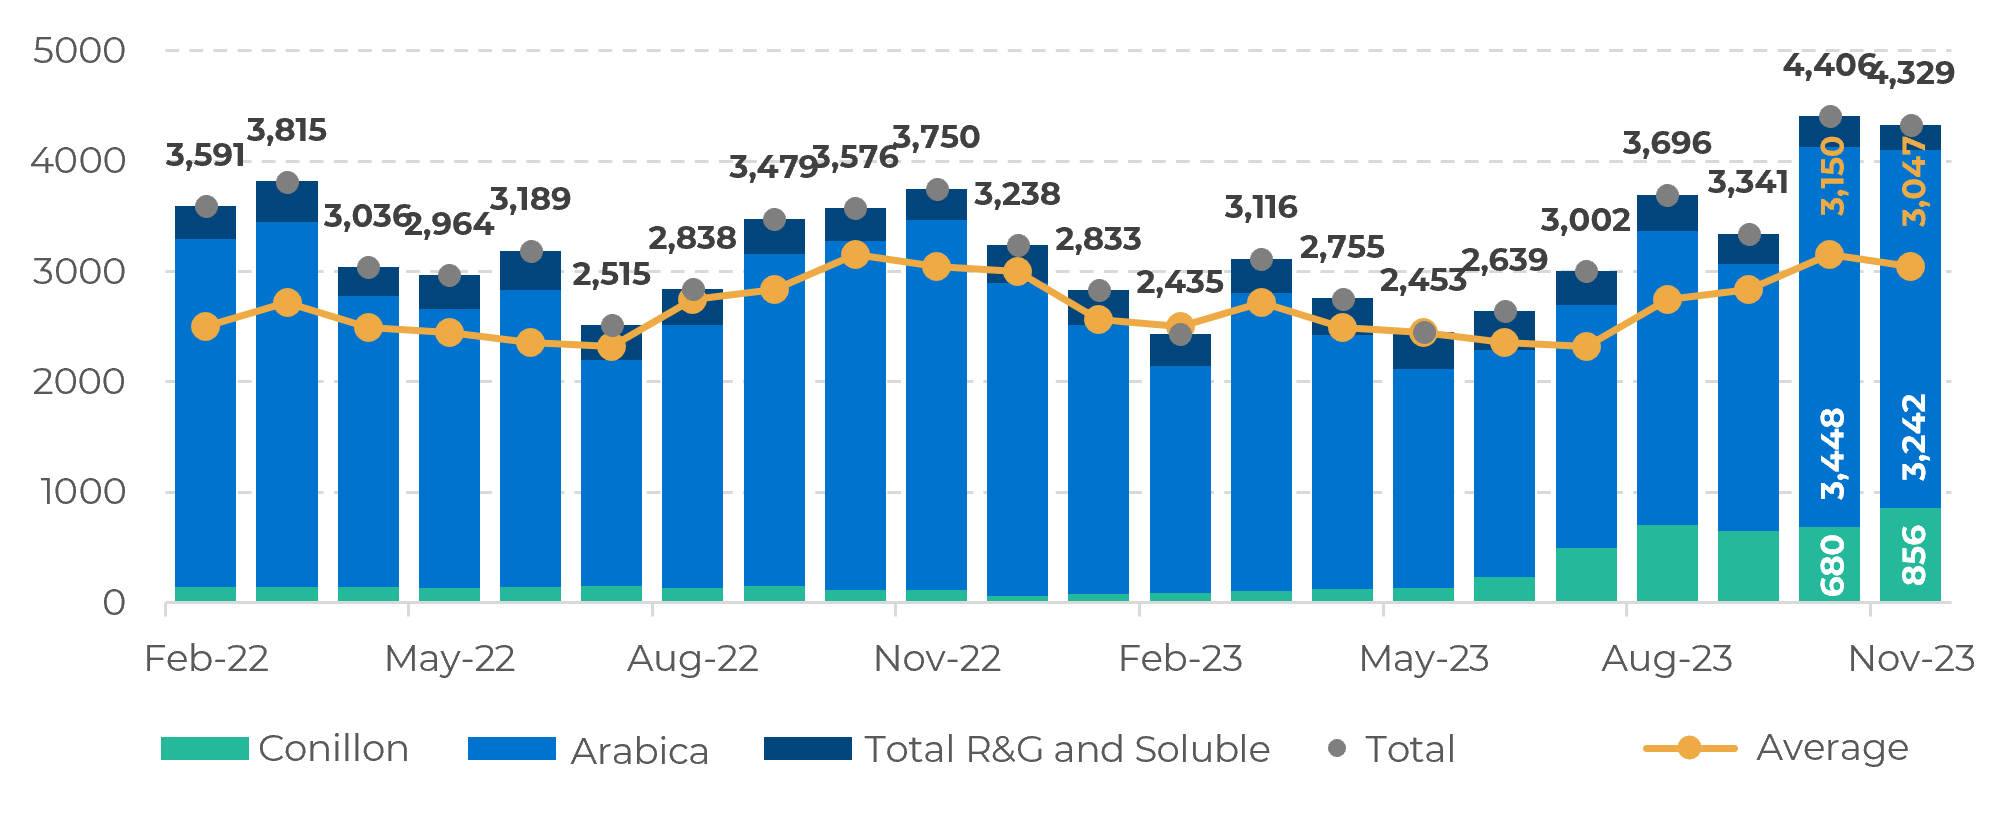
Still, that was a picture taken in the 22/23 cycle, and since then, Brazilian exports have increased, changing the landscape in destinations. Shipments reached 4.3M bags in November, with 3.2M bags of arabica and 856K bags of conilon (Figure 1).

The total has surpassed the average by 1.3M bags, nearly 42%. The move is explained by higher availability in the 23/24 Brazilian crop when compared to 22/23, as well as competitive prices from Brazil when compared to other origins.

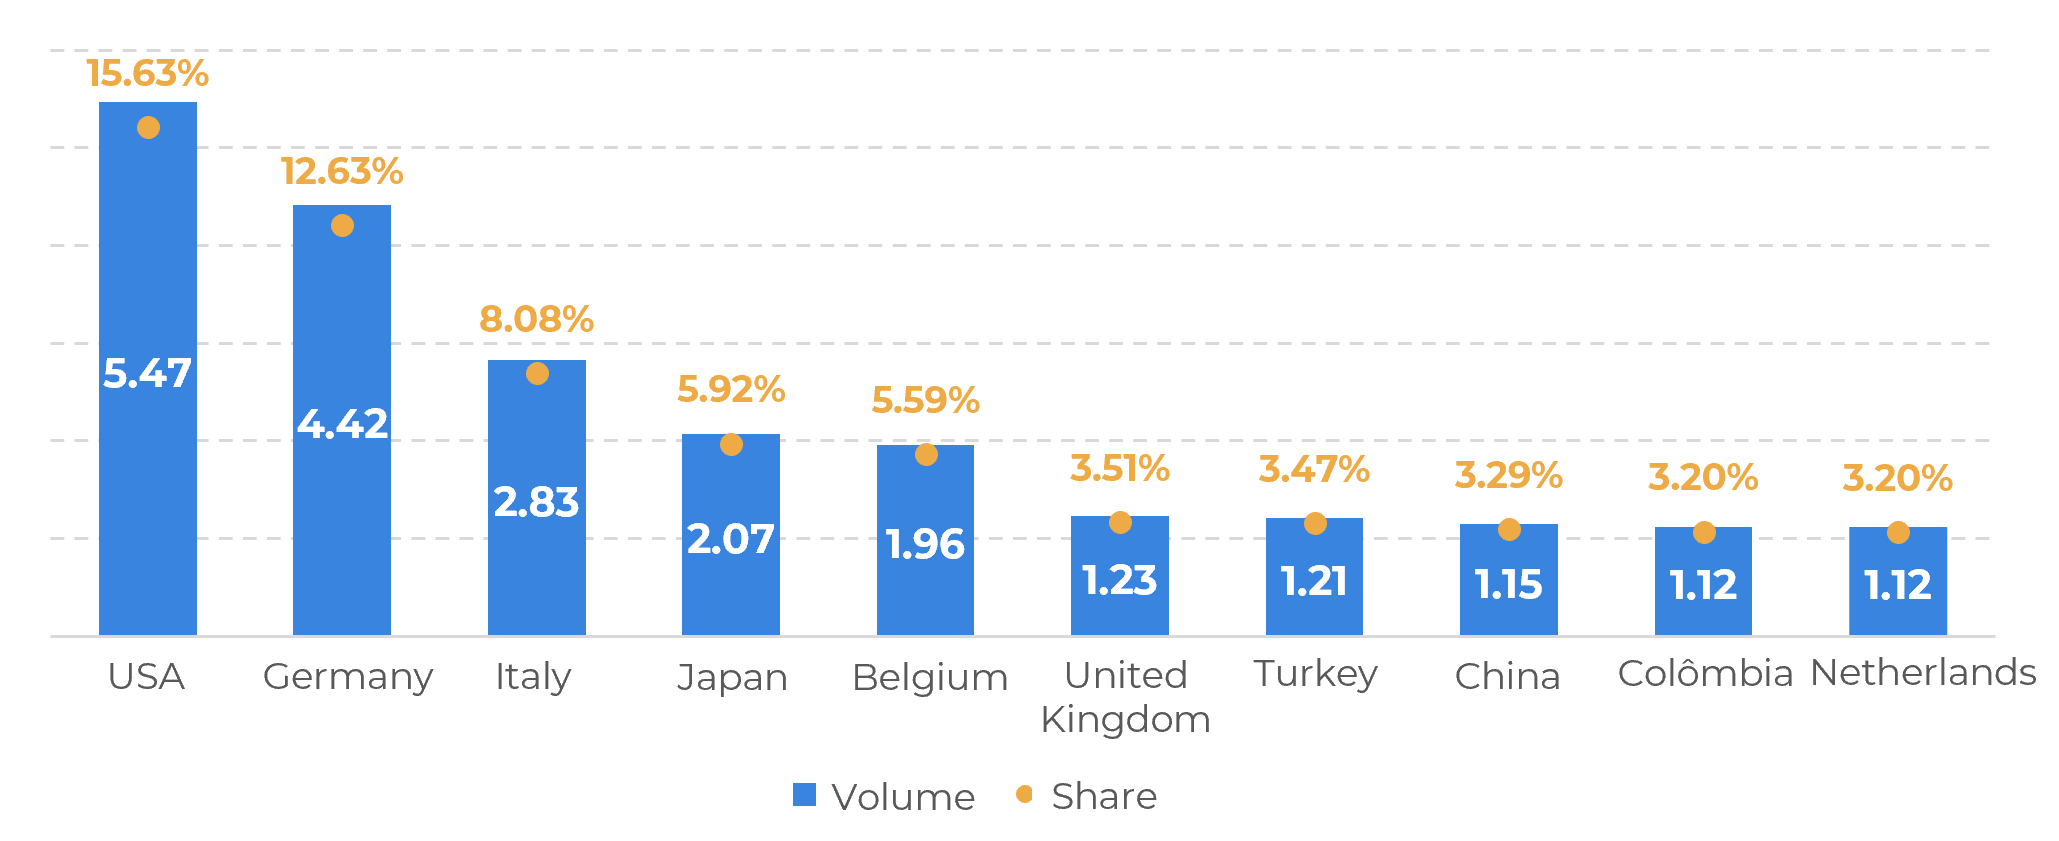
Considering the cumulative figure for 2023 (Jan-Nov), the USA has been the main destination for Brazilian coffee, at 5.47M bags, or 15.63% of the total (Figure 2). Germany and Italy follow in second and third places – although the EU as a whole has imported 14.73M bags from Brazil this year (down 14% YoY).

Figure 1: Brazilian Coffee Exports, by Type (‘000 bags)

Source: Cecafé

Figure 2: Brazilian Coffee Exports, by Destination (M bags)

Source: Cecafé

Looking at each country separately, the figures are surprising – the United States has imported 26% less when compared to 2022, Germany 30% less, and Italy, 9%. So, the question arises: given that Brazil is exporting more, and the main destinations are importing less, where is the coffee moving to?

Figure 3: Cumulative Brazilian Exports by Destination (bags)

Source: Cecafé

For traditional destinations, Japan reported a 22% increase in Brazilian coffee imports, but this move is related to the previous stock withdrawal in the country.

Considering data from the past two years, stocks from Brazilian origin in the country dropped by 46% - the highest figure among the reported origins.

As for other destinations, the highlight goes to China: the country imported 1.15M bags from Brazil in 2023 – a 221% increase vs. the 359K bags reported last year!


It’s important to note that Brazil has taken Ethiopia’s place as China’s main natural arabica supplier. From the third quarter of 2022 to the third quarter of 2023, Ethiopia’s exports to China dropped by 49%, whereas Brazilian exports to the country increased by 194%.

This move has been mostly due to the spread between the two (Ethiopia’s average natural arabica FOB differential was -3 c/lb in the period, whereas the Brazilian good cup ¾ MTGB 14/16 was averaging -17 c/lb).

Figure 4: China Coffee Imports – Third Quarter, 2022 and 2023 (‘000 bags)

Source: Trade Map

In Summary

Brazil's coffee exports have surged, reaching 4.3M bags in November, exceeding the average by 1.3M bags (42%). This increase is attributed to higher availability in the 23/24 crop and competitive prices. Despite a decline, the USA remains the leading destination, with 5.47M bags in 2023 (15.63% of the total).

Notably, traditional destinations like Japan show a 22% increase, while China's imports skyrocketed by 221%, making Brazil its primary natural arabica supplier, replacing Ethiopia. This shift is largely due to price differentials, with Brazil offering a more attractive option.

Weekly Report — Coffee

Written by Natália Gandolphi
natalia.gandolphi@hedgepointglobal.com
Reviewed by Victor Arduin
victor.arduin@hedgepointglobal.com
www.hedgepointglobal.com

Disclaimer

This document has been prepared by hEDGEpoint Global Markets LLC and its affiliates ("HPGM") exclusively for informational and instructional purposes, without the purpose of creating obligations or commitments with third parties, and is not intended to promote an offer, or solicitation of an offer, to sell or buy any securities or investment products. HPGM and its associates expressly disclaim any use of the information contained herein that may result in direct or indirect damage of any kind. If you have any questions that are not resolved in the first instance of contact with the client (client.services@hedgepointglobal.com), please contact our internal ombudsman channel (ouvidoria@hedgepointglobal.com) or 0800-878-8408 (for clients in Brazil only).

To access this report, you need to be a subscriber.