
Feb 23
/
Natália Gandolphi
Coffee Weekly Report - 2024 02 23
Back to main blog page
- In 2024, coffee prices correlate with other commodities; still, it’s important to highlight the differences between arabica and robusta, especially in February.
- Arabica, initially on a downtrend, aims to match robusta's gains, reflecting nuanced export seasonality dynamics. Arabica's curve, compared to a year ago, has a posterior inflection point, aligning with July deliveries and anticipating higher output for the 24/25 crop in Brazil.
- Robusta's current backwardation contrasts with the previous year's pattern. The 6th contract marked the inflection point, responding to seasonality. Looking ahead, robusta's peak supply is in March, gradually decreasing until the beginning of the next cycle, as Brazil’s and Indonesia’s supply volume is lower than Vietnam’s.
- Arabica's seasonal index highlights May and July, while the New York future curve reflects cautious optimism for the second supply period, unaffected by certified stocks in NY.
Seasonal impacts on future coffee curves
In 2024, coffee prices have exhibited similarities in trend lines with other commodities such as wheat, oil, sugar, and, to a lesser extent, soybeans and corn. Notably, cocoa faces a significant crop failure in West African countries, and natural gas, after rallying in the first weeks of the year, responded to solid supply figures. However, the standout difference lies in the performance of arabica and robusta. Arabica began the year on a downtrend but has since responded and is now aiming to match robusta's year-to-date gains.
Examining the arabica and robusta curves reveals interesting points. For arabica, the curve now, compared to one year ago, has a posterior inflection point, corresponding to the July delivery. This coincides with the start of Brazil's crop shipments, marking the 24/25 crop, with market expectations of higher output compared to 23/24 for arabica, despite weather impacts from veranico episodes during development.
Figure 1: Commodity Prices Index (Jan 02 = 100)
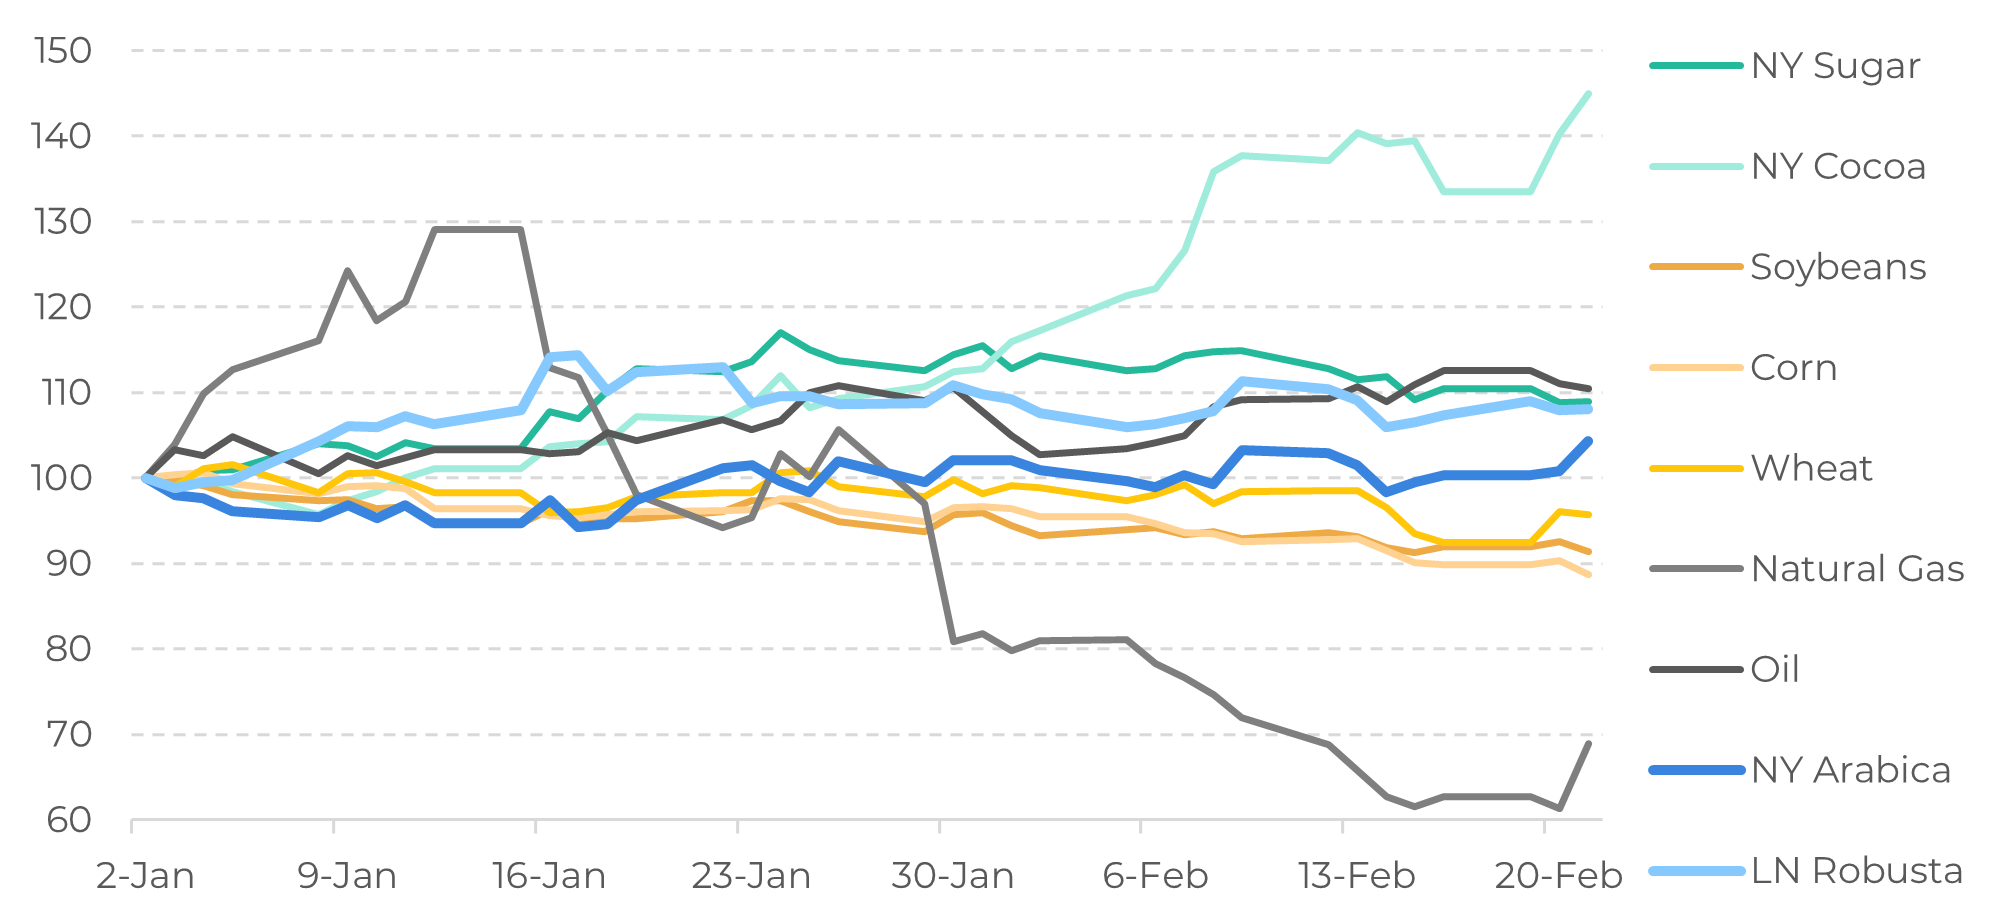
Source: ICE, Refinitiv
Figure 2: Future Curve – NY Arabica (c/lb)
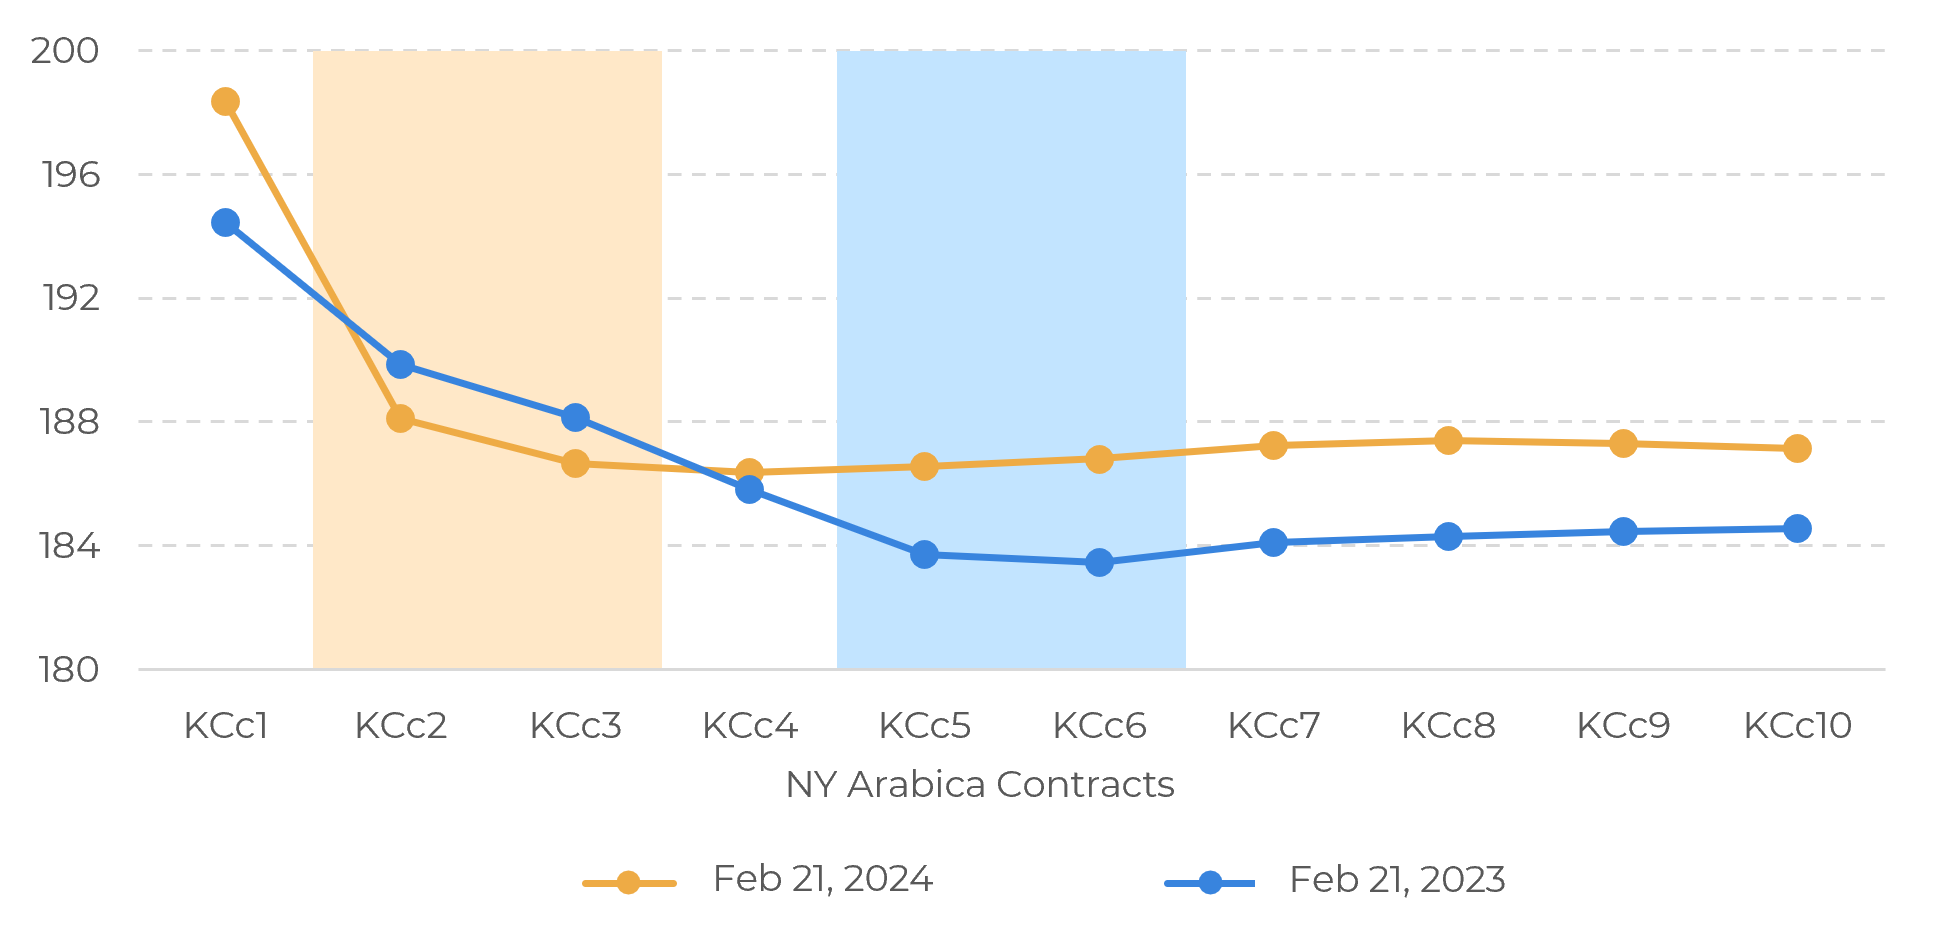
Source: ICE, Refinitiv
In contrast, robusta's curve has undergone more changes. While currently in complete backwardation, one year ago, the 6th contract marked the inflection point - the last January contract. This is a month when the robusta exports seasonality curve increases, especially from Vietnam. However, market participants now observe lower availability from Vietnam in this cycle.
Looking ahead, after a momentary drop in seasonality following the Chinese New Year, peak robusta supply is expected in March, gradually decreasing until the next cycle. Despite Indonesia and Brazil contributing to exports during this window, the volumes do not compare to the dominance of Vietnam.
Arabica's seasonal index, while less pronounced, highlights May as the peak export month for Central American countries and Colombia's main crop, and July, when Brazil starts to export new crop supplies. The New York future curve reflects market caution for the initial supply period, with a slightly more optimistic outlook for the second one. This is despite incoming stocks being certified in NY, which does not challenge the seasonal view in any way – as seen in Figure 4.
Figure 3: Future Curve – LN Robusta (USD/mt)
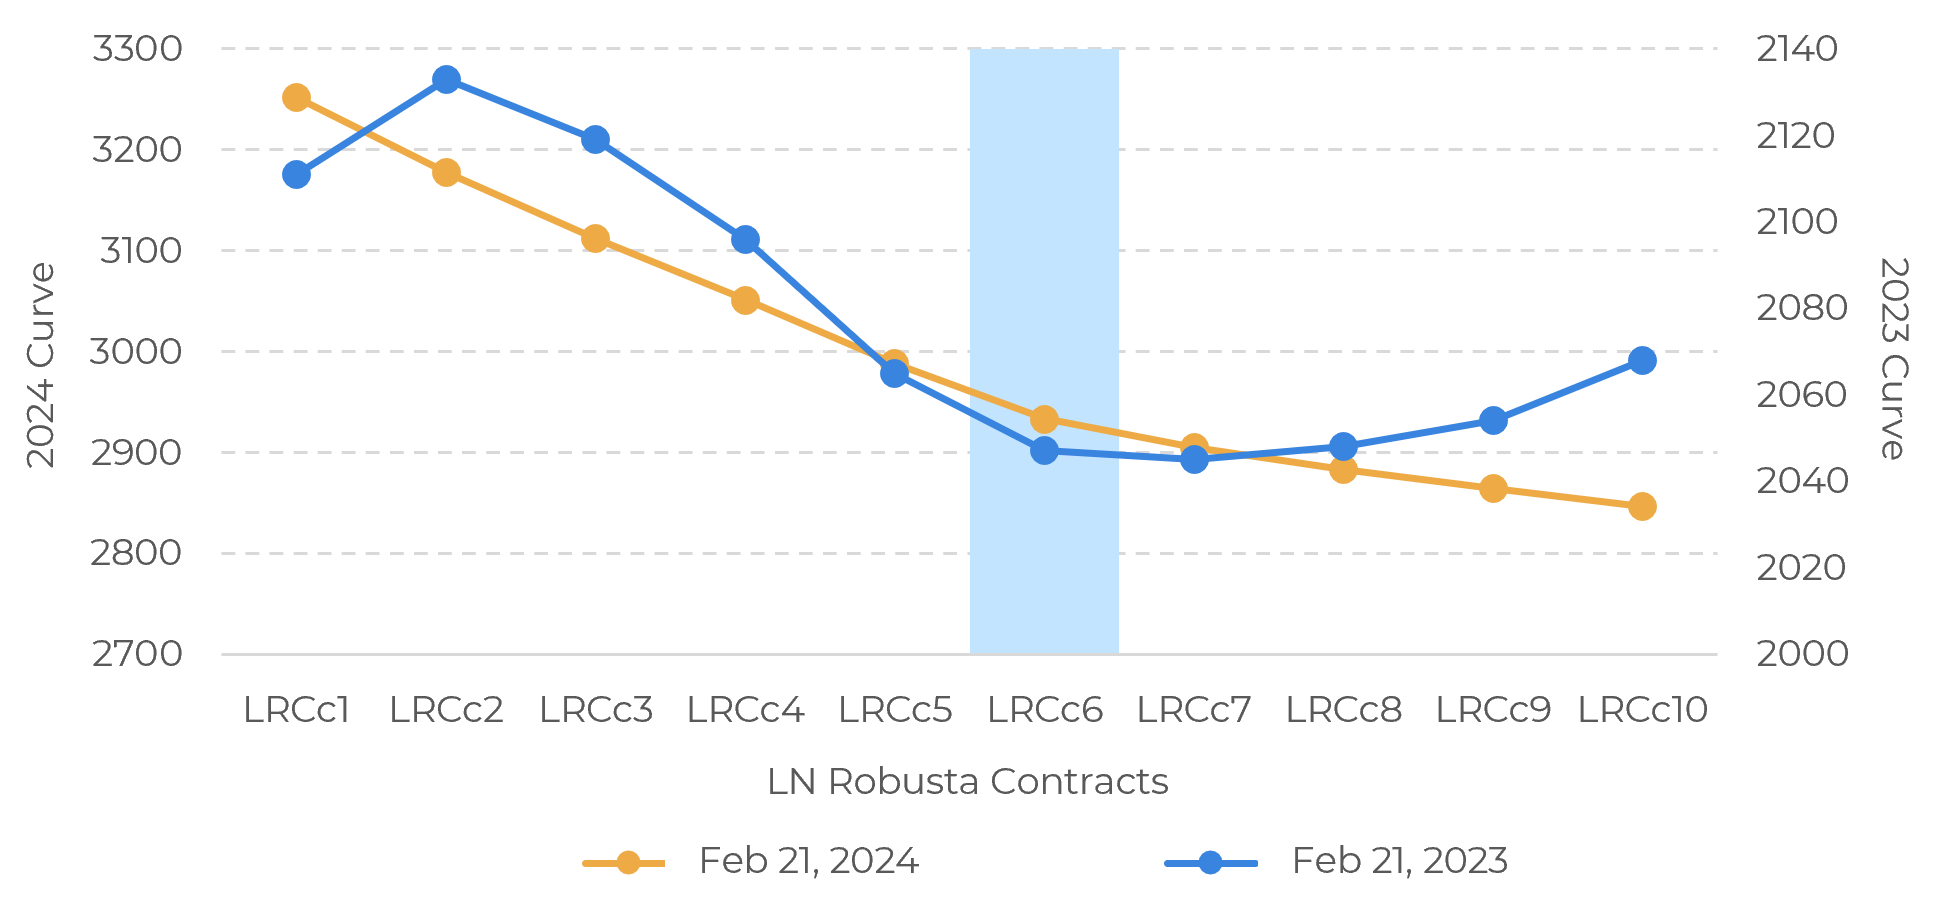
Source: ICE, Refinitiv
Figure 4: Weighted Export Seasonality (%)
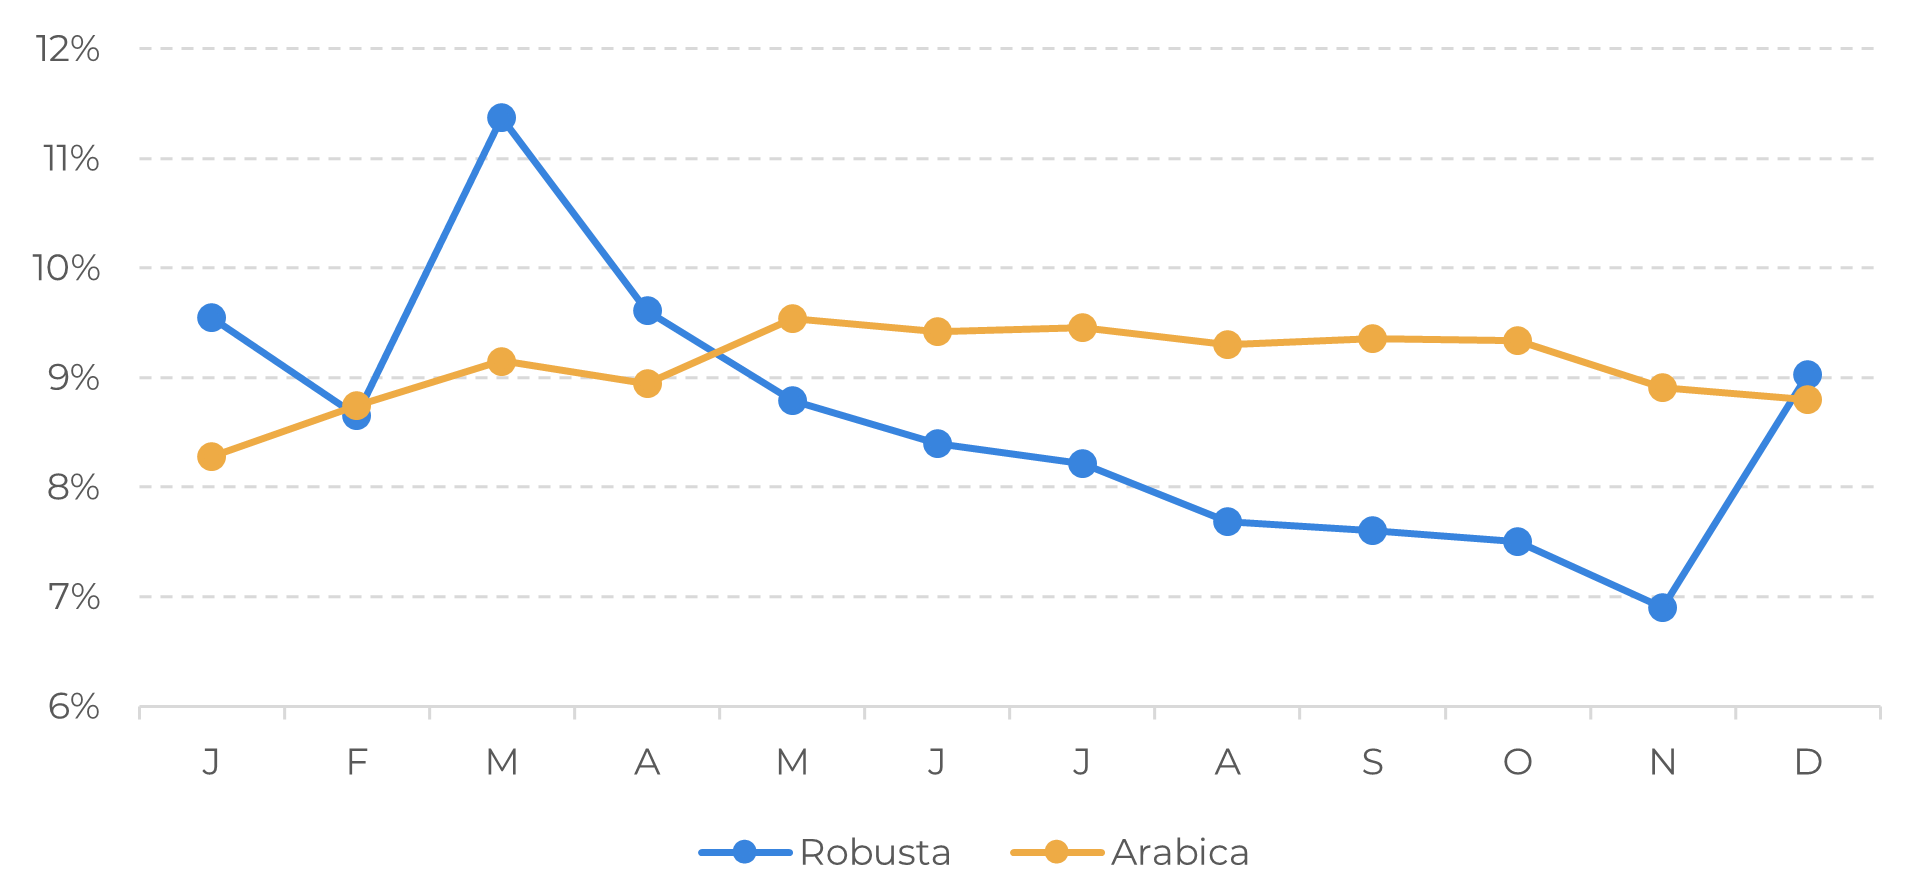
Source: hEDGEpoint
In Summary
In 2024, coffee prices correlate with other commodities, but arabica and robusta show distinct performances. Arabica, starting on a downtrend, aims to match robusta's gains. Arabica's curve, compared to a year ago, now has an earlier inflection point, aligning with July deliveries and expectations of higher output for the 24/25 crop in Brazil.
Robusta's curve, currently in backwardation, contrasts with a year ago when the 6th contract marked the inflection point, initially responding to seasonality. Looking forward, robusta's peak supply is expected in March, gradually decreasing, while arabica's seasonal index highlights May and July. The New York future curve reflects caution for the initial supply but a slightly optimistic outlook for the second, with the trend itself yet unaffected by certified stocks in NY.
Robusta's curve, currently in backwardation, contrasts with a year ago when the 6th contract marked the inflection point, initially responding to seasonality. Looking forward, robusta's peak supply is expected in March, gradually decreasing, while arabica's seasonal index highlights May and July. The New York future curve reflects caution for the initial supply but a slightly optimistic outlook for the second, with the trend itself yet unaffected by certified stocks in NY.
Weekly Report — Coffee
Written by Natália Gandolphi
natalia.gandolphi@hedgepointglobal.com
natalia.gandolphi@hedgepointglobal.com
Reviewed by Victor Arduin
victor.arduin@hedgepointglobal.com
www.hedgepointglobal.com
Disclaimer
This document has been prepared by hEDGEpoint Global Markets LLC and its affiliates ("HPGM") exclusively for informational and instructional purposes, without the purpose of creating obligations or commitments with third parties, and is not intended to promote an offer, or solicitation of an offer, to sell or buy any securities or investment products. HPGM and its associates expressly disclaim any use of the information contained herein that may result in direct or indirect damage of any kind. If you have any questions that are not resolved in the first instance of contact with the client (client.services@hedgepointglobal.com), please contact our internal ombudsman channel (ouvidoria@hedgepointglobal.com) or 0800-878-8408 (for clients in Brazil only).


Contact us
hedgepointhub.support@hedgepointglobal.com
ouvidoria@hedgepointglobal.com
Funchal Street, 418, 18º floor - Vila Olímpia São Paulo, SP, Brasil
Check our general terms and important notices.
This page has been prepared by Hedgepoint Schweiz AG and its affiliates (“Hedgepoint”) solely for informational and instructional purposes, without the purpose of instituting obligations or commitments to third parties, nor is it intended to promote an offer, or solicitation of an offer of sale or purchase relating to any securities, commodities interests or investment products. Hedgepoint and its associates expressly disclaim any use of the information contained herein that directly or indirectly result in damages or damages of any kind. Information is obtained from sources which we believe to be reliable, but we do not warrant or guarantee the timeliness or accuracy of this information. The trading of commodities interests such as futures, options, and swaps involves substantial risk of loss and may not be suitable for all investors. You should carefully consider wither such trading is suitable for you in light of your financial condition. Past performance is not necessarily indicative of future results. Customers should rely on their own independent judgement and/or advisors before entering in any transaction.Hedgepoint does not provide legal, tax or accounting advice and you are responsible for seeking any such advice separately.Hedgepoint Schweiz AG is organized, incorporated, and existing under the laws of Switzerland, is filiated to ARIF, the Association Romande des Intermédiaires Financiers, which is a FINMA-authorized Self-Regulatory Organization. Hedgepoint Commodities LLC is organized, incorporated, and existing under the laws of the USA, and is authorized and regulated by the Commodity Futures Trading Commission (CFTC) and a member of the National Futures Association (NFA) to act as an Introducing Broker and Commodity Trading Advisor. HedgePoint Global Markets Limited is Regulated by the Dubai Financial Services Authority. The content is directed at Professional Clients and not Retail Clients. Hedgepoint Global Markets PTE. Ltd is organized, incorporated, and existing under the laws of Singapore, exempted from obtaining a financial services license as per the Second Schedule of the Securities and Futures (Licensing and Conduct of Business) Act, by the Monetary Authority of Singapore (MAS). Hedgepoint Global Markets DTVM Ltda. is authorized and regulated in Brazil by the Central Bank of Brazil (BCB) and the Brazilian Securities Commission (CVM). Hedgepoint Serviços Ltda. is organized, incorporated, and existing under the laws of Brazil. Hedgepoint Global Markets S.A. is organized, incorporated, and existing under the laws of Uruguay. In case of questions not resolved by the first instance of customer contact (client.services@Hedgepointglobal.com), please contact internal ombudsman channel (ombudsman@hedgepointglobal.com – global or ouvidoria@hedgepointglobal.com – Brazil only) or call 0800-8788408 (Brazil only).Integrity, ethics, and transparency are values that guide our culture. To further strengthen our practices, Hedgepoint has a whistleblower channel for employees and third-parties by e-mail ethicline@hedgepointglobal.com or forms Ethic Line – Hedgepoint Global Markets.Security note: All contacts with customers and partners are conducted exclusively through our domain @hedgepointglobal.com. Do not accept any information, bills, statements or requests from different domains and pay special attention to any variations in letters or spelling, as they may indicate a fraudulent situation.“HedgePoint” and the “HedgePoint” logo are marks for the exclusive use of HedgePoint and/or its affiliates. Use or reproduction is prohibited, unless expressly authorized by HedgePoint. Furthermore, the use of any other marks in this document has been authorized for identification purposes only. It does not, therefore, imply any rights of HedgePoint in these marks or imply endorsement, association or seal by the owners of these marks with HedgePoint or its affiliates.