
Mar 1
/
Natália Gandolphi
Coffee Weekly Report - 2024 03 01
Back to main blog page
- This report explores the correlation between the NY-LN arbitrage and the spread between arabica and conilon prices in Brazil.
- Analyzing daily data from April 2008 to February 2024, a strong positive correlation is observed between the NY-LN arb and the Ara-Con USD/bag spread, influenced by global arabica and robusta supply and demand dynamics. The correlation is weaker with the Ara-Con BRL/bag spread due to currency fluctuations.
- Examining developments from 2022 to 2024, the USD/bag spread is 30% below the historical average, favoring arabica for international buyers, while the BRL/bag spread is 12% above the average, favoring conilon sales domestically.
- Historical correlations faced disruptions in 2010 and more significantly between 2016 and 2018, attributed to Brazil's unique fluid market dynamics and recovery from the El Niño phenomenon.
- We observe that future trends may depend on conilon availability in the 24/25 cycle, influenced by blend decisions, production, and price dynamics. The potential for lower correlation between Brazil's internal and external coffee markets is outlined but remains uncertain.
Domestic price dynamic in Brazil
In this report, we will dive into the relationship between the NY-LN arbitrage and the local spread between arabica and conilon prices in Brazil. First, let's understand the series that will be used for this analysis: i) the daily arbitrage (or difference) between NY arabica prices and LN robusta prices, in c/lb, and ii) the spread between the local reference prices for arabica (type 6, SP/MG) and conilon (13Up, Vit-ES), in both BRL/bag and USD/bag, released by Cepea.
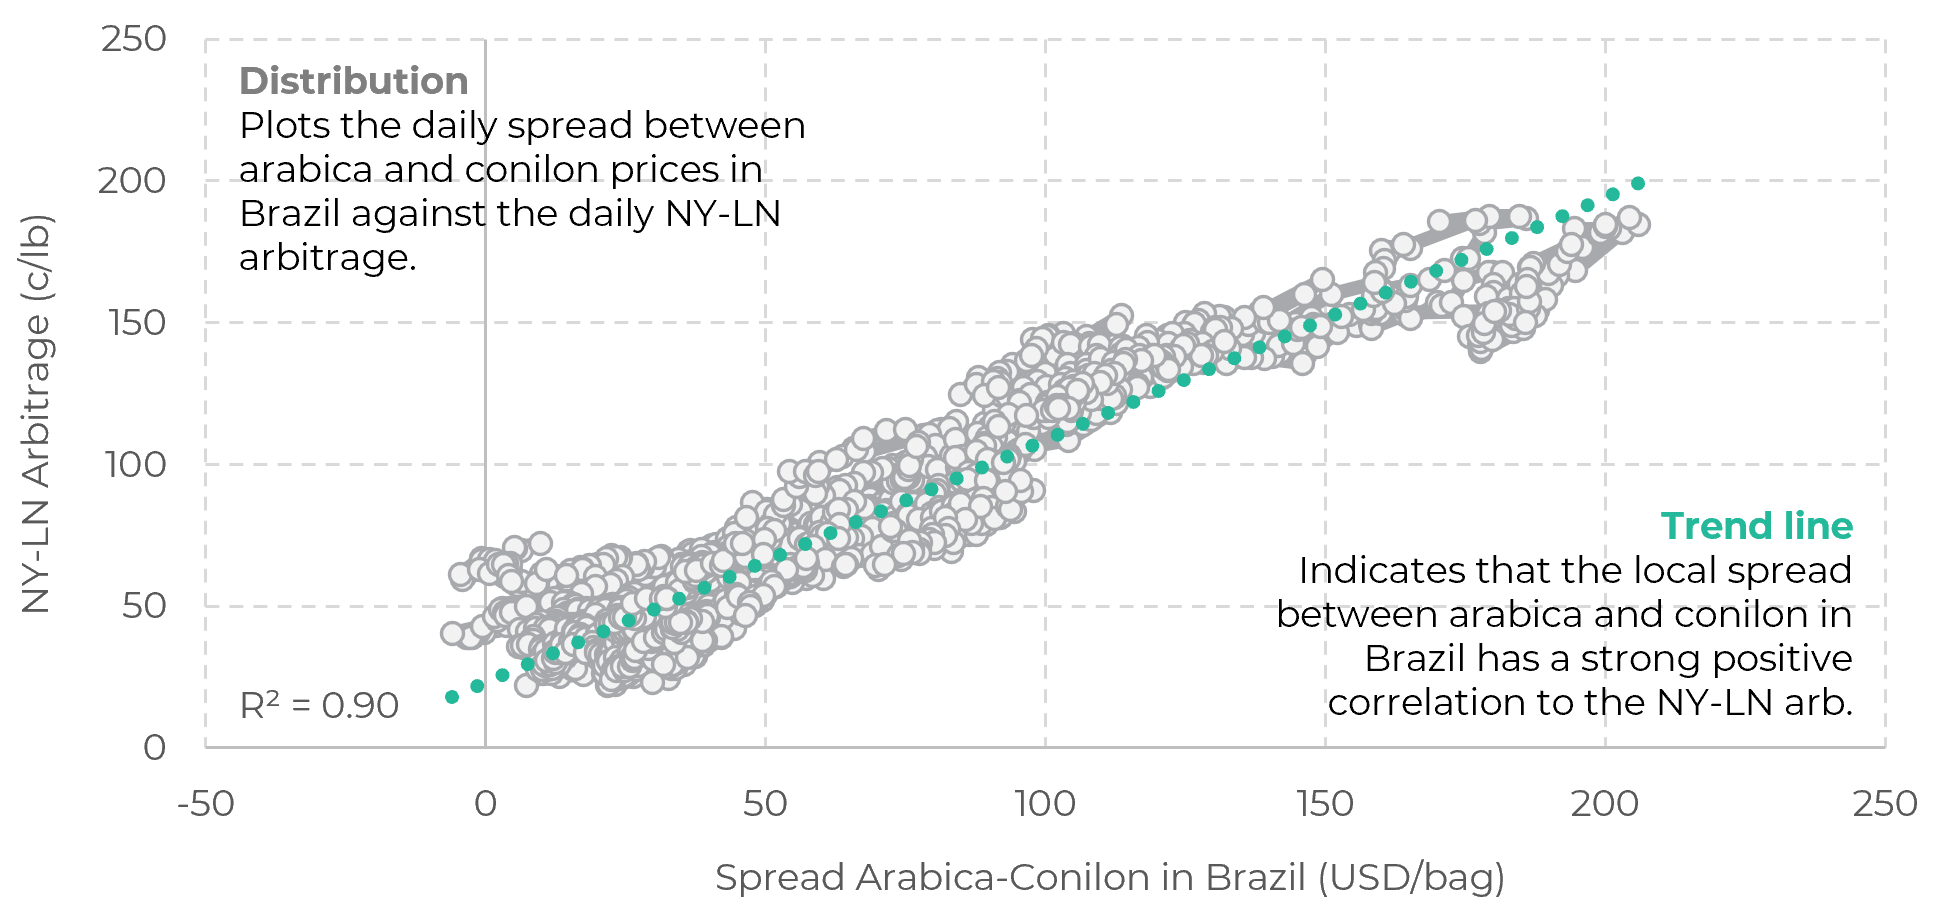
First, looking at the daily distribution using data from April 2008 to February 2024, we can observe that the NY-LN arb and the Ara-Con USD/bag spread are strongly and positively correlated. Naturally, the global arabica and robusta S&Ds will impact the NY-LN arb, and that dynamic will trickle down into the world's largest coffee producer and exporter, Brazil.
Therefore, it stands to reason that the two series will correlate well. The correlation against the Ara-Con spread BRL/bag is lower though, with the Brazilian currency impact affecting the relationship (the historical correlation between NY-LN Arb and Ara-Con Spread USD/bag is 0.95, whereas for BRL/bag it is 0.67).
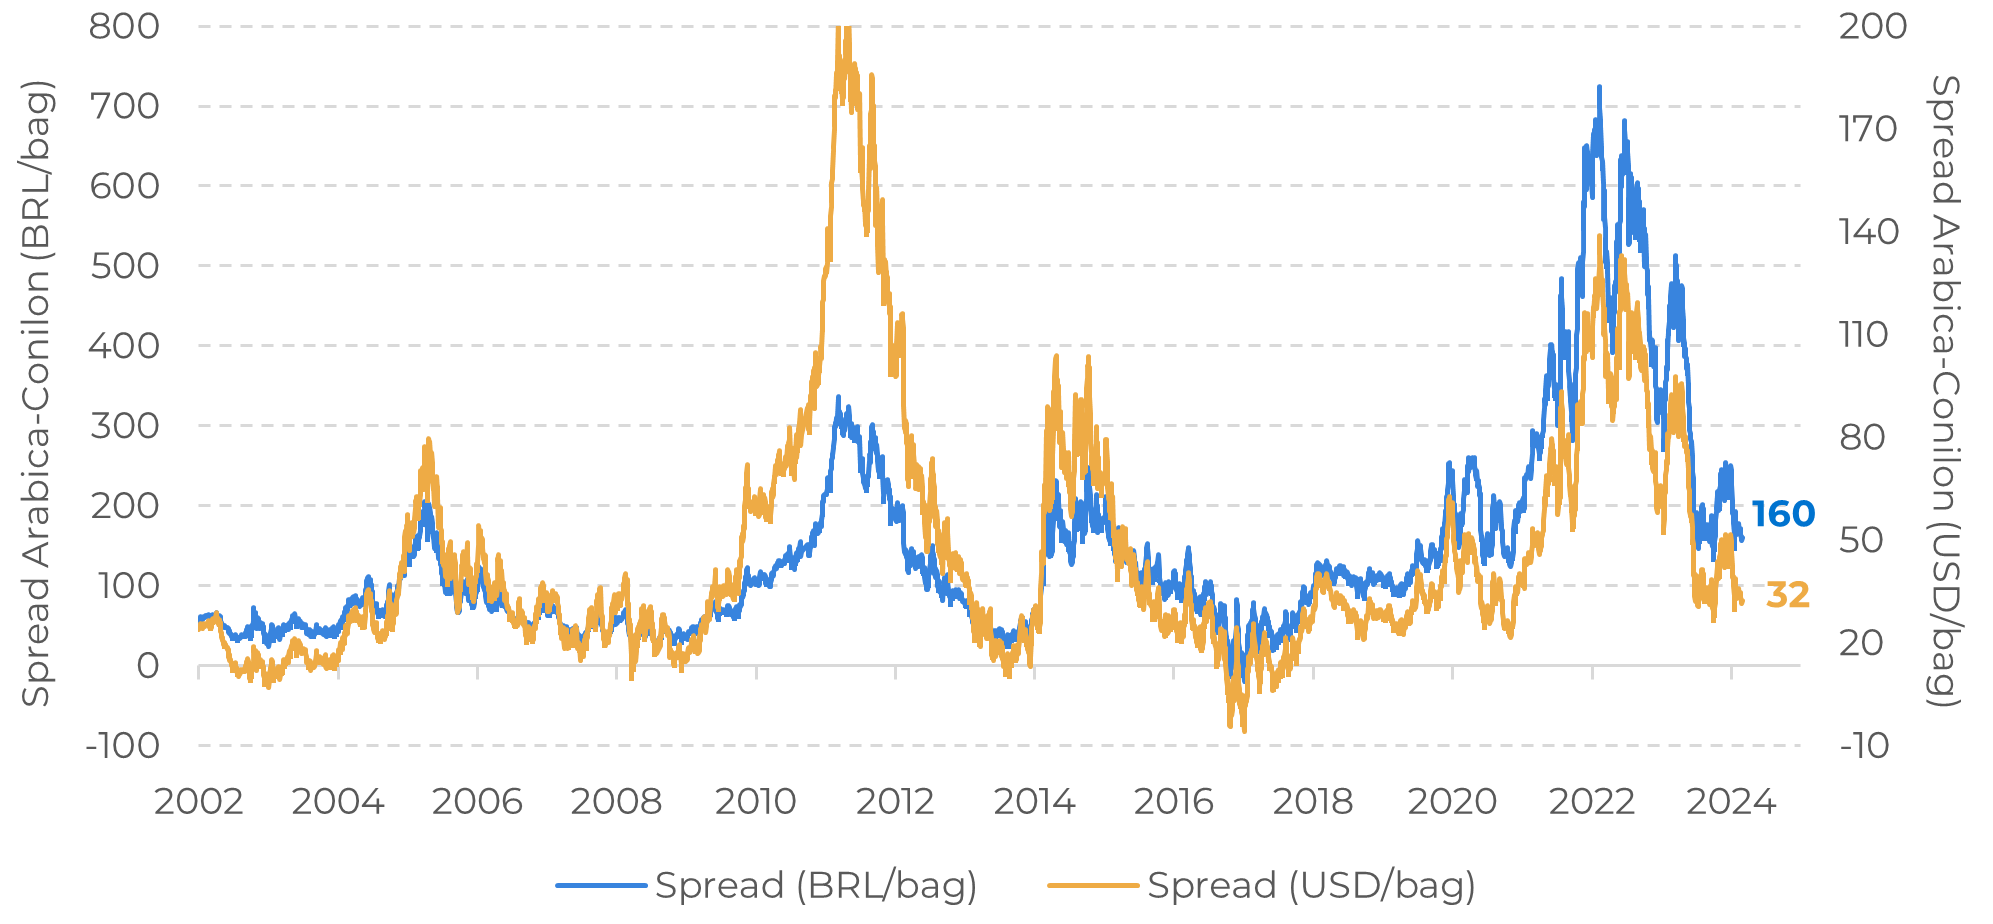
Now, we need to look at the developments for the Ara-Con spread. Considering data from 2022 to 2024, the USD/bag spread peaked in 2011, whereas the BRL/bag spread peaked in 2022, despite both showing very similar patterns. Currently, the USD/bag spread is 30% below the historical average (32 USD/bag vs. 46 USD/bag), whereas the BRL/bag spread is 12% above the historical average (160 BRL/bag vs. 143 BRL/bag).
Therefore, it stands to reason that the two series will correlate well. The correlation against the Ara-Con spread BRL/bag is lower though, with the Brazilian currency impact affecting the relationship (the historical correlation between NY-LN Arb and Ara-Con Spread USD/bag is 0.95, whereas for BRL/bag it is 0.67).
Now, we need to look at the developments for the Ara-Con spread. Considering data from 2022 to 2024, the USD/bag spread peaked in 2011, whereas the BRL/bag spread peaked in 2022, despite both showing very similar patterns. Currently, the USD/bag spread is 30% below the historical average (32 USD/bag vs. 46 USD/bag), whereas the BRL/bag spread is 12% above the historical average (160 BRL/bag vs. 143 BRL/bag).
This suggests, therefore, that there is currently more incentive for international buyers to choose arabica over conilon (since the difference between the two in USD/bag is lower than average). In the domestic market, however, the difference between prices favors conilons, although the difference is more narrow and therefore more subject to change.
Now that the series used in this analysis have been understood, as well as their own patterns, let's look at their correlation results vs. the NY-LN arbitrage.
Figure 1: NY-LN Arbitrage vs. Spread Arabica-Conilon in Brazil
Source: Cepea, ICE, Refinitiv, hEDGEpoint
Figure 2: Future Curve – NY Arabica (c/lb)
Source: Cepea
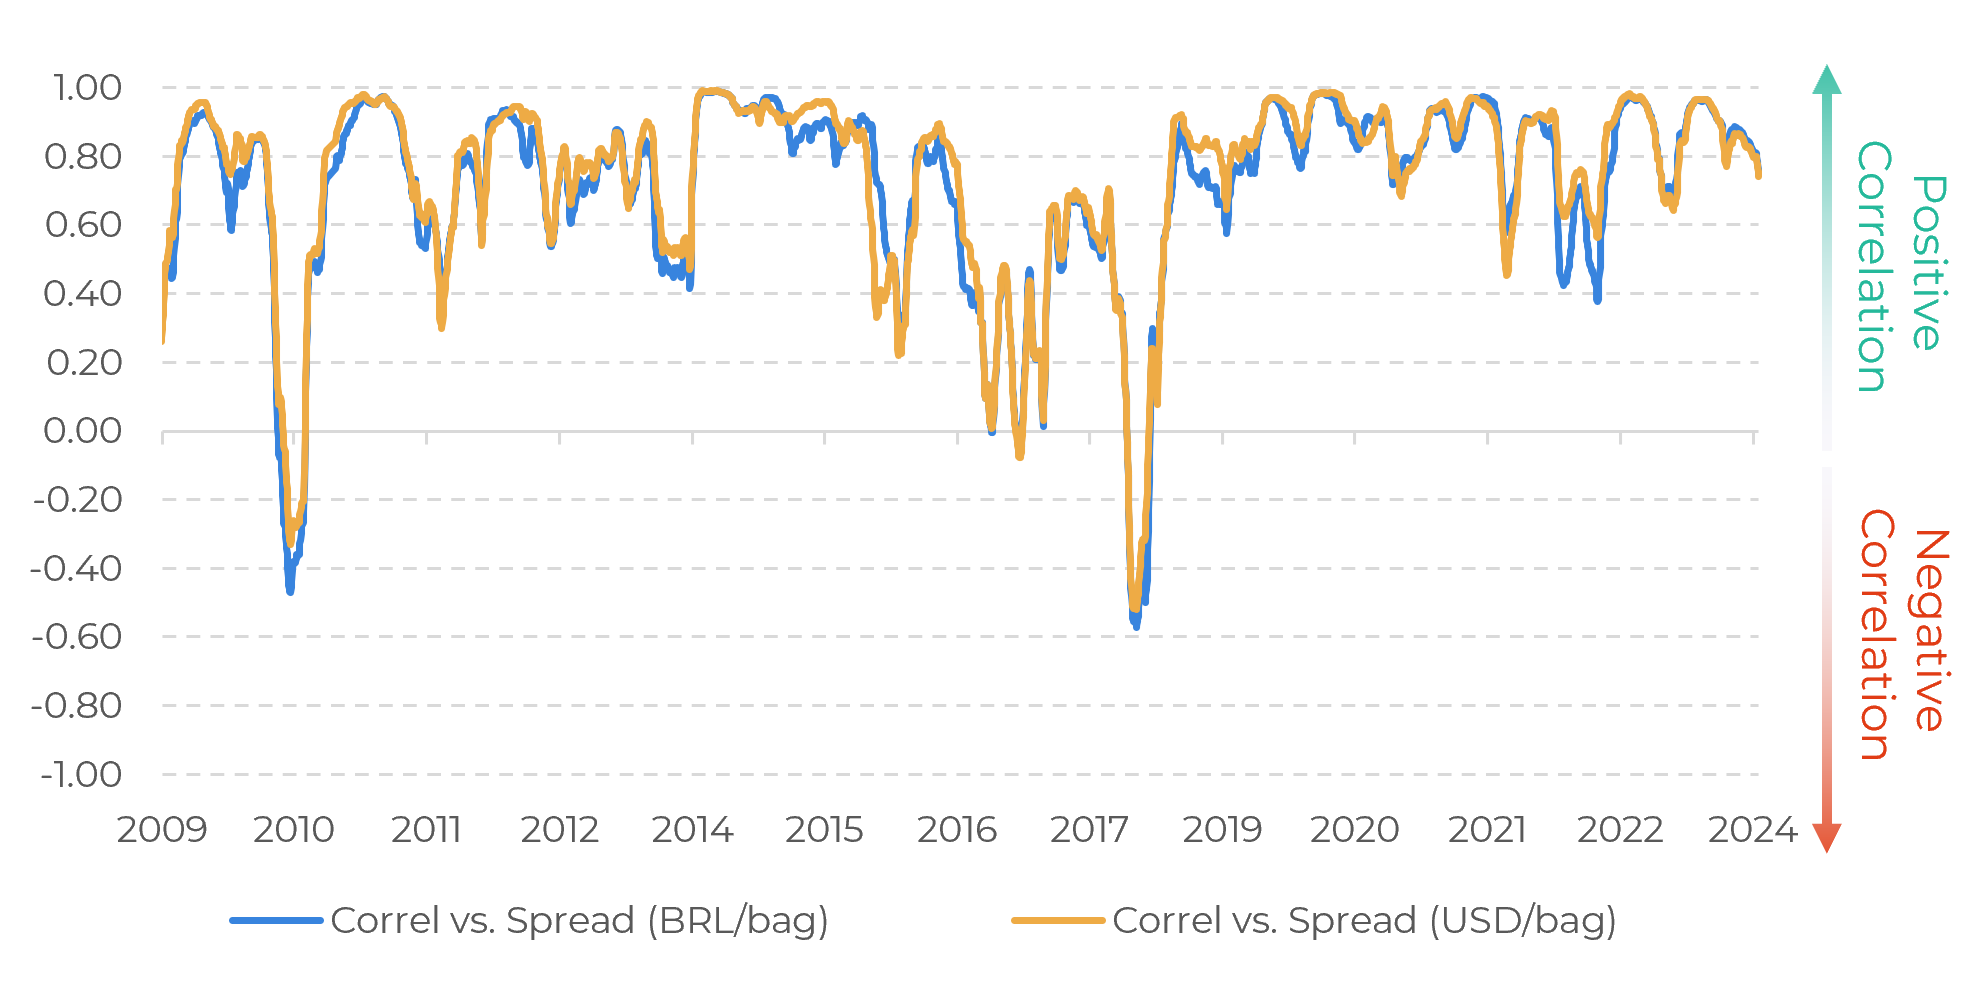
Historically, the USD/bag spread has a stronger correlation (as explained earlier in this text). Still, there are two points in time when both heavily lost correlation to the NY-LN arb. The first point in time was in 2010, whereas the second one, more substantial and that lasted longer, took place between 2016 and 2018.
This happened because the NY-LN arb received some support, whereas the local spreads did not follow suit. This happened due to the implicit characteristic seen in Brazil, being the largest global producer/exporter, and also one of the top countries in consumption figures as well: the decision to either export or consume a certain type of coffee locally is more fluid than in other origins, that usually focus either on arabica or robusta, and also do not rank as high as Brazil in terms of consumption.
Figure 3: Correlation between NY-LN Arb and Spread in BRL/bag and USD/bag
Source: Cepea, ICE, Refinitiv, hEDGEpoint
Back in 2016, Brazil and Vietnam were both affected by the El Niño phenomenon - although the two countries did eventually recover, especially in the 18/19 cycle, and especially Brazil. It took a while for the correlation between the local market in Brazil and international prices to return to normal levels. Currently, with a much more fluid dynamic between what gets exported and what is consumed internally in Brazil, and the same expectation of a faster rate of recovery for Brazil compared to Vietnam, the question arises: to what extent can correlation reduce between NY-LN arb and local spreads in Brazil?
In Summary
Ultimately, it will heavily depend on final conilon availability in the 24/25 cycle. Blend decisions - which reflect on exports - are bound by total availability (production + stocks) first, and by price dynamic second.
At this point, arabica seems to have been less affected by El Niño when compared to conilon, similar to what happened between 14/15 and 16/17 (20% cumulative drop in arabica production, 49% cumulative drop in conilon production), although the impact of the crop failure itself is not comparable. Therefore, the ingredients for lower correlation between the internal and external market in Brazil are set, but it’s yet uncertain if the market will bring enough heat.
Weekly Report — Coffee
Written by Natália Gandolphi
natalia.gandolphi@hedgepointglobal.com
natalia.gandolphi@hedgepointglobal.com
Reviewed by Lívea Coda
livea.coda@hedgepointglobal.com
www.hedgepointglobal.com
Disclaimer
This document has been prepared by hEDGEpoint Global Markets LLC and its affiliates ("HPGM") exclusively for informational and instructional purposes, without the purpose of creating obligations or commitments with third parties, and is not intended to promote an offer, or solicitation of an offer, to sell or buy any securities or investment products. HPGM and its associates expressly disclaim any use of the information contained herein that may result in direct or indirect damage of any kind. If you have any questions that are not resolved in the first instance of contact with the client (client.services@hedgepointglobal.com), please contact our internal ombudsman channel (ouvidoria@hedgepointglobal.com) or 0800-878-8408 (for clients in Brazil only).


Contact us
hedgepointhub.support@hedgepointglobal.com
ouvidoria@hedgepointglobal.com
Funchal Street, 418, 18º floor - Vila Olímpia São Paulo, SP, Brasil
Check our general terms and important notices.
This page has been prepared by Hedgepoint Schweiz AG and its affiliates (“Hedgepoint”) solely for informational and instructional purposes, without the purpose of instituting obligations or commitments to third parties, nor is it intended to promote an offer, or solicitation of an offer of sale or purchase relating to any securities, commodities interests or investment products. Hedgepoint and its associates expressly disclaim any use of the information contained herein that directly or indirectly result in damages or damages of any kind. Information is obtained from sources which we believe to be reliable, but we do not warrant or guarantee the timeliness or accuracy of this information. The trading of commodities interests such as futures, options, and swaps involves substantial risk of loss and may not be suitable for all investors. You should carefully consider wither such trading is suitable for you in light of your financial condition. Past performance is not necessarily indicative of future results. Customers should rely on their own independent judgement and/or advisors before entering in any transaction.Hedgepoint does not provide legal, tax or accounting advice and you are responsible for seeking any such advice separately.Hedgepoint Schweiz AG is organized, incorporated, and existing under the laws of Switzerland, is filiated to ARIF, the Association Romande des Intermédiaires Financiers, which is a FINMA-authorized Self-Regulatory Organization. Hedgepoint Commodities LLC is organized, incorporated, and existing under the laws of the USA, and is authorized and regulated by the Commodity Futures Trading Commission (CFTC) and a member of the National Futures Association (NFA) to act as an Introducing Broker and Commodity Trading Advisor. HedgePoint Global Markets Limited is Regulated by the Dubai Financial Services Authority. The content is directed at Professional Clients and not Retail Clients. Hedgepoint Global Markets PTE. Ltd is organized, incorporated, and existing under the laws of Singapore, exempted from obtaining a financial services license as per the Second Schedule of the Securities and Futures (Licensing and Conduct of Business) Act, by the Monetary Authority of Singapore (MAS). Hedgepoint Global Markets DTVM Ltda. is authorized and regulated in Brazil by the Central Bank of Brazil (BCB) and the Brazilian Securities Commission (CVM). Hedgepoint Serviços Ltda. is organized, incorporated, and existing under the laws of Brazil. Hedgepoint Global Markets S.A. is organized, incorporated, and existing under the laws of Uruguay. In case of questions not resolved by the first instance of customer contact (client.services@Hedgepointglobal.com), please contact internal ombudsman channel (ombudsman@hedgepointglobal.com – global or ouvidoria@hedgepointglobal.com – Brazil only) or call 0800-8788408 (Brazil only).Integrity, ethics, and transparency are values that guide our culture. To further strengthen our practices, Hedgepoint has a whistleblower channel for employees and third-parties by e-mail ethicline@hedgepointglobal.com or forms Ethic Line – Hedgepoint Global Markets.Security note: All contacts with customers and partners are conducted exclusively through our domain @hedgepointglobal.com. Do not accept any information, bills, statements or requests from different domains and pay special attention to any variations in letters or spelling, as they may indicate a fraudulent situation.“HedgePoint” and the “HedgePoint” logo are marks for the exclusive use of HedgePoint and/or its affiliates. Use or reproduction is prohibited, unless expressly authorized by HedgePoint. Furthermore, the use of any other marks in this document has been authorized for identification purposes only. It does not, therefore, imply any rights of HedgePoint in these marks or imply endorsement, association or seal by the owners of these marks with HedgePoint or its affiliates.
We have updated our Terms & Conditions to reflect improvements to our platform, data handling practices, and the overall experience we provide to our clients.
To continue using the Hedgepoint HUB, please review and accept the updated terms.