Mar 22 / Natália Gandolphi

Coffee Weekly Report - 2024 03 22

  Back to main blog page
  • The report delves into European Union coffee imports, emphasizing a notable concentration among the top 5 exporting nations, now constituting 79% of imports.

  • Contrary to seasonal norms, this concentration is steadily rising, reflecting post-pandemic trade dynamics.

  • Notably, Brazil holds a dominant 45% share, with Uganda emerging as a robusta alternative and Vietnam facing supply challenges.

  • Decreased EU imports since 2022, driven by heightened storage costs and deforestation legislation, have spurred greater reliance on local sources, bolstering prices despite reduced imports and heightened concentration.

  • Projected ending stocks for the 23/24 cycle stand at 9.08M bags, a 25% increase, with historical parallels hinting at potential recovery in the 24/25 cycle, barring significant disruptions to crop development.

Trade flow expectations from the EU lens

In this report, we will dive into the profile of European Union imports, in order to better understand the trade flow structure changes that have happened over the last few quarters – and what to expect for the upcoming ones.

First and foremost: market concentration. The share of imported coffee from the top 5 exporting countries (Brazil, Vietnam, Uganda, Peru, and Colombia – as of Q4/23) has increased to 79%, according to the last quarterly consolidated data by Eurostat (Figure 1). The chart shows that, while seasonality does kick in throughout the year, that movement has been slowly fading on the lows. This means that with every year that passes since the pandemic, the expected decrease in concentration between Q2 and Q3 has actually held higher levels, hence the upward-sloping trendline.

Reliance on these top 5 exporters has increased over the past 5 years, culminating in a short-term high in Q4/23. It’s also important to note the role that each country has had individually: Figure 2 shows three remarkable points: i) Brazil, while always being the lead, has taken a 45% share in the last quarter, the highest in the series (due to a heavier reliance on Brazilian conilons too). ii) Uganda has been solidifying itself as a robusta alternative. iii) Vietnam exported its lowest share in 4Q/23, reflecting supply concerns.

Figure 1: Share in European Union Imports – Top 5 Exporting Countries

Source: Eurostat

Figure 2: Share in European Union Imports – Top 5 Exporting Countries, by Country

Source: Eurostat

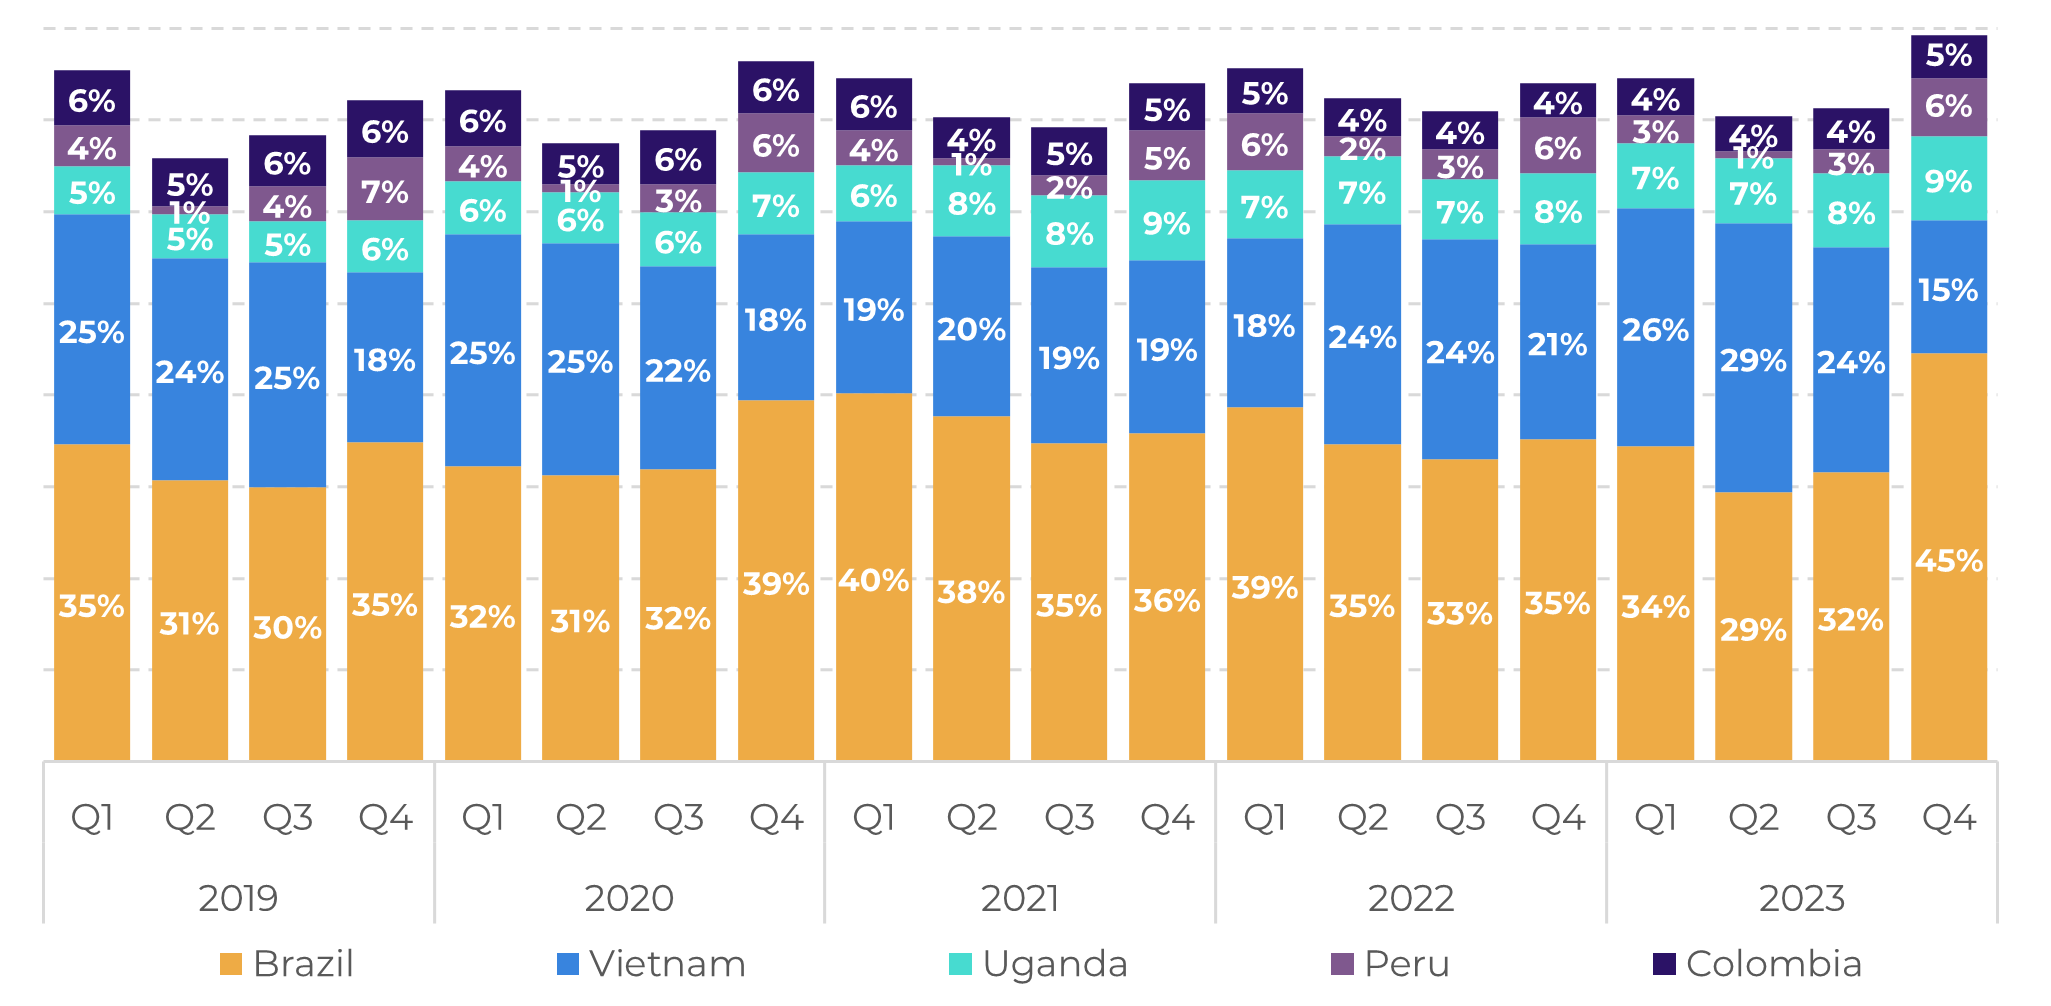
Overall, the bloc has seen a steady decrease in imports since 2022 (Figure 3) – a direct reflection of higher storage costs, as seen in previous reports. The more substantial drop between Q2/23 and Q3/23 was also linked to new legislation surrounding deforestation in countries of origin.
Consequently, destination countries have depended more on these local supplies, which has led to a withdrawal of stocks, leaving this fact as one of the main points of support for prices, especially with the new trade flow structure – lower imports, greater concentration.

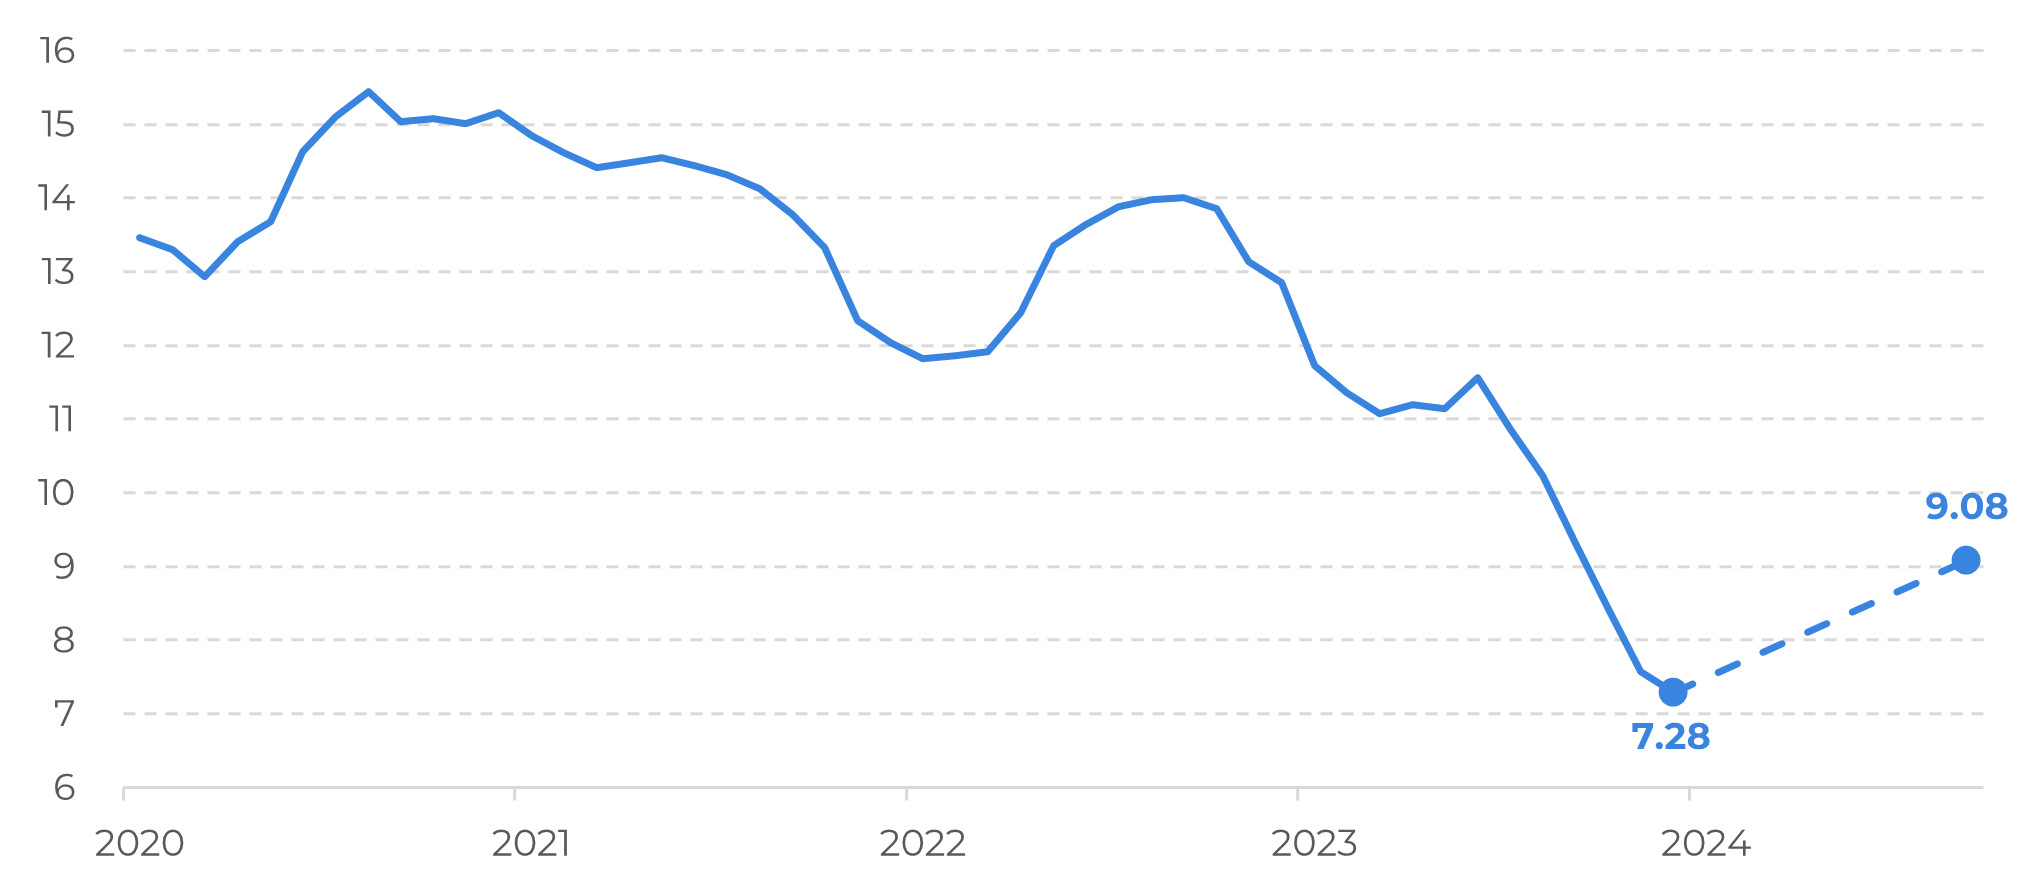
Currently, using USDA figures as a marker for what the market currently expects, ending stocks for the 23/24 cycle are being estimated at 9.08 million bags in the European Union. This would require a 25% increase in stocks – which is, in fact, higher than the average expected for the period (+6%, considering data from the last 10 years). Still, it's important to note that stocks in the EU increased by 38% between December 2013 and September 2014, and there are similarities: origin stocks were 7% higher in the 13/14 cycle compared to 13/12, and helped to sustain trade flow during a global deficit point (as origins were heavily affected by El Niño). Therefore, the recovery to the 24/25 cycle may be a mirror of its historical counterpart.

Figure 3: European Union – Quarterly Imports (M bags)

Source: Eurostat

Figure 4: European Union Stocks and USDA Estimate (M bags)

Source: ECF, USDA

In Summary

The report analyzes European Union imports, highlighting a growing concentration among the top 5 exporting countries for coffee, which now account for 79% of imports. This trend has been steadily increasing, contrary to seasonal expectations, indicating a shift in trade flow dynamics post-pandemic. Notably, Brazil dominates with a 45% share, while Uganda emerges as a robusta alternative and Vietnam faces supply concerns.
Importantly, EU imports have decreased since 2022 due to higher storage costs, leading to increased reliance on local supplies.

This has supported prices despite lower imports and higher concentration. Looking ahead, ending stocks for the 23/24 cycle are estimated at 9.08M bags, a 25% increase, with parallels drawn to historical trends suggesting a potential recovery in the 24/25 cycle, all else equal in terms of 24/25 crop development.

Weekly Report — Coffee

Written by Natália Gandolphi
natalia.gandolphi@hedgepointglobal.com
Reviewed by Lívea Coda
livea.coda@hedgepointglobal.com
www.hedgepointglobal.com

Disclaimer

This document has been prepared by hEDGEpoint Global Markets LLC and its affiliates ("HPGM") exclusively for informational and instructional purposes, without the purpose of creating obligations or commitments with third parties, and is not intended to promote an offer, or solicitation of an offer, to sell or buy any securities or investment products. HPGM and its associates expressly disclaim any use of the information contained herein that may result in direct or indirect damage of any kind. If you have any questions that are not resolved in the first instance of contact with the client (client.services@hedgepointglobal.com), please contact our internal ombudsman channel (ouvidoria@hedgepointglobal.com) or 0800-878-8408 (for clients in Brazil only).

To access this report, you need to be a subscriber.