
May 31
/
Natália Gandolphi
Coffee Weekly Report - 2024 05 31
Back to main blog page
- The European Coffee Federation reported a 700,000-bag increase in coffee stocks by April compared to March, despite Q1 imports being 300,000 bags below average.
- Brazil’s shipments surged to 43% of the EU's total in the first half of the 23/24 cycle, offsetting declines from Vietnam, Indonesia, and India, whose combined share fell from 33% to 26%.
- While washed arabica imports from Central America and Mexico consistently decreased, these losses were counterbalanced by higher shares of Colombian and Peruvian coffees.
- Looking at the cumulative figures for 23/24 (Oct/23-Mar/24), EU imports remain 1.5M bags below average and 1.8M bags lower than last year, although consumption is 200,000 bags above the historical average.
- Similar trends are observed globally, with Brazil filling gaps left by traditional suppliers. In the U.S., the U.K., China, and Japan, Brazil’s market share increased significantly, with declines from Vietnam, Indonesia, and India.
Destination analysis through the EU lens
The European Coffee Federation has released stocks data up to April, showing an addition of 700,000 bags compared to March. With import data available until March, the decrease in the first quarter is mirrored in both stocks and imports. However, April is expected to change the landscape and explain the stock recovery, given that cumulative imports in Q1 were approximately 300,000 bags below the average.
In the first half of the 2023/24 cycle, Brazil alone accounted for 43% of the bloc’s imports, compared to 35% during the same period in 2022/23. This increase helped offset the decrease in imports from Vietnam, Indonesia, and India, which collectively fell from 33% to 26%. For washed arabica, imports from Central America and Mexico consistently decreased, but this was counterbalanced by a higher share of Colombian and Peruvian coffees.
Looking at the perspective for the 23/24 cycle (Oct/23 to Mar/24), cumulative imports in the EU are 1.5 million bags below the average levels and 1.8 million bags less than the volume reported during the same period in the last cycle. On the other hand, apparent consumption is 200,000 bags above the historical average.
Figure 1: European Union Green Coffee Imports (M bags)
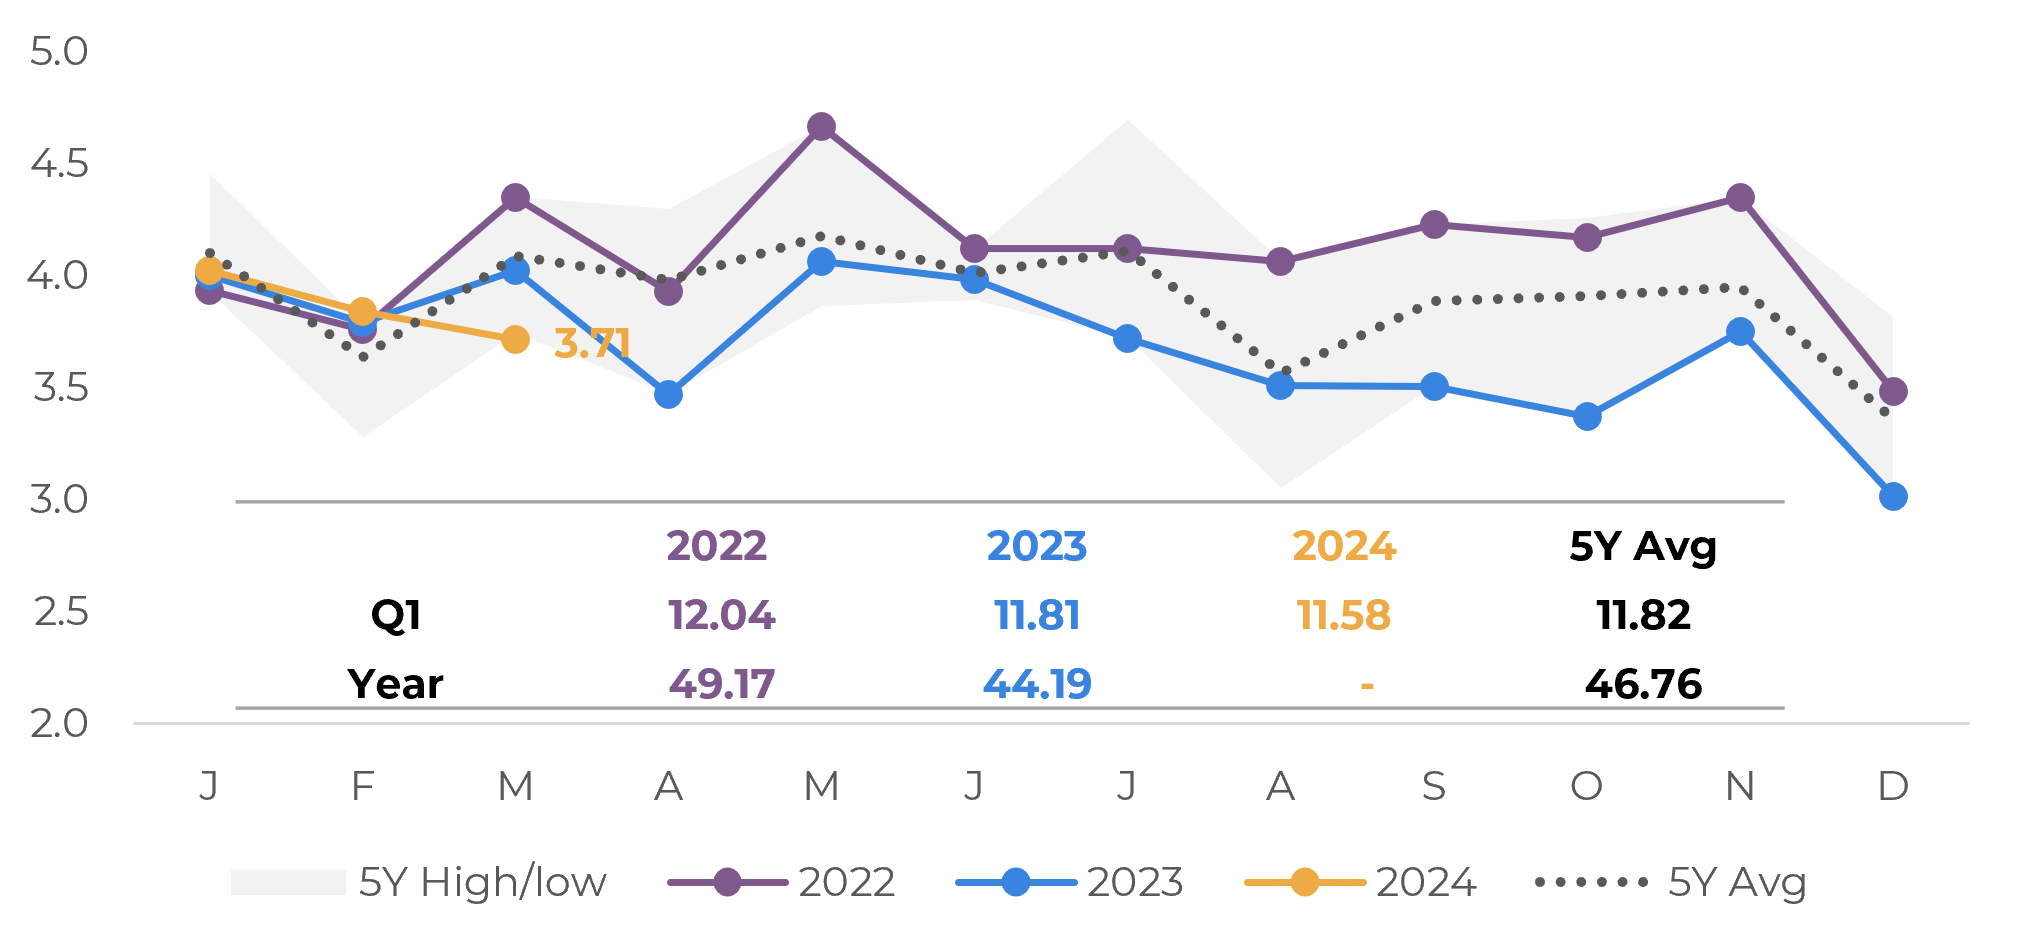
Source: Eurostat, Hedgepoint
Figure 2: European Coffee Federation Stocks (M bags)
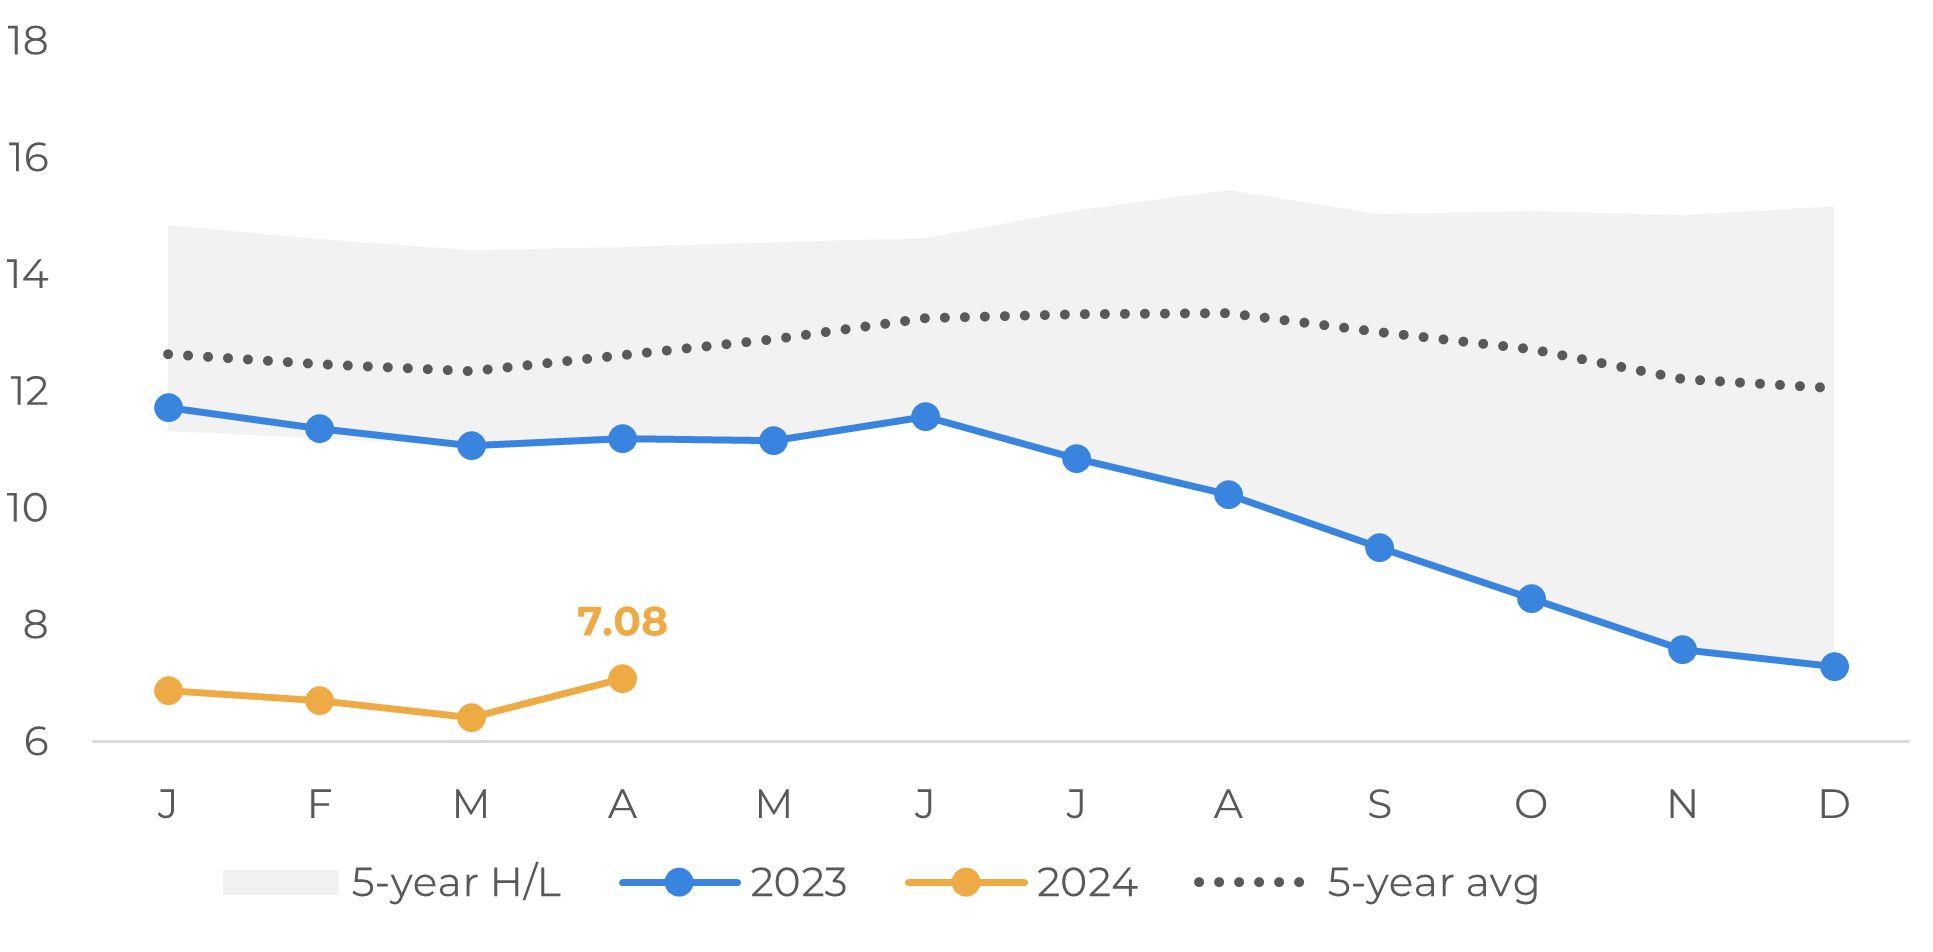
Source: ECF
In other destinations, Brazil is also taking up a larger market share, filling a gap left by other countries.
Similar to the situation observed in the European Union, the United States has reported a smaller share of robusta intake by traditional origins (Vietnam, Indonesia, India) and also a smaller participation by Central America and Mexico, whereas South American origins have remained steady, cumulatively.
Brazil also took up a larger share in the United Kingdom: 63% of all imports in the 23/24 cycle so far, vs. 26% in 22/23! Vietnam, Indonesia, and India decreased from 34% to 15%.
China followed a similar trend as well: Brazil represents 52% of all imports in 23/24, alongside other South American origins (24% vs. 14%), whereas imports from traditional robusta origins decreased from 22% to 11% this cycle.
In contrast, Japan sees a decrease mostly in Colombian and Peruvian supplies (the opposite of the trend seen in the EU). Brazil takes up 40% (vs. 37% last cycle), robusta origins take up 34% (vs. 33%).
Figure 3: European Union – Imports by Country/Group (‘000 bags)
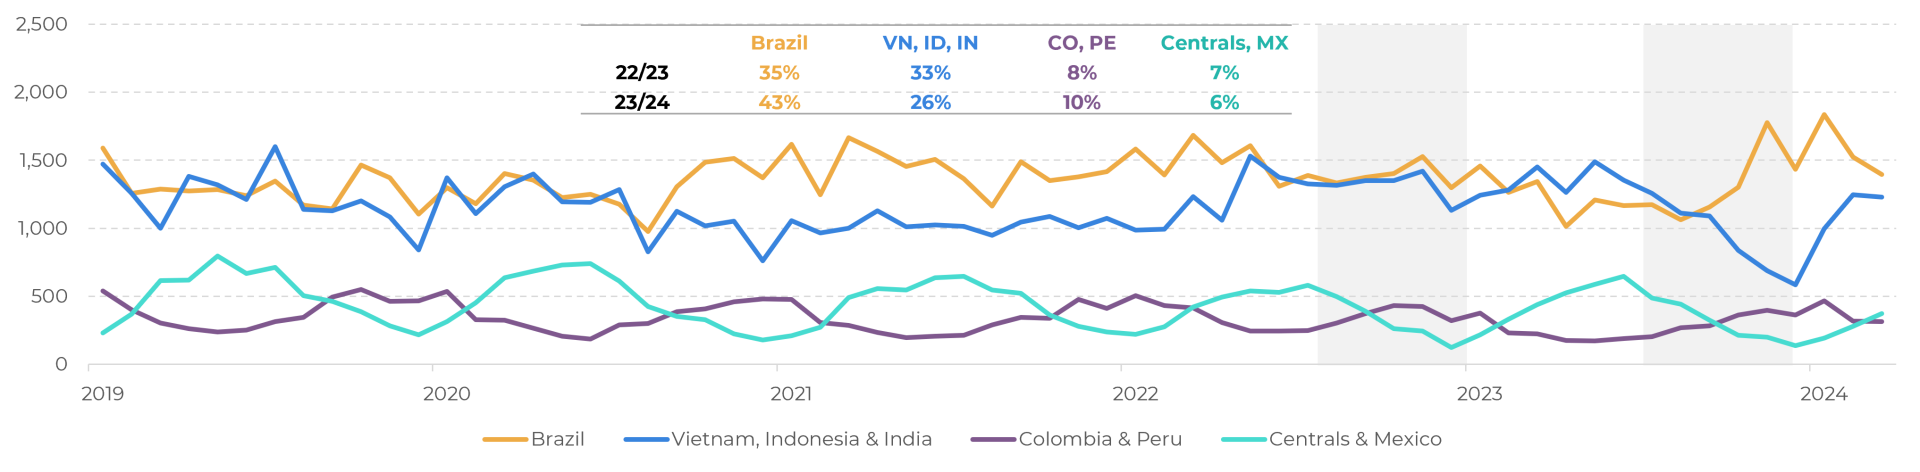
Source: Eurostat, Hedgepoint
In Summary
The increase in ECF stocks shows that seasonality is kicking in, as well as changes in trade flow when compared to the second half of 2023.
Since stock levels in destinations are still far from average, they remain as a bullish point in the short-term to medium-term. Once destinations start to decrease benchmark rates, and given that spreads are shorter, these same stocks are expected to become a bearish fundamental in the medium to long-term.
It’s also important to note that Brazil has exceeded previous exports’ records in 2024, by taking up a larger share in destination imports across the board – with the most notable changes occurring in the European Union, United Kingdom, and China.
Weekly Report — Coffee
Written by Natália Gandolphi
natalia.gandolphi@hedgepointglobal.com
natalia.gandolphi@hedgepointglobal.com
Reviewed by Laleska Moda
laleska.moda@hedgepointglobal.com
www.hedgepointglobal.com
Disclaimer
This document has been prepared by hEDGEpoint Global Markets LLC and its affiliates ("HPGM") exclusively for informational and instructional purposes, without the purpose of creating obligations or commitments with third parties, and is not intended to promote an offer, or solicitation of an offer, to sell or buy any securities or investment products. HPGM and its associates expressly disclaim any use of the information contained herein that may result in direct or indirect damage of any kind. If you have any questions that are not resolved in the first instance of contact with the client (client.services@hedgepointglobal.com), please contact our internal ombudsman channel (ouvidoria@hedgepointglobal.com) or 0800-878-8408 (for clients in Brazil only).


Contact us
hedgepointhub.support@hedgepointglobal.com
ouvidoria@hedgepointglobal.com
Funchal Street, 418, 18º floor - Vila Olímpia São Paulo, SP, Brasil
Check our general terms and important notices.
This page has been prepared by Hedgepoint Schweiz AG and its affiliates (“Hedgepoint”) solely for informational and instructional purposes, without the purpose of instituting obligations or commitments to third parties, nor is it intended to promote an offer, or solicitation of an offer of sale or purchase relating to any securities, commodities interests or investment products. Hedgepoint and its associates expressly disclaim any use of the information contained herein that directly or indirectly result in damages or damages of any kind. Information is obtained from sources which we believe to be reliable, but we do not warrant or guarantee the timeliness or accuracy of this information. The trading of commodities interests such as futures, options, and swaps involves substantial risk of loss and may not be suitable for all investors. You should carefully consider wither such trading is suitable for you in light of your financial condition. Past performance is not necessarily indicative of future results. Customers should rely on their own independent judgement and/or advisors before entering in any transaction.Hedgepoint does not provide legal, tax or accounting advice and you are responsible for seeking any such advice separately.Hedgepoint Schweiz AG is organized, incorporated, and existing under the laws of Switzerland, is filiated to ARIF, the Association Romande des Intermédiaires Financiers, which is a FINMA-authorized Self-Regulatory Organization. Hedgepoint Commodities LLC is organized, incorporated, and existing under the laws of the USA, and is authorized and regulated by the Commodity Futures Trading Commission (CFTC) and a member of the National Futures Association (NFA) to act as an Introducing Broker and Commodity Trading Advisor. HedgePoint Global Markets Limited is Regulated by the Dubai Financial Services Authority. The content is directed at Professional Clients and not Retail Clients. Hedgepoint Global Markets PTE. Ltd is organized, incorporated, and existing under the laws of Singapore, exempted from obtaining a financial services license as per the Second Schedule of the Securities and Futures (Licensing and Conduct of Business) Act, by the Monetary Authority of Singapore (MAS). Hedgepoint Global Markets DTVM Ltda. is authorized and regulated in Brazil by the Central Bank of Brazil (BCB) and the Brazilian Securities Commission (CVM). Hedgepoint Serviços Ltda. is organized, incorporated, and existing under the laws of Brazil. Hedgepoint Global Markets S.A. is organized, incorporated, and existing under the laws of Uruguay. In case of questions not resolved by the first instance of customer contact (client.services@Hedgepointglobal.com), please contact internal ombudsman channel (ombudsman@hedgepointglobal.com – global or ouvidoria@hedgepointglobal.com – Brazil only) or call 0800-8788408 (Brazil only).Integrity, ethics, and transparency are values that guide our culture. To further strengthen our practices, Hedgepoint has a whistleblower channel for employees and third-parties by e-mail ethicline@hedgepointglobal.com or forms Ethic Line – Hedgepoint Global Markets.Security note: All contacts with customers and partners are conducted exclusively through our domain @hedgepointglobal.com. Do not accept any information, bills, statements or requests from different domains and pay special attention to any variations in letters or spelling, as they may indicate a fraudulent situation.“HedgePoint” and the “HedgePoint” logo are marks for the exclusive use of HedgePoint and/or its affiliates. Use or reproduction is prohibited, unless expressly authorized by HedgePoint. Furthermore, the use of any other marks in this document has been authorized for identification purposes only. It does not, therefore, imply any rights of HedgePoint in these marks or imply endorsement, association or seal by the owners of these marks with HedgePoint or its affiliates.
We have updated our Terms & Conditions to reflect improvements to our platform, data handling practices, and the overall experience we provide to our clients.
To continue using the Hedgepoint HUB, please review and accept the updated terms.