
Aug 25
/
Pedro Schicchi
Grains, Oilseeds and Livestock Weekly Report - 2023 08 25
Back to main blog page
"August’s WASDE sees peak yield volatility
for US corn and soybeans due to methodological changes by the USDA.
Recent hot and dry weather may affect soybean yields more than corn.
Conditions have improved since August's report. Thus, even with some deterioration in conditions, yields could potentially be spared from significant cuts.
Corn production is expected to remain near 10-year highs, but lower acreage and weather uncertainties are estimated to limit soybean production."
Production estimates for the US
As we approach the last weeks of August, the bulk of the weather market is now behind us. Figure 1 shows the standard deviation for US corn and soybean yields in each month’s WASDE (versus the previous one). We see the peak for both in August, because of the change in methodology – starting to use data from the ground as input, as opposed to the statistical model used before.
After this point, standard deviations drop but don’t disappear, and, importantly, corn’s std. dev. drop faster than beans’. That is because, by the time August’s report is issued, the most sensitive stages of corn development are already passed, while soybean’s usually take place in August.
Speaking of weather, hot and dry weather took over in the 2H of this month, as opposed to the more benign pattern seen before. Due to the aforementioned reasons, this factor is thought to be more impactful to beans than to corn.
Image 1: Standard Deviation of US Yield estimates in each WASDE Report (%)
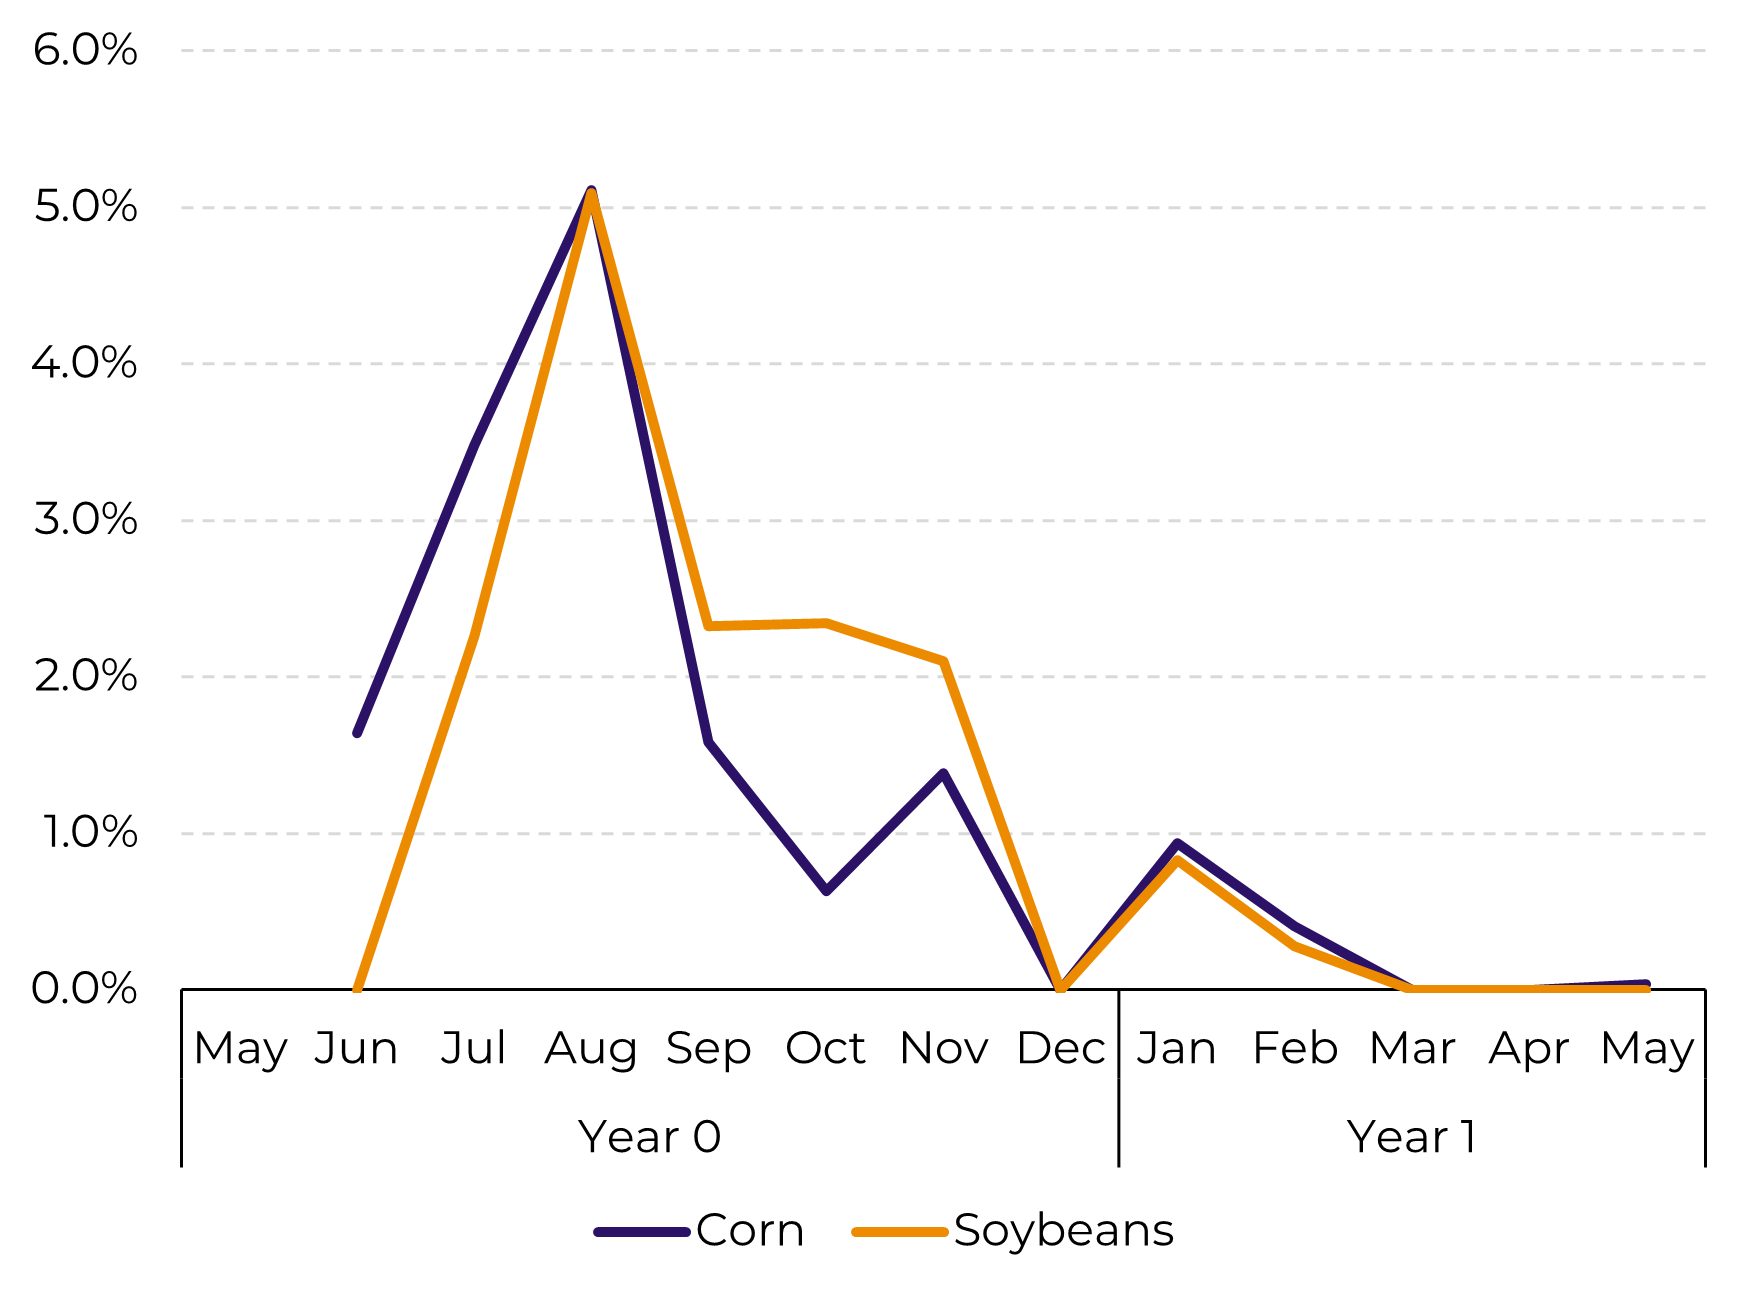
Source: USDA, Hedgepoint
Image 2: Temperature Anomaly – Aug 22 to Sep 4 (°C from normal)
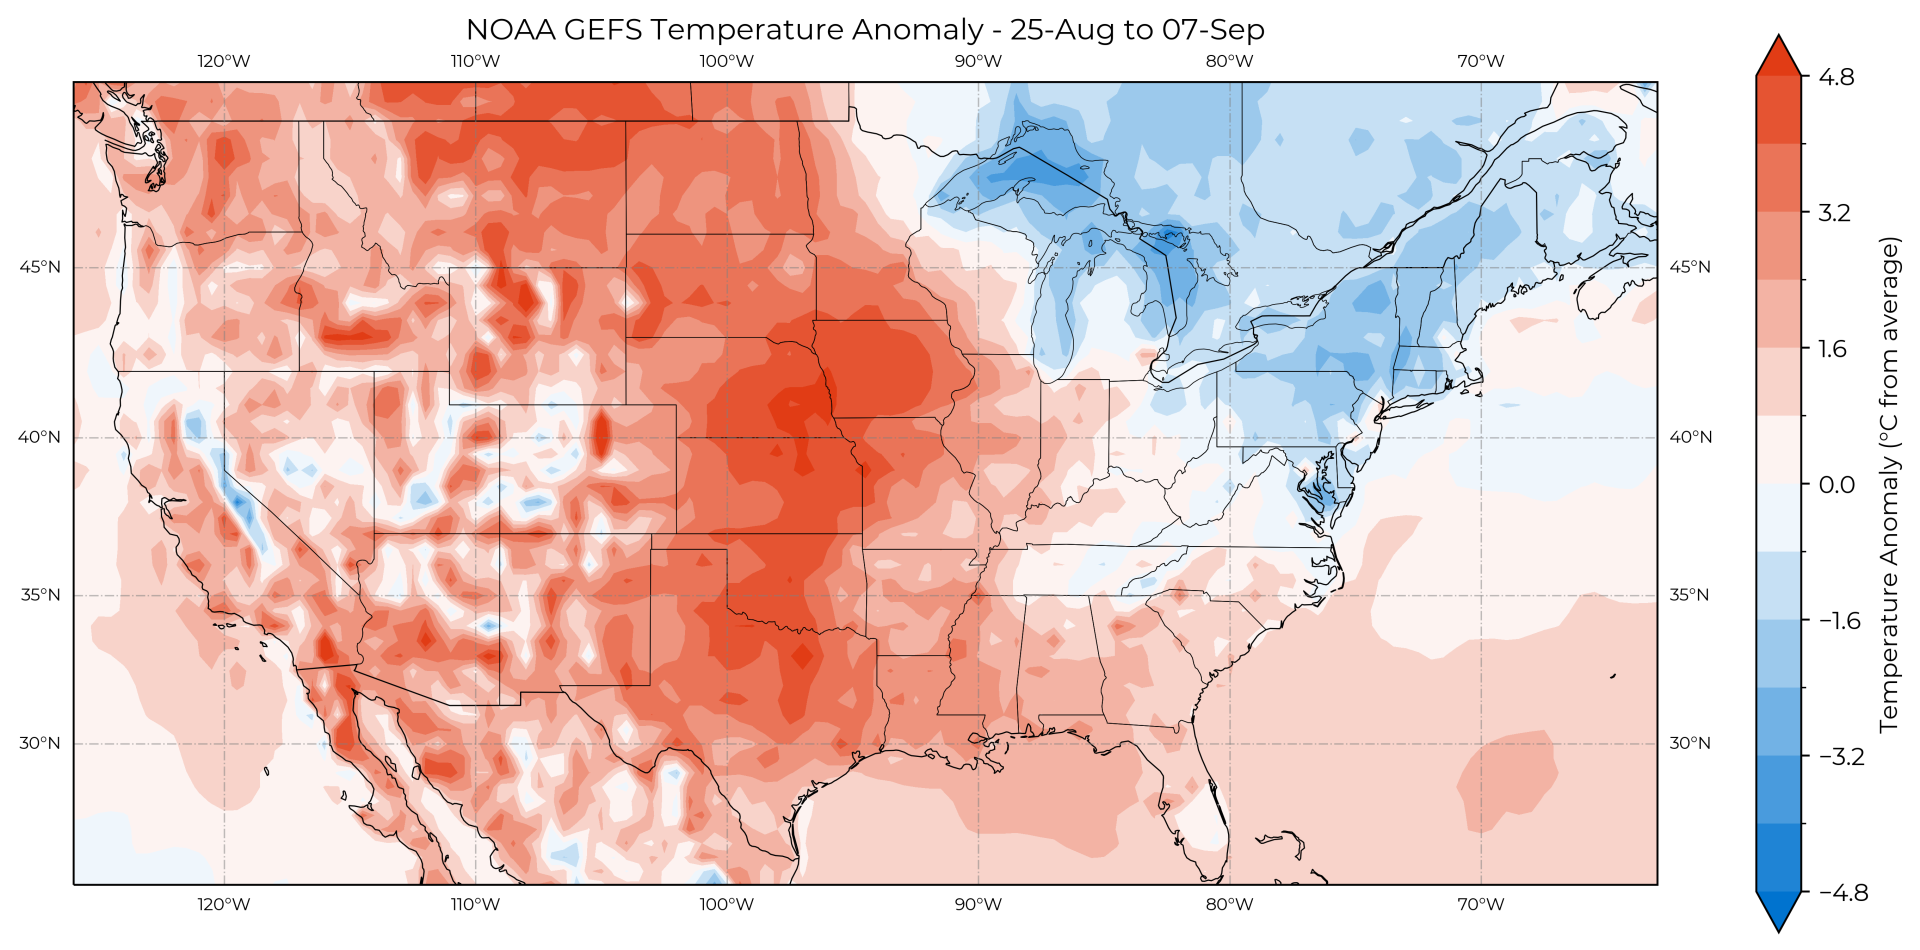
Source: NOAA, Hedgepoint
Conditions and Yields
Well, since most part of the weather market months have passed, let’s talk about the balance it left to us so far. Do not be mistaken, this will still be a below-potential crop in the US in terms of yields, conditions say so. However, it will not be as catastrophic as it could have turned out to be in case June’s weather persisted throughout the summer.
We established the weather took a turn for the worse in the latter half of August, and that could have an impact on yields, especially of soybeans. In turn, that is most certainly going to lead to a cut in the next WASDE, right? Well, not necessarily.
Looking at the evolution of the condition index, we see that soybeans saw an improvement since the weeks when farmers were being surveyed for the August report.
Looking at the evolution of the condition index, we see that soybeans saw an improvement since the weeks when farmers were being surveyed for the August report.
These poor climatic conditions are likely to drag the index down. However, it may be the case that, by the time surveys are taking place for the September report, conditions are back to where they were when the last report was in the making.
If we take conditions to be a good predictor of yields, which is an assumption in and of itself (though generally a good one), it will mean that farmer’s prospects of yields may not have as much “reason” to be trimmed down as it seems at first.
Image 3: US Corn – Condition Index
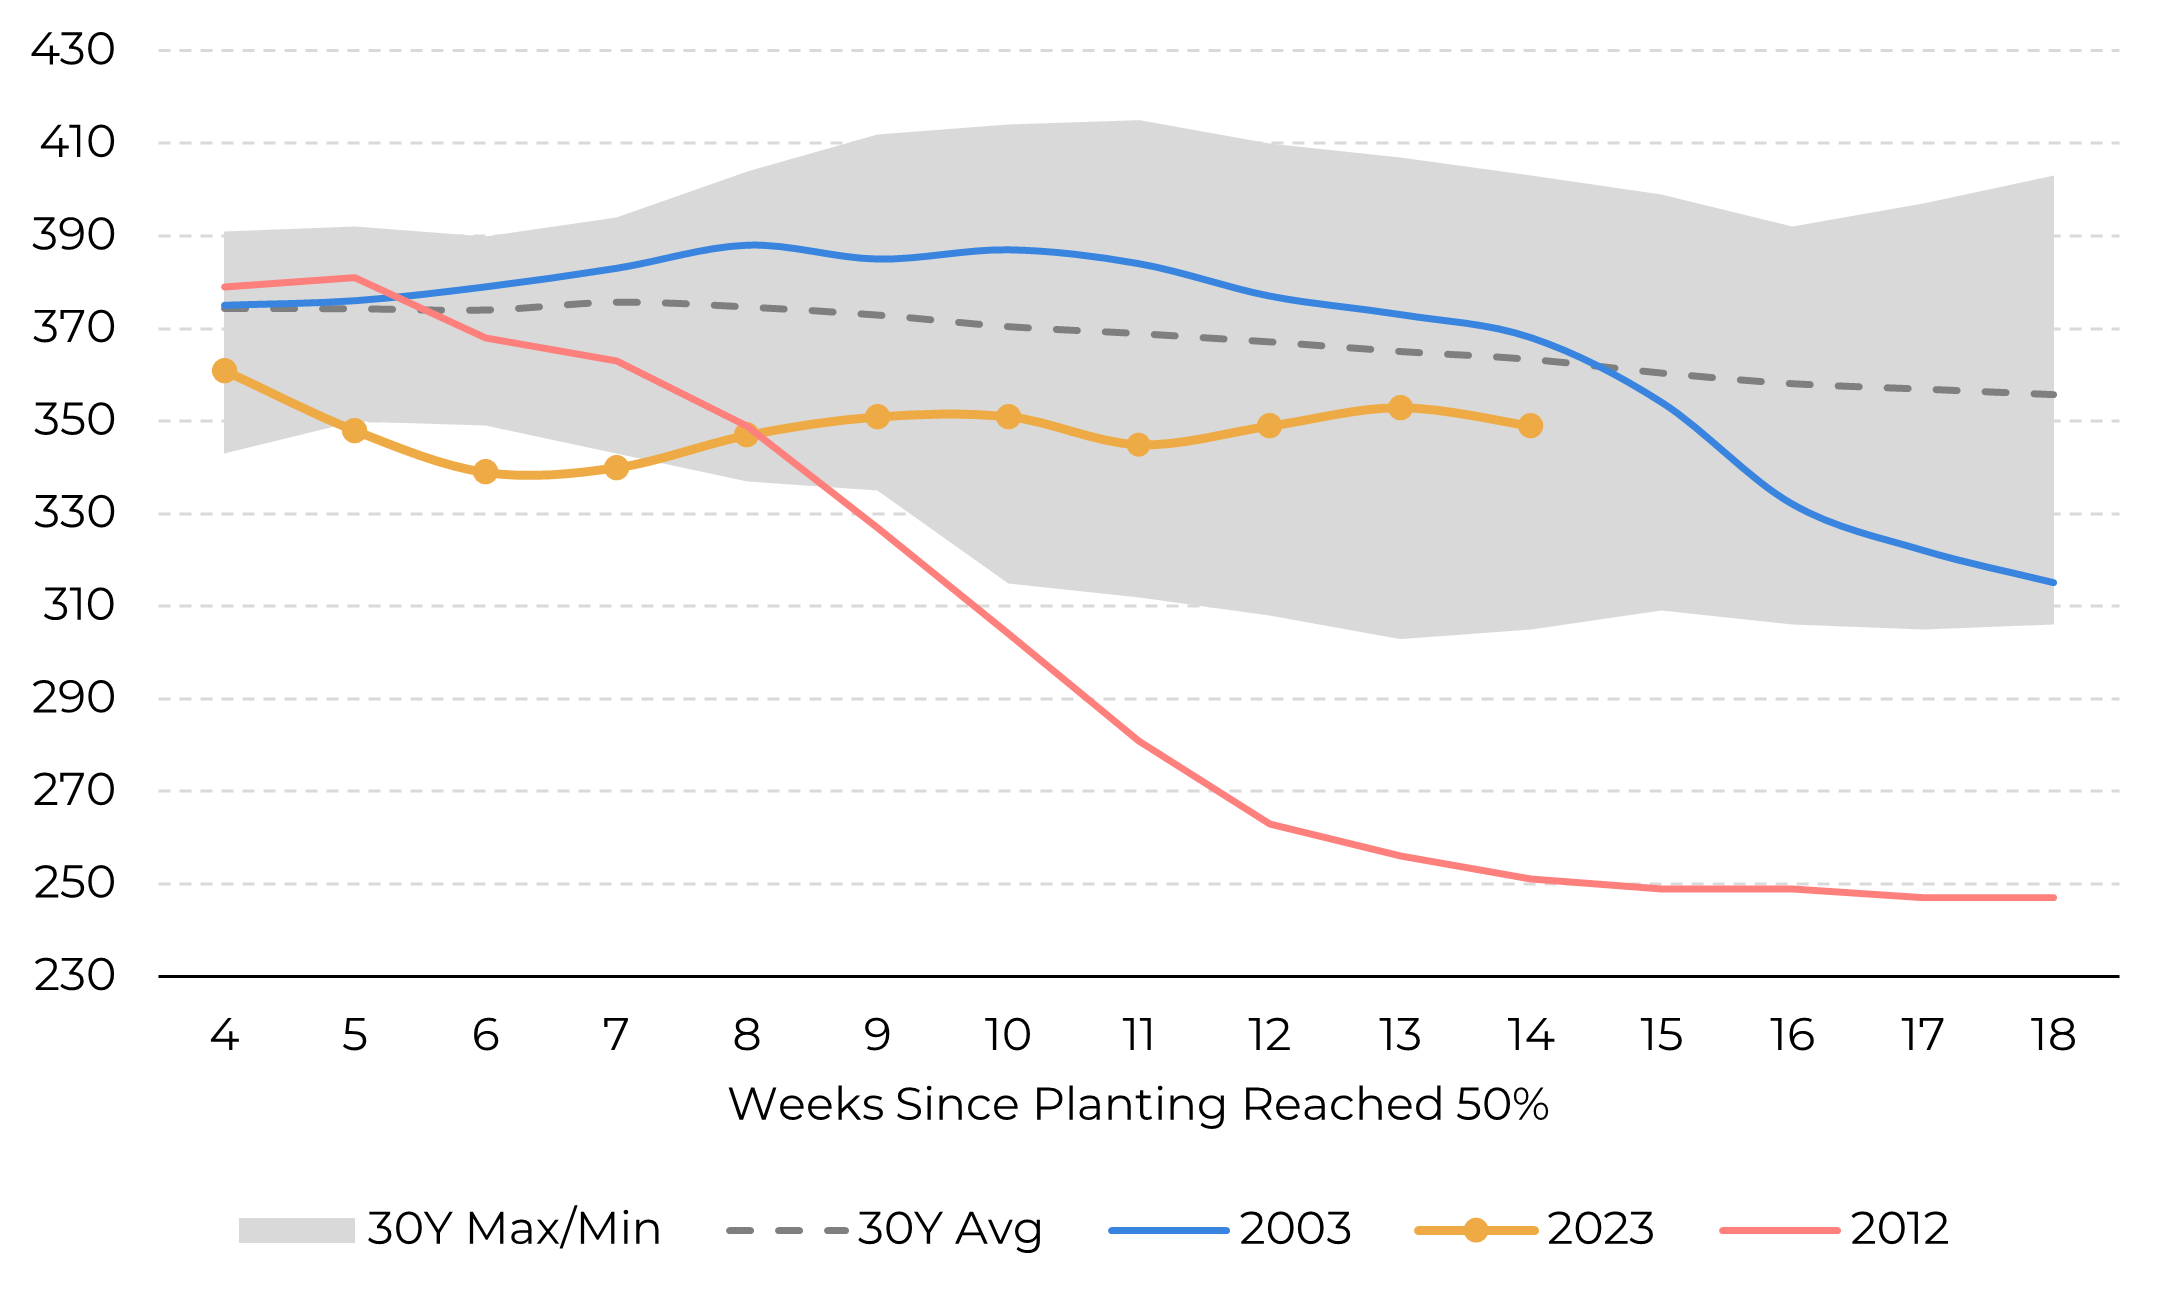
Source: USDA, Hedgepoint
Image 4: US Soybean – Condition Index
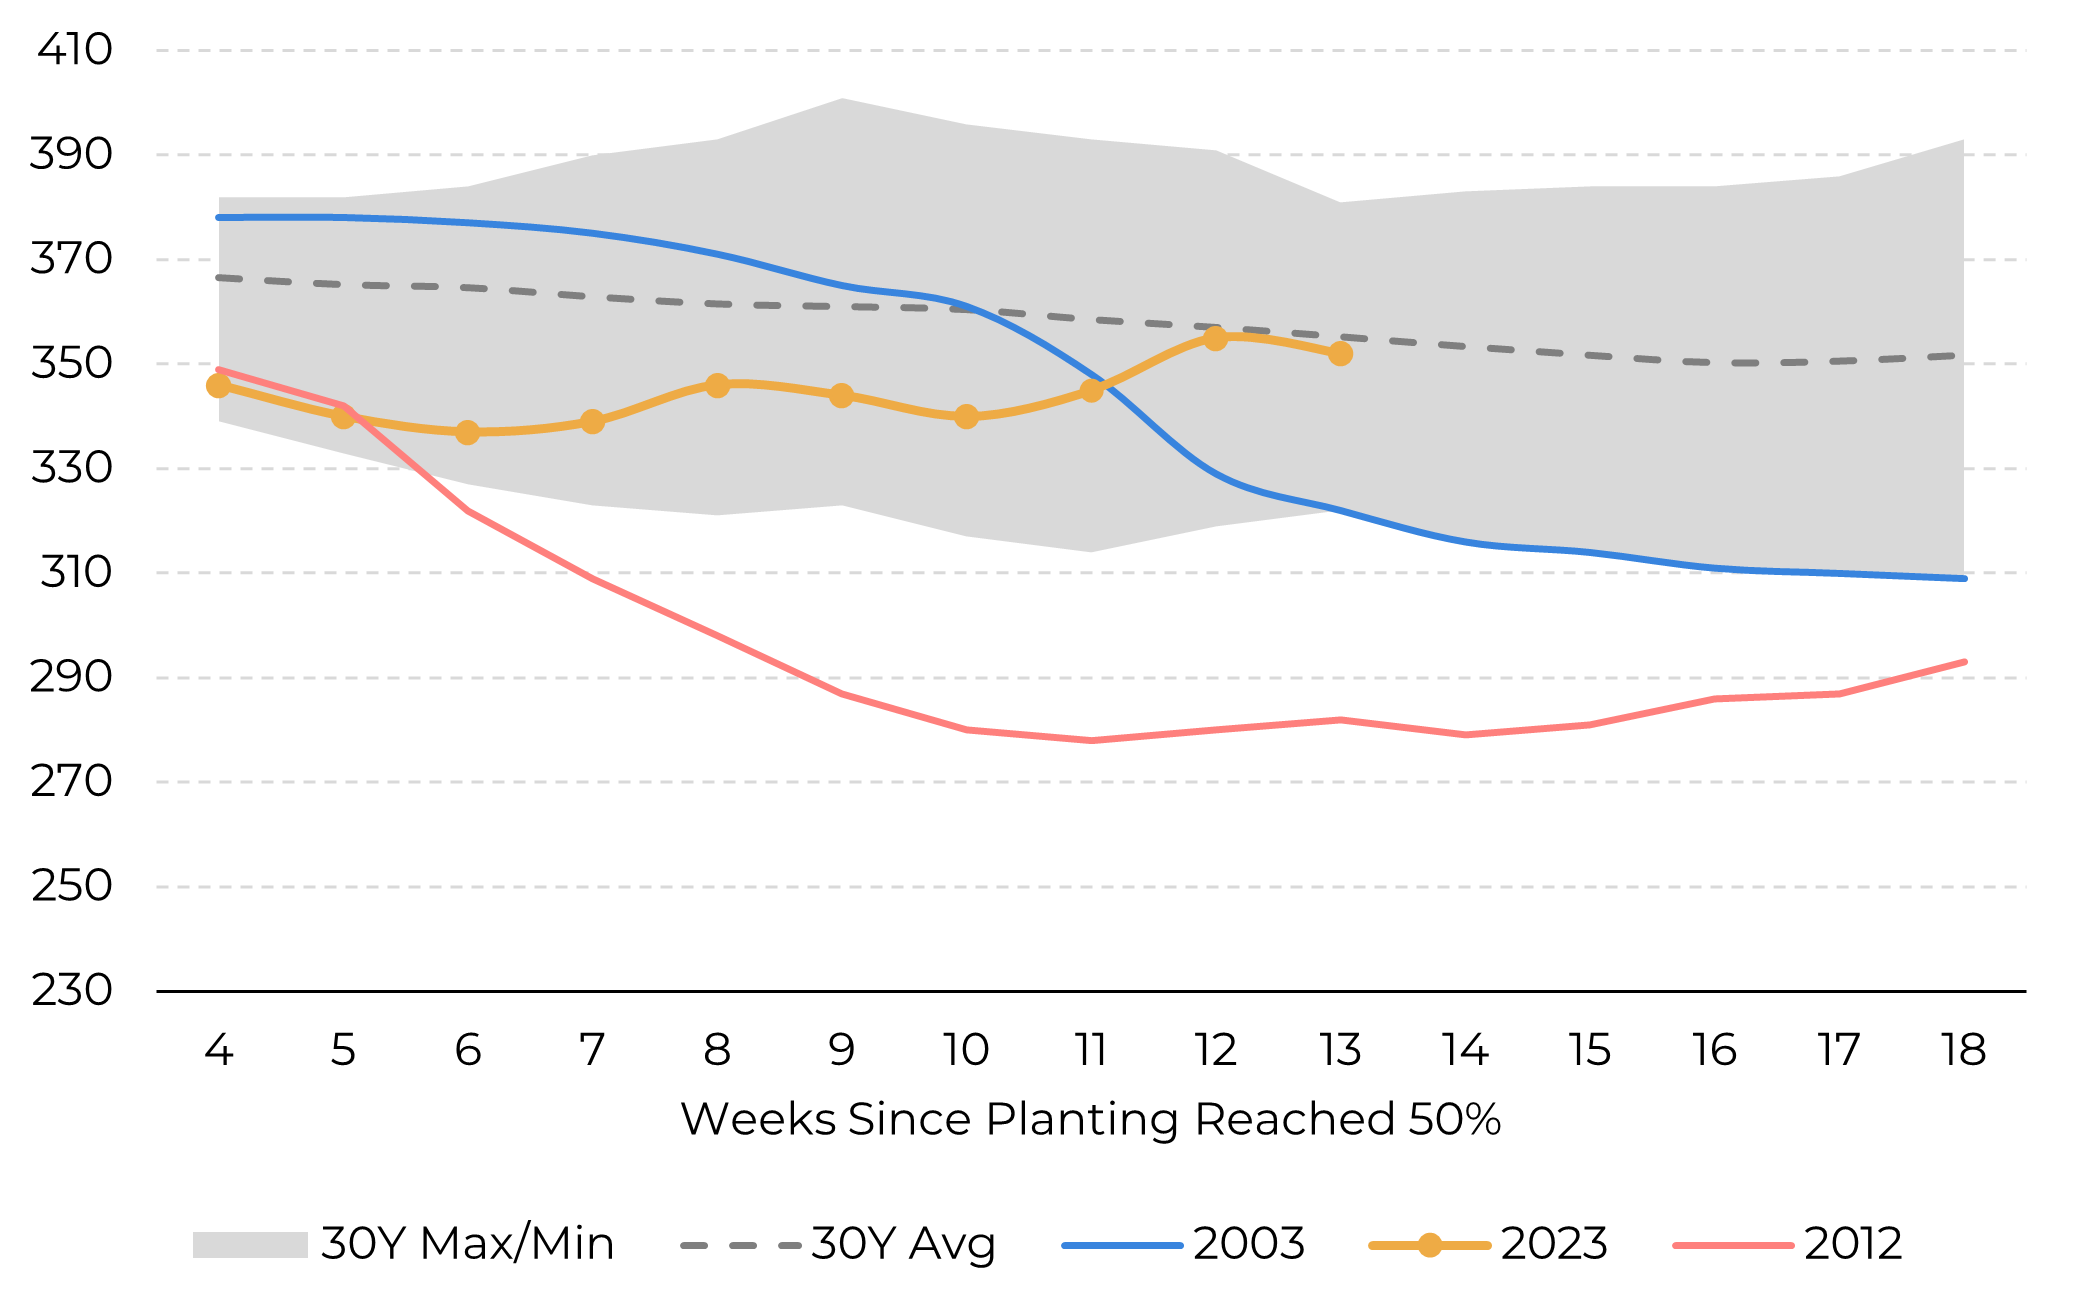
Source: USDA, Hedgepoint
Production Estimates
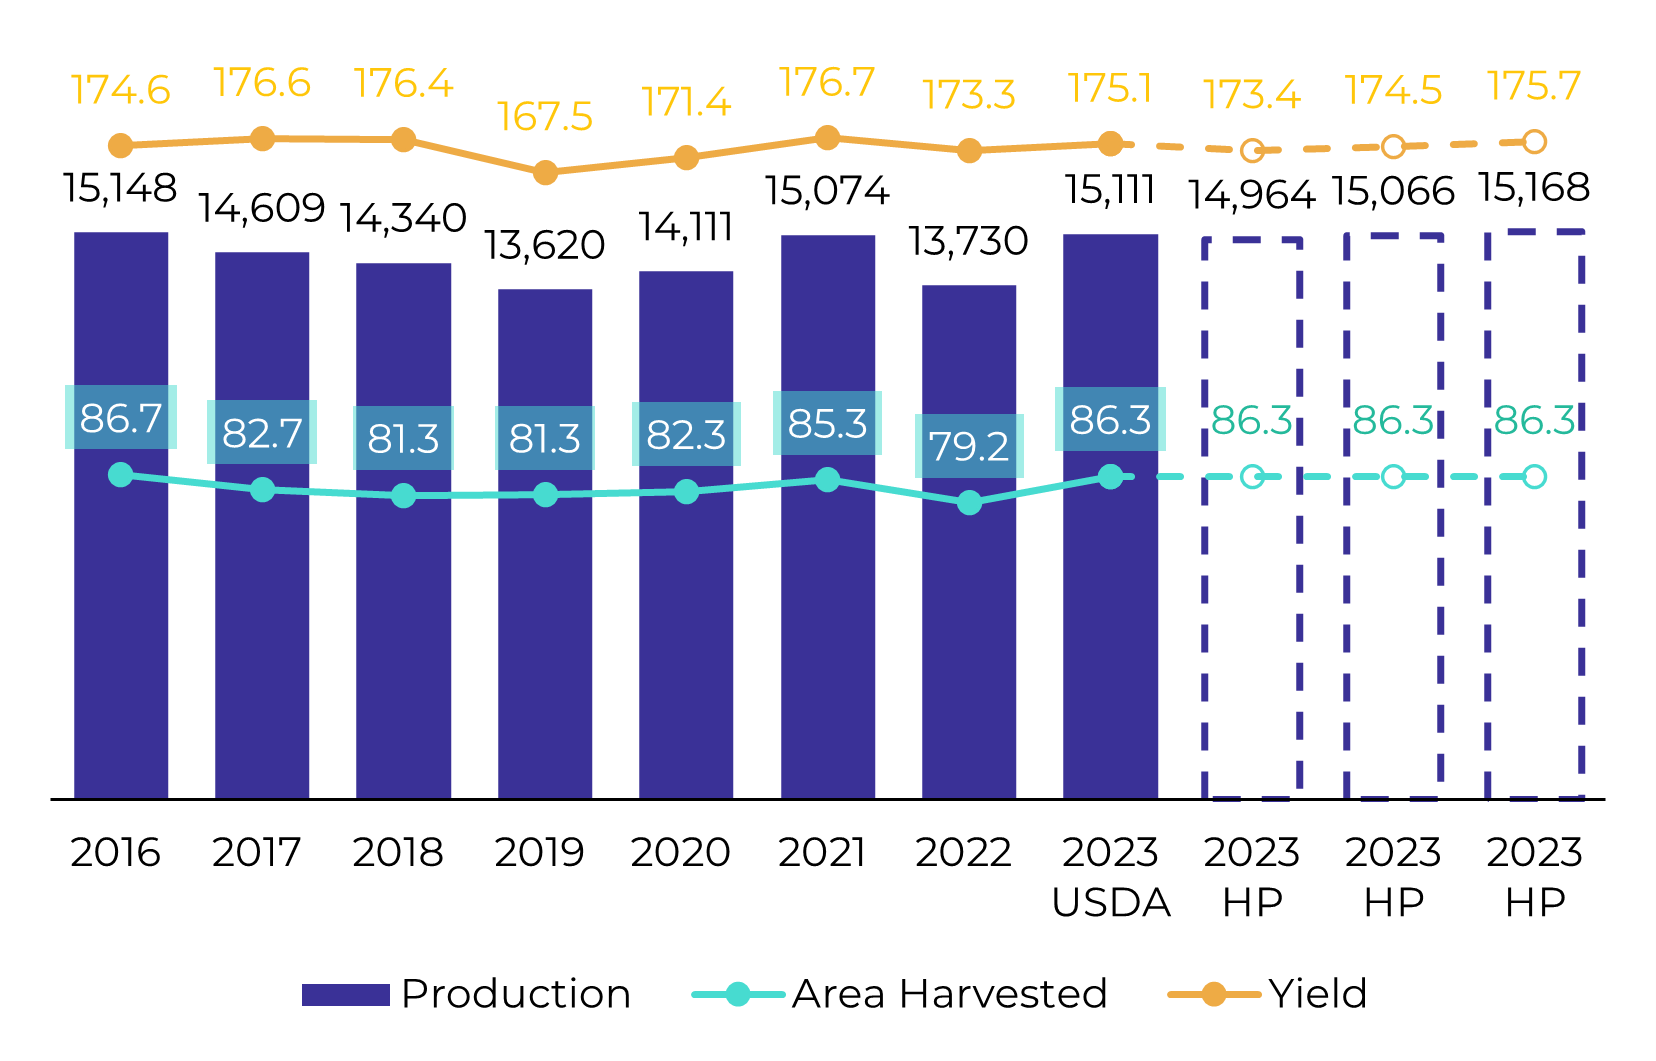
The US corn crop is expected to be below potential, but yields may not be as affected by this recent wave of damaging weather. Besides, “below the potential” does not equal a bad crop.
The trims to yield were made in relation to the 180+ bu/ac trend. But still, 174-175 is an average yield, historically speaking. Additionally, one must recall that the area planted with corn this year was huge. Thus, even with the lower numbers in our yield range (Figure 5), production in the US should still be very close to the 10-year highs. Our current estimate is 15.062M bu, but the best/worst case scenario could be between 14.96-15.16B bu.
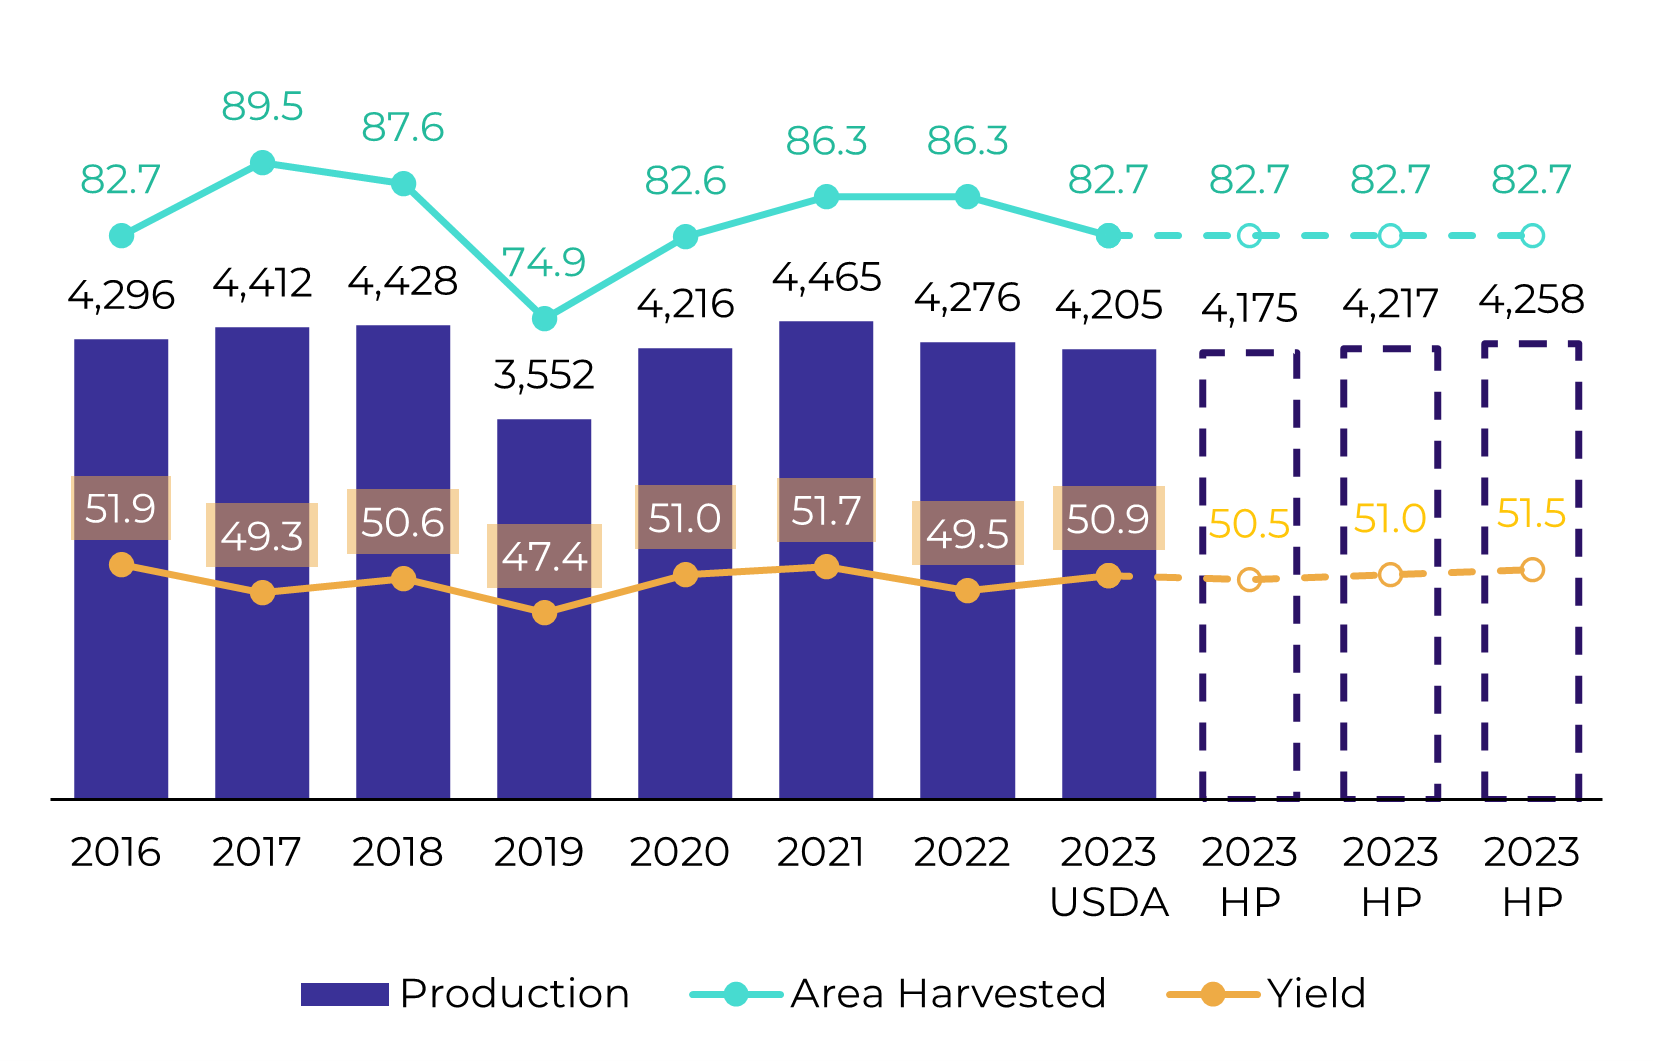
On soybeans, the picture is a bit different. For starters, the scenario with acreage is the exact opposite. The area is on the lower side this year, which limits production even with good yields (Figure 6).
The trims to yield were made in relation to the 180+ bu/ac trend. But still, 174-175 is an average yield, historically speaking. Additionally, one must recall that the area planted with corn this year was huge. Thus, even with the lower numbers in our yield range (Figure 5), production in the US should still be very close to the 10-year highs. Our current estimate is 15.062M bu, but the best/worst case scenario could be between 14.96-15.16B bu.
On soybeans, the picture is a bit different. For starters, the scenario with acreage is the exact opposite. The area is on the lower side this year, which limits production even with good yields (Figure 6).
Given the improvement in conditions seen in the first half of August, we estimate the yield to be slightly higher than that of the last WASDE. Still, that’s pending the impact that the hot and dry weather will have on crops. Our current estimate is 4220M bu.
Image 5: US Corn – Area, Yield and Production (M ac, bu/ac, M bu)
Source: USDA, Hedgepoint
Image 6: US Soybean – Area, Yield and Production (M ac, bu/ac, M bu)
Source: USDA, Hedgepoint
In Summary
Yields are still being debated, and the traditional ProFarmer crop tour is providing some insight into that - as well as possibly some volatility to prices. However, for both soybeans and corn, all our scenarios point to the same message: We should expect a good output of corn, but a more modest/small one for beans.
Weekly Report — Grains
Written by Pedro Schicchi
pedro.schicchi@hedgepointglobal.com
pedro.schicchi@hedgepointglobal.com
Reviewed by Alef Dias
alef.dias@hedgepointglobal.com
alef.dias@hedgepointglobal.com
www.hedgepointglobal.com
Disclaimer
This document has been prepared by hEDGEpoint Global Markets LLC and its affiliates ("HPGM") exclusively for informational and instructional purposes, without the purpose of creating obligations or commitments with third parties, and is not intended to promote an offer, or solicitation of an offer, to sell or buy any securities or investment products. HPGM and its associates expressly disclaim any use of the information contained herein that may result in direct or indirect damage of any kind. If you have any questions that are not resolved in the first instance of contact with the client (client.services@hedgepointglobal.com), please contact our internal ombudsman channel (ouvidoria@hedgepointglobal.com) or 0800-878-8408 (for clients in Brazil only).


Contact us
hedgepointhub.support@hedgepointglobal.com
ouvidoria@hedgepointglobal.com
Funchal Street, 418, 18º floor - Vila Olímpia São Paulo, SP, Brasil
Check our general terms and important notices.
This page has been prepared by Hedgepoint Schweiz AG and its affiliates (“Hedgepoint”) solely for informational and instructional purposes, without the purpose of instituting obligations or commitments to third parties, nor is it intended to promote an offer, or solicitation of an offer of sale or purchase relating to any securities, commodities interests or investment products. Hedgepoint and its associates expressly disclaim any use of the information contained herein that directly or indirectly result in damages or damages of any kind. Information is obtained from sources which we believe to be reliable, but we do not warrant or guarantee the timeliness or accuracy of this information. The trading of commodities interests such as futures, options, and swaps involves substantial risk of loss and may not be suitable for all investors. You should carefully consider wither such trading is suitable for you in light of your financial condition. Past performance is not necessarily indicative of future results. Customers should rely on their own independent judgement and/or advisors before entering in any transaction.Hedgepoint does not provide legal, tax or accounting advice and you are responsible for seeking any such advice separately.Hedgepoint Schweiz AG is organized, incorporated, and existing under the laws of Switzerland, is filiated to ARIF, the Association Romande des Intermédiaires Financiers, which is a FINMA-authorized Self-Regulatory Organization. Hedgepoint Commodities LLC is organized, incorporated, and existing under the laws of the USA, and is authorized and regulated by the Commodity Futures Trading Commission (CFTC) and a member of the National Futures Association (NFA) to act as an Introducing Broker and Commodity Trading Advisor. HedgePoint Global Markets Limited is Regulated by the Dubai Financial Services Authority. The content is directed at Professional Clients and not Retail Clients. Hedgepoint Global Markets PTE. Ltd is organized, incorporated, and existing under the laws of Singapore, exempted from obtaining a financial services license as per the Second Schedule of the Securities and Futures (Licensing and Conduct of Business) Act, by the Monetary Authority of Singapore (MAS). Hedgepoint Global Markets DTVM Ltda. is authorized and regulated in Brazil by the Central Bank of Brazil (BCB) and the Brazilian Securities Commission (CVM). Hedgepoint Serviços Ltda. is organized, incorporated, and existing under the laws of Brazil. Hedgepoint Global Markets S.A. is organized, incorporated, and existing under the laws of Uruguay. In case of questions not resolved by the first instance of customer contact (client.services@Hedgepointglobal.com), please contact internal ombudsman channel (ombudsman@hedgepointglobal.com – global or ouvidoria@hedgepointglobal.com – Brazil only) or call 0800-8788408 (Brazil only).Integrity, ethics, and transparency are values that guide our culture. To further strengthen our practices, Hedgepoint has a whistleblower channel for employees and third-parties by e-mail ethicline@hedgepointglobal.com or forms Ethic Line – Hedgepoint Global Markets.Security note: All contacts with customers and partners are conducted exclusively through our domain @hedgepointglobal.com. Do not accept any information, bills, statements or requests from different domains and pay special attention to any variations in letters or spelling, as they may indicate a fraudulent situation.“HedgePoint” and the “HedgePoint” logo are marks for the exclusive use of HedgePoint and/or its affiliates. Use or reproduction is prohibited, unless expressly authorized by HedgePoint. Furthermore, the use of any other marks in this document has been authorized for identification purposes only. It does not, therefore, imply any rights of HedgePoint in these marks or imply endorsement, association or seal by the owners of these marks with HedgePoint or its affiliates.
We have updated our Terms & Conditions to reflect improvements to our platform, data handling practices, and the overall experience we provide to our clients.
To continue using the Hedgepoint HUB, please review and accept the updated terms.