
Jul 2
/
Alef Dias
How do the American S&Ds look with the new areas?
Back to main blog page
How do the American S&Ds look with the new areas?
- In a "not so surprising" move given recent history, USDA's acreage report showed that US farmers will increase their corn acreage compared to March estimates.
- After a bullish Prospective Plantings report in March, the June acreage report leaned more towards the bearish side, as the total area - soybeans, corn, wheat and cotton combined - grew by 1.8M ac, almost 1M ac above the average market estimate.
- The increase in area reduces the support for corn prices that the American weather market can bring. With the new area estimate, a marginal increase in yields compared to last year's crop could still lead to looser final stocks.
- Looking at the supply and demand balance of US' soybeans, the reduction in planted area brings little change to the scenario of more comfortable ending stocks in the 24/25 season, given that the planted area is still larger than last season and crop conditions are still better than last year and the average of the last 5 years.
Introduction
In a "not so surprising" move given recent history, the USDA's acreage report showed that US farmers will increase their corn acreage compared to March estimates. Although the market was already expecting this change, the increase in corn planted area (+1.5M ac) compared to the March estimates was much higher than the average market estimate (+1.2M ac).
The increase came at the expense of a reduction in the soybean area. The area planted to winter wheat was also reduced, leading to a lower total area of wheat. After a bullish Prospective Planting report in March, the June Acreage report leaned more to the bearish side, as the total area - soybeans, corn, wheat and cotton combined - grew by 1.8M ac, almost 1M ac above the average market estimate.
As a result, all grains had a negative session after the report, with a greater weight on corn contracts. It was the first time that December corn futures had a negative session after the report with speculative funds maintaining a net short position.
US Acreage Summary (M ac)
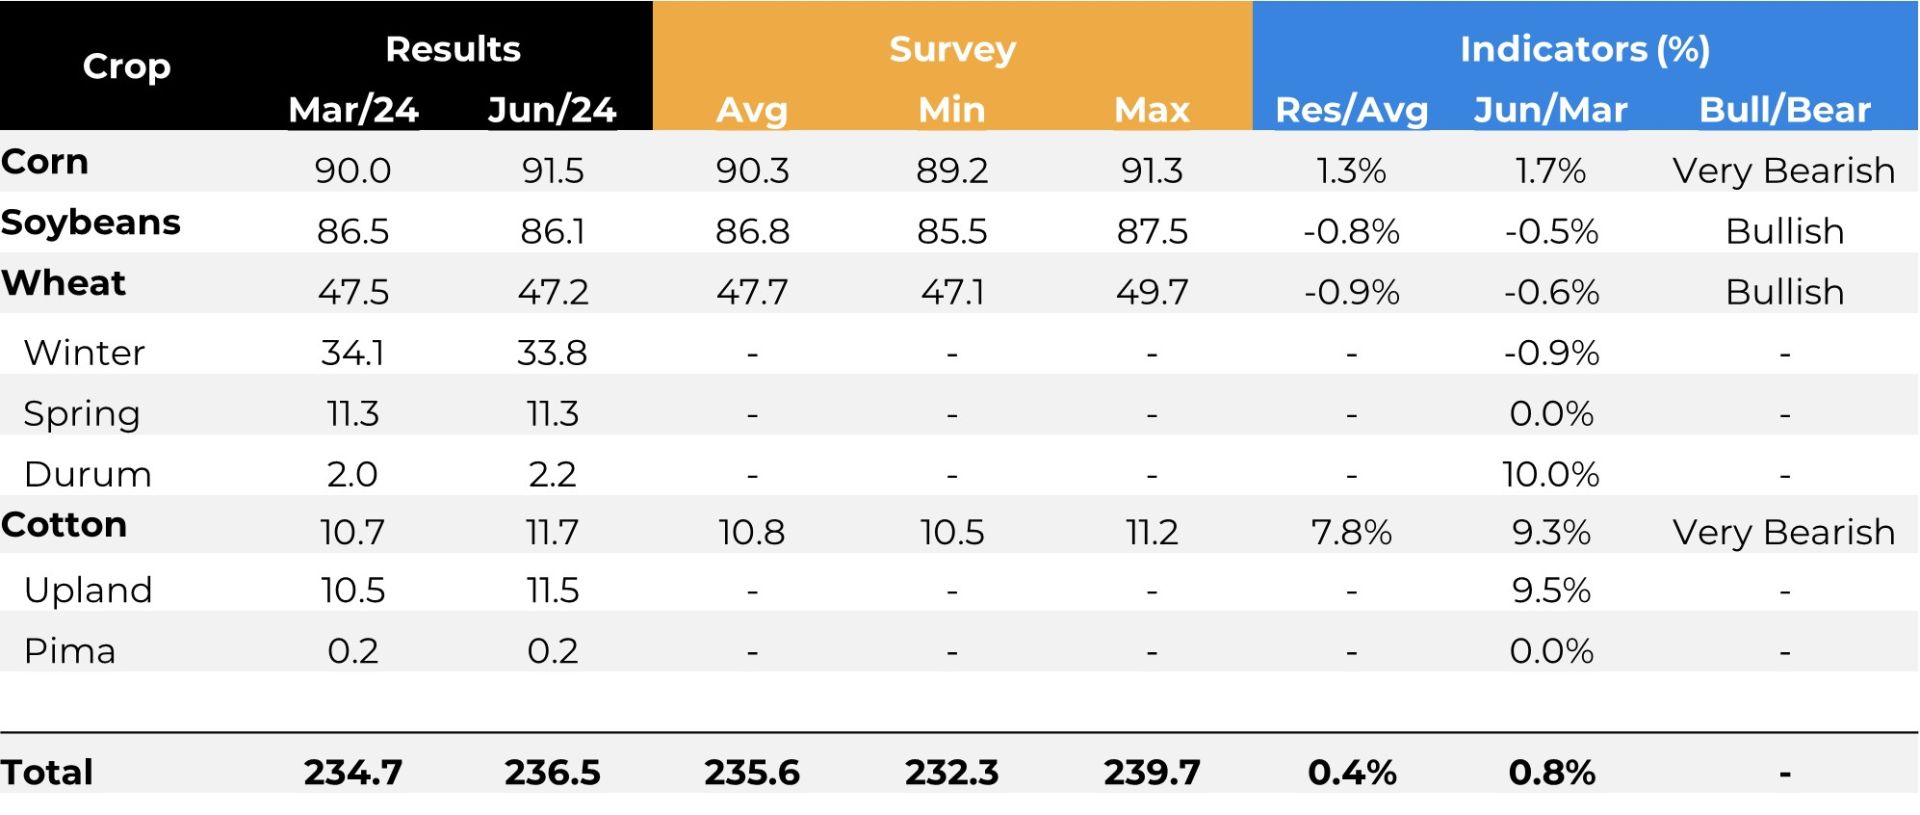
Source: USDA
Historical planted area in the US (M ac)
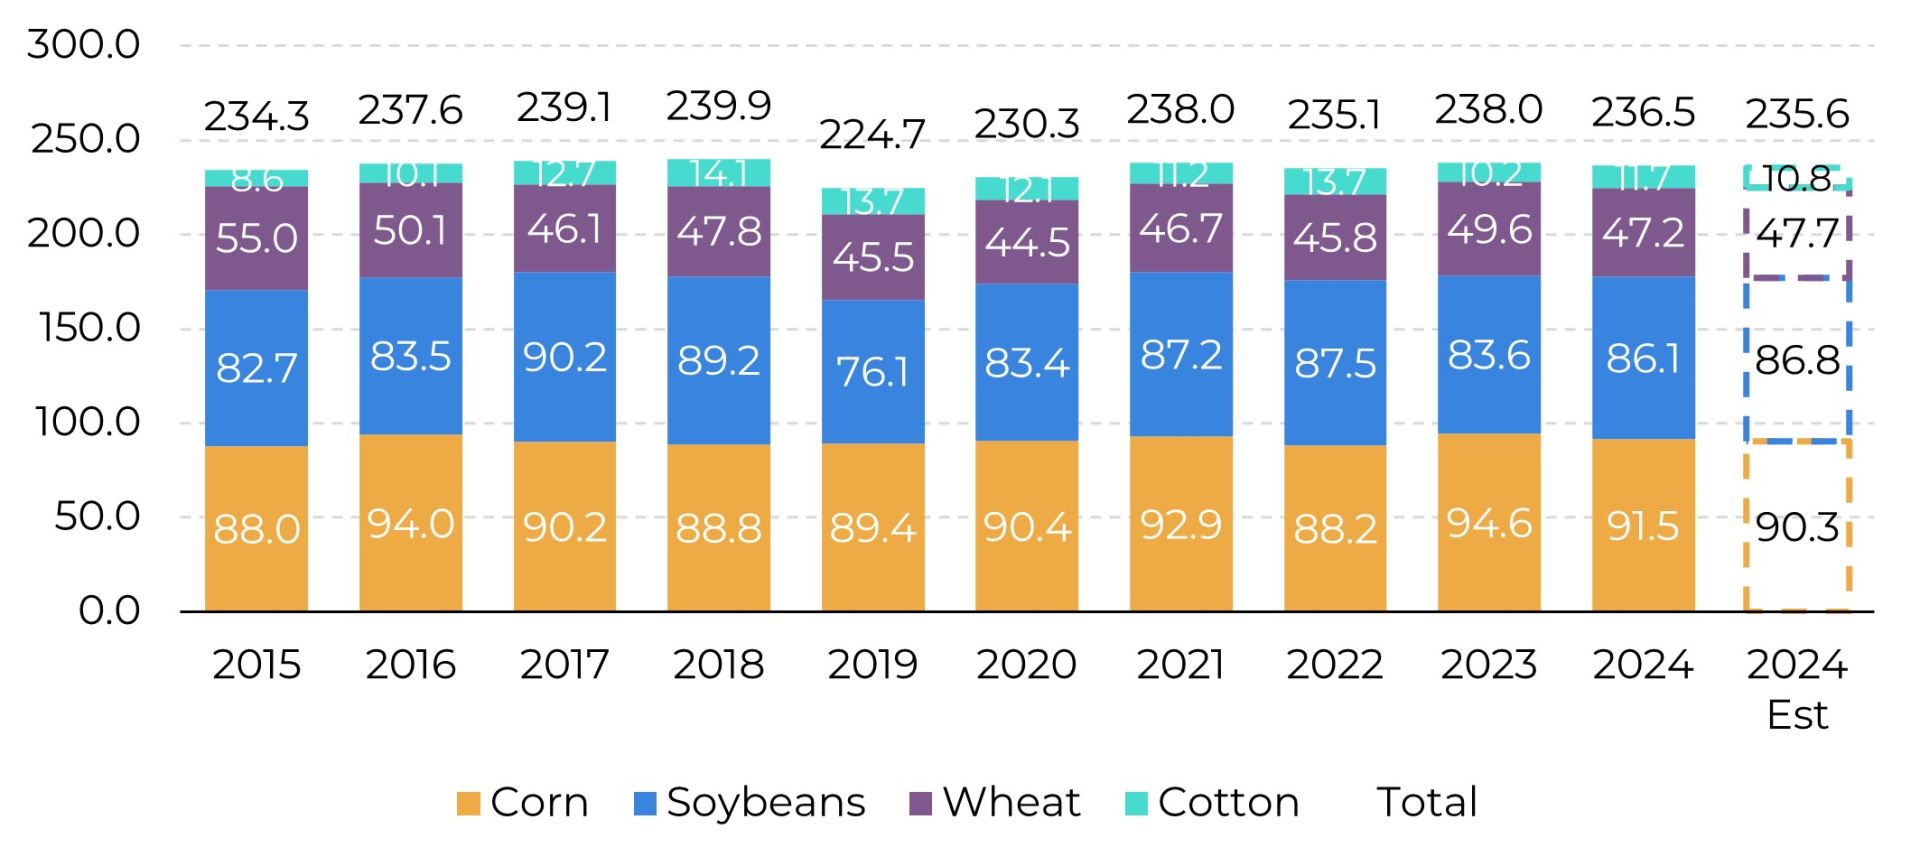
Source: USDA
An "expected" surprise in the corn
The USDA estimated corn plantings in the US in 2024 at 91.5M ac, above the range of market estimates and 1.6% higher than in the March report. This is the fourth time in six years that the USDA's corn area in June has been outside the range of estimates.
If the expectation was for more comfortable stocks for the 24/25 harvest due to the high initial stocks and the estimate of a higher yield, the larger planted area has only increased this expectation.
The increase in area reduces the price support that the American weather market can bring. With the new area estimate, a marginal increase in yields compared to last season (178 bu/ac vs 181 currently expected by the USDA, which would be a record yield) could still lead to looser final stocks. Despite the recent deterioration in crop conditions, the percentage of "good and excellent" conditions remains above the average of the last 5 years and well above last year's levels (67% vs 51% on 23/24).
The increase in area reduces the price support that the American weather market can bring. With the new area estimate, a marginal increase in yields compared to last season (178 bu/ac vs 181 currently expected by the USDA, which would be a record yield) could still lead to looser final stocks. Despite the recent deterioration in crop conditions, the percentage of "good and excellent" conditions remains above the average of the last 5 years and well above last year's levels (67% vs 51% on 23/24).
This even more comfortable scenario led to a historic downward movement in Chicago. Since 2006, the December contract had never closed lower on the day of the area report in the four years in which funds were net short, and two of those years showed higher than expected corn stocks and area.
Supply and Demand Balance - Corn US
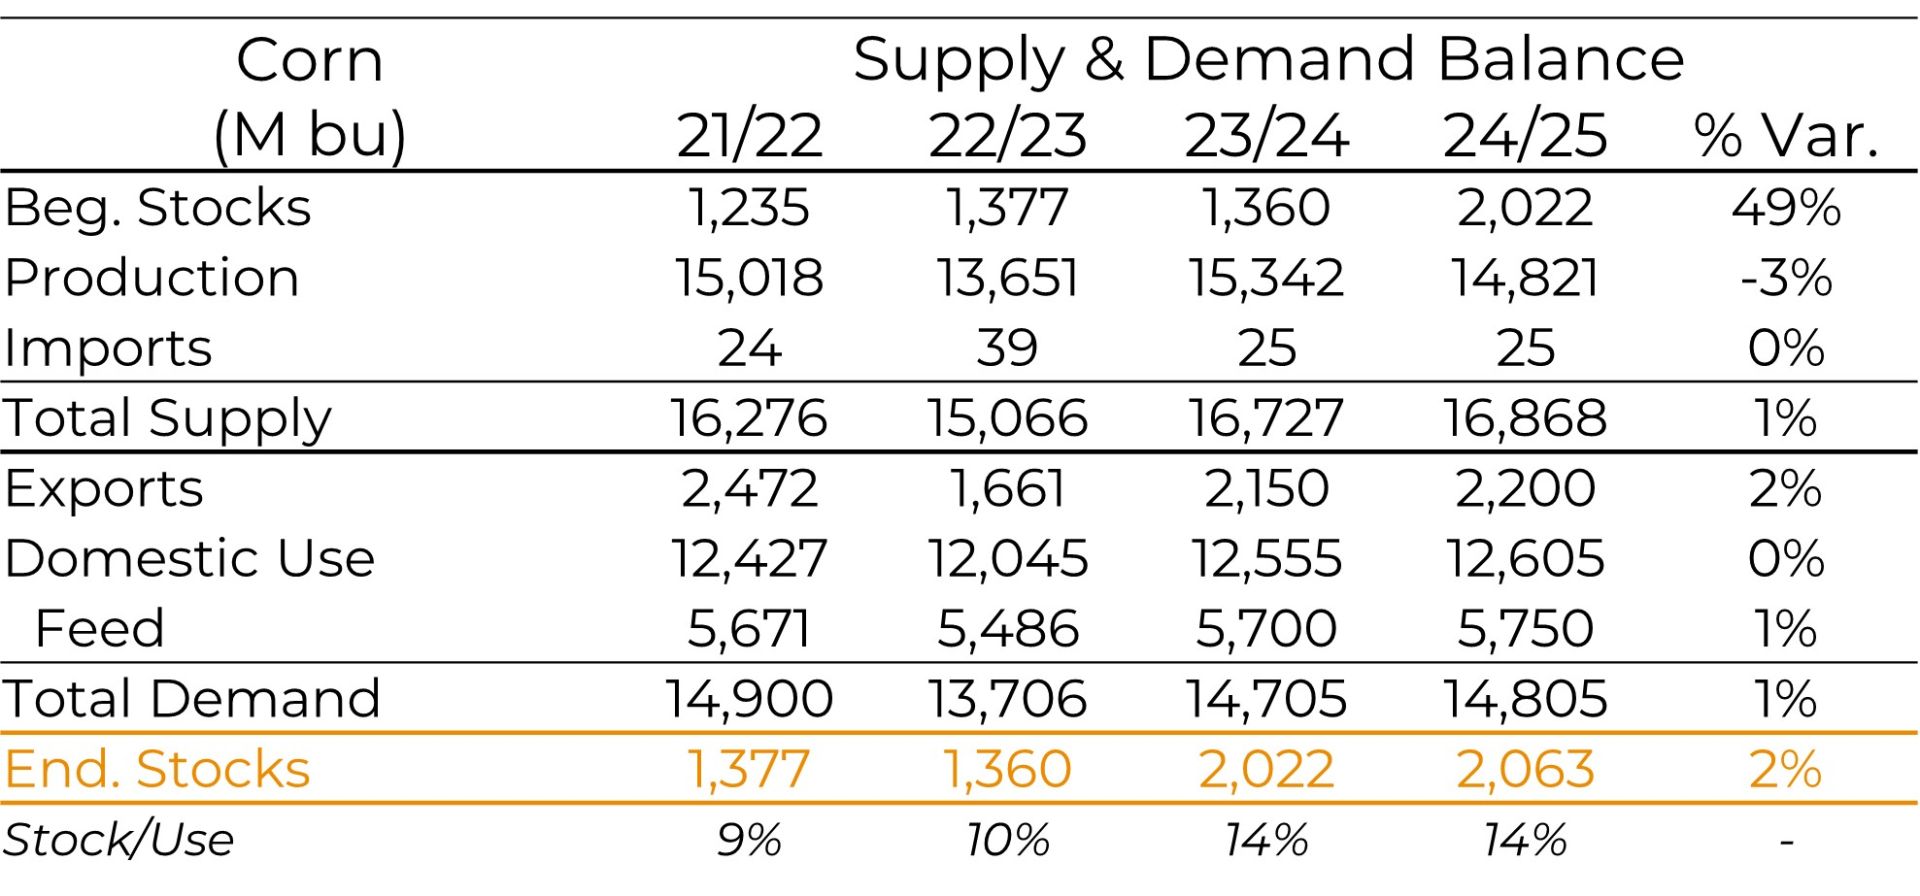
Source: USDA *Considering the new estimate of area and yield of 178 bu/ac
Increase in corn to the detriment of soybeans
Soybean plantings in the US came in below the market's average estimate for the tenth consecutive year, although the 86.1M ac was within the range of expectations. November soybeans rose briefly on Friday's data, but hit a new yearly low of $11.00 per bushel just before the close. There have also been four other years, since 2006, in which funds were net short in soybeans at the end of June, with only one drop in previous years - in 2018, during the trade war.
Looking at the supply & demand balance for American soybeans, the reduction in planted area brings little change to the scenario of more comfortable ending stocks in the 24/25 season, given that the planted area is still larger than last season and crop conditions are still better than last year and the average of the last 5 years.
Supply and Demand Balance - Soybeans US
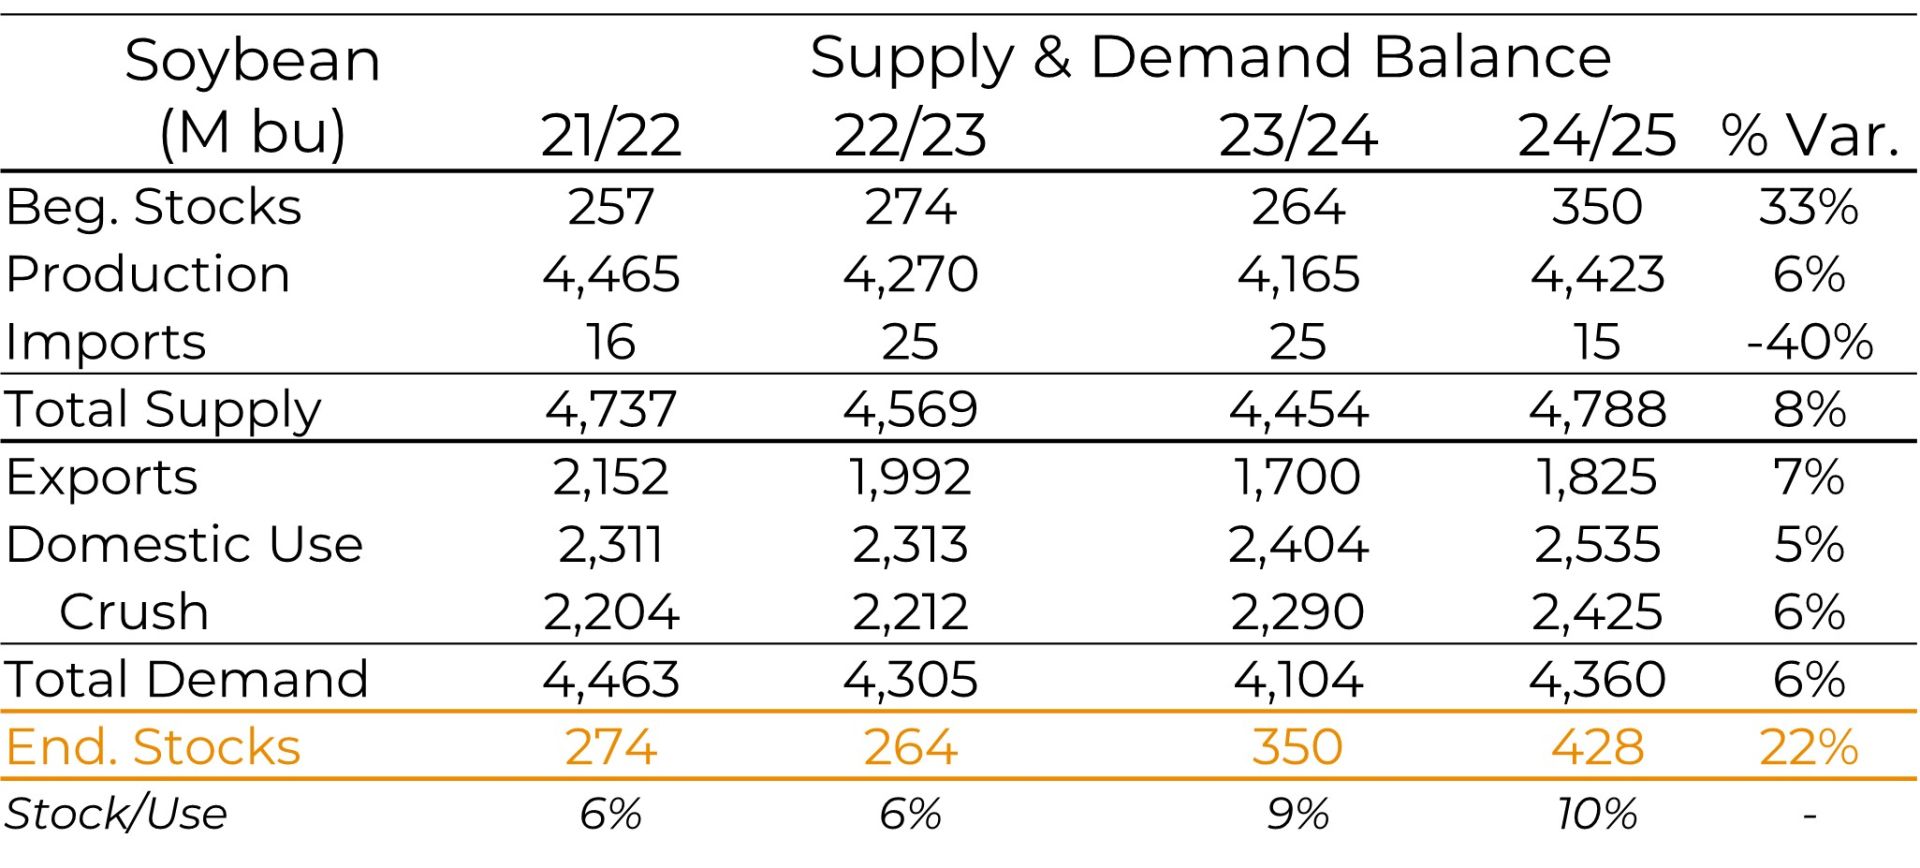
Source: USDA
In summary
In a "not so surprising" move, the USDA's acreage report showed that US farmers will increase their corn acreage compared to the March estimate. After a bullish Prospective Plantings report in March, the June acreage report leaned more to the bearish side, as the total acreage grew above the market estimate. As a result, prices continued on a downward trend, even with the funds in record net short positions - a move not so common in recent years.
On the corn side, the larger-than-expected area reduces the price support that the American weather market can bring. With the new area estimate, a marginal increase in yields compared to last year's crop could still lead to looser final stocks.
Looking at the US soybean supply & demand balance, the reduction in planted area brings little change to the scenario of more comfortable final stocks in the 24/25 season
CBOT Corn - Net position of Speculative Funds (lots)
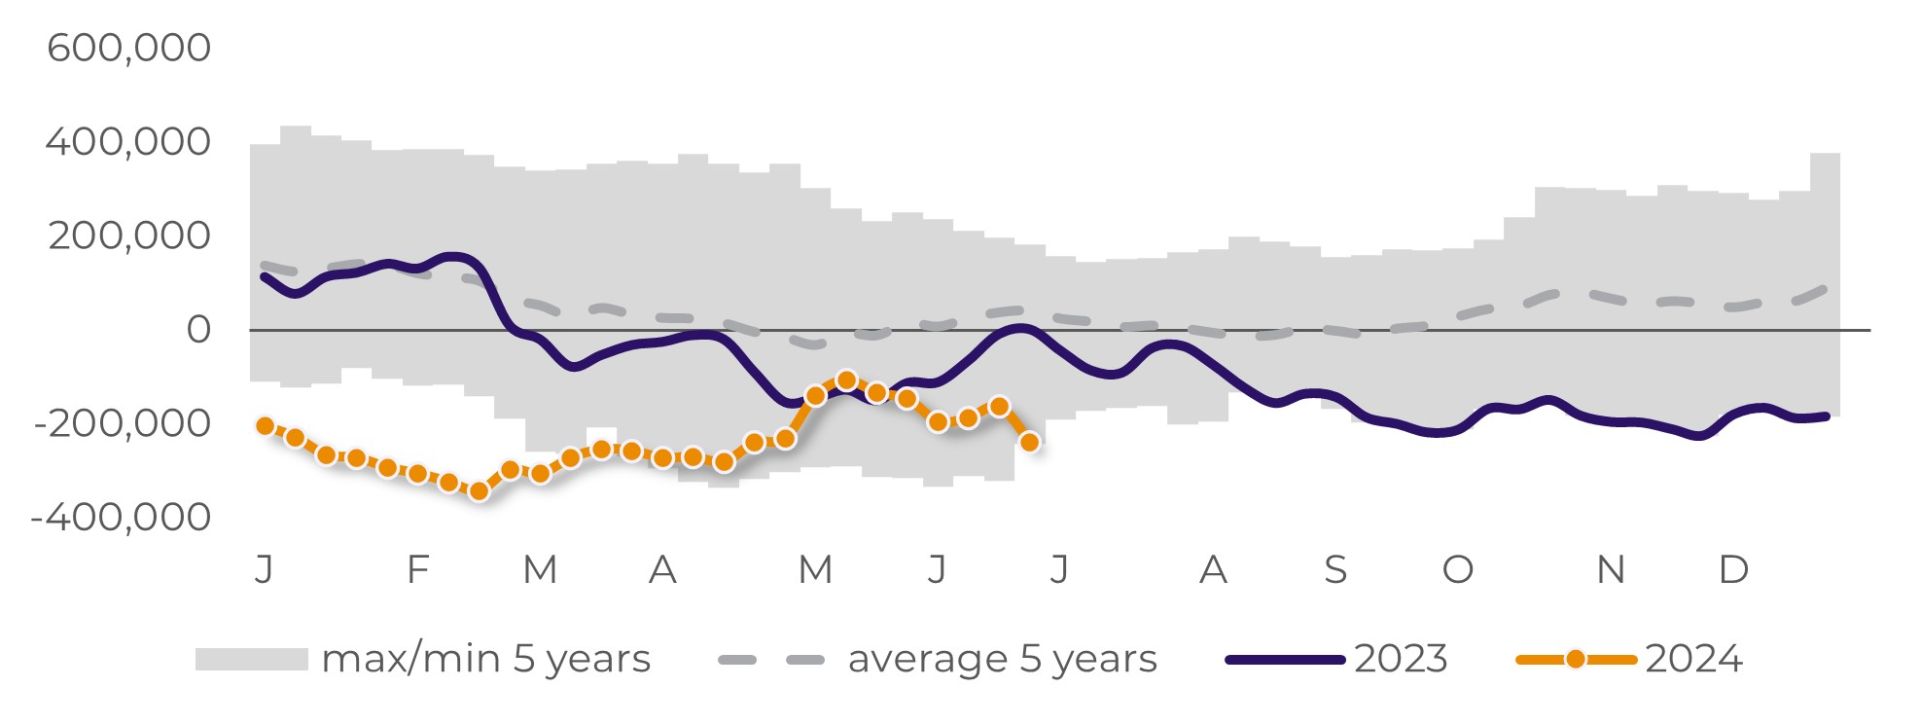
Source: CFTC
CBOT Soybeans - Net position of Speculative Funds (lots)
Source: CFTC
Weekly Report — Grains and Oilseeds
Written by Alef Dias
alef.dias@hedgepointglobal.com
alef.dias@hedgepointglobal.com
Reviewed by Ignacio Espinola
ignacio.espinola@hedgepointglobal.com
ignacio.espinola@hedgepointglobal.com
www.hedgepointglobal.com
Disclaimer
This document has been prepared by Hedgepoint Global Markets LLC and its affiliates (“HPGM”) solely for informational and instructional purposes, without the purpose of instituting obligations or commitments to third parties, nor is it intended to promote an offer, or solicitation of an offer of sale or purchase relating to any securities, commodities interests or investment products. Hedgepoint Commodities LLC (“HPC”), a wholly owned entity of HPGM, is an Introducing Broker and a registered member of the National Futures Association. The trading of commodities interests such as futures, options, and swaps involves substantial risk of loss and may not be suitable for all investors. Past performance is not necessarily indicative of future results. Customers should rely on their own independent judgement and outside advisors before entering in any transaction that are introduced by the firm. HPGM and its associates expressly disclaim any use of the information contained herein that directly or indirectly result in damages or damages of any kind. In case of questions not resolved by the first instance of customer contact (client.services@hedgepointglobal.com), please contact our internal ombudsman channel (ombudsman@hedgepointglobal.com) or 0800-878- 8408/ouvidoria@hedgepointglobal.com (only for customers in Brazil).


Contact us
hedgepointhub.support@hedgepointglobal.com
ouvidoria@hedgepointglobal.com
Funchal Street, 418, 18º floor - Vila Olímpia São Paulo, SP, Brasil
Check our general terms and important notices.
This page has been prepared by Hedgepoint Schweiz AG and its affiliates (“Hedgepoint”) solely for informational and instructional purposes, without the purpose of instituting obligations or commitments to third parties, nor is it intended to promote an offer, or solicitation of an offer of sale or purchase relating to any securities, commodities interests or investment products. Hedgepoint and its associates expressly disclaim any use of the information contained herein that directly or indirectly result in damages or damages of any kind. Information is obtained from sources which we believe to be reliable, but we do not warrant or guarantee the timeliness or accuracy of this information. The trading of commodities interests such as futures, options, and swaps involves substantial risk of loss and may not be suitable for all investors. You should carefully consider wither such trading is suitable for you in light of your financial condition. Past performance is not necessarily indicative of future results. Customers should rely on their own independent judgement and/or advisors before entering in any transaction.Hedgepoint does not provide legal, tax or accounting advice and you are responsible for seeking any such advice separately.Hedgepoint Schweiz AG is organized, incorporated, and existing under the laws of Switzerland, is filiated to ARIF, the Association Romande des Intermédiaires Financiers, which is a FINMA-authorized Self-Regulatory Organization. Hedgepoint Commodities LLC is organized, incorporated, and existing under the laws of the USA, and is authorized and regulated by the Commodity Futures Trading Commission (CFTC) and a member of the National Futures Association (NFA) to act as an Introducing Broker and Commodity Trading Advisor. HedgePoint Global Markets Limited is Regulated by the Dubai Financial Services Authority. The content is directed at Professional Clients and not Retail Clients. Hedgepoint Global Markets PTE. Ltd is organized, incorporated, and existing under the laws of Singapore, exempted from obtaining a financial services license as per the Second Schedule of the Securities and Futures (Licensing and Conduct of Business) Act, by the Monetary Authority of Singapore (MAS). Hedgepoint Global Markets DTVM Ltda. is authorized and regulated in Brazil by the Central Bank of Brazil (BCB) and the Brazilian Securities Commission (CVM). Hedgepoint Serviços Ltda. is organized, incorporated, and existing under the laws of Brazil. Hedgepoint Global Markets S.A. is organized, incorporated, and existing under the laws of Uruguay. In case of questions not resolved by the first instance of customer contact (client.services@Hedgepointglobal.com), please contact internal ombudsman channel (ombudsman@hedgepointglobal.com – global or ouvidoria@hedgepointglobal.com – Brazil only) or call 0800-8788408 (Brazil only).Integrity, ethics, and transparency are values that guide our culture. To further strengthen our practices, Hedgepoint has a whistleblower channel for employees and third-parties by e-mail ethicline@hedgepointglobal.com or forms Ethic Line – Hedgepoint Global Markets.Security note: All contacts with customers and partners are conducted exclusively through our domain @hedgepointglobal.com. Do not accept any information, bills, statements or requests from different domains and pay special attention to any variations in letters or spelling, as they may indicate a fraudulent situation.“HedgePoint” and the “HedgePoint” logo are marks for the exclusive use of HedgePoint and/or its affiliates. Use or reproduction is prohibited, unless expressly authorized by HedgePoint. Furthermore, the use of any other marks in this document has been authorized for identification purposes only. It does not, therefore, imply any rights of HedgePoint in these marks or imply endorsement, association or seal by the owners of these marks with HedgePoint or its affiliates.