Global markets for soybeans and corn continue to face a period of high uncertainty, in which macroeconomic, geopolitical, and climatic factors continue to exert a direct influence on price formation. Although the supply outlook remains relatively comfortable for soybeans and corn, demand dynamics are undergoing significant structural changes, particularly due to the expansion of biofuels, shifts in international trade, and evolving consumption patterns among major importers such as China.
In this context, the market’s focus remains on three key factors: the determination of the production potential of U.S. crops during the growing season on the weather market, the behavior of global demand — particularly for soybean crushing and Chinese imports — and the competitiveness of the main exporting countries, especially Brazil, the United States, and Argentina. These factors are expected to determine the balance between supply and demand over the coming months and set the stage for either a continued recovery or a resurgence of upward pressure on prices.
• Conflict in the Middle East: The ceasefire signed on June 18 between the U.S. and Iran was short-lived — new attacks beginning on July 7 reignited tensions, bringing volatility back to international markets. The energy sector index, which had lost momentum in May and June, began to rise again.
• Exchange Rates and Interest Rates: The dollar index once again surpassed the 100-point mark against a basket of currencies, a trend also reflected in the real, which resumed its depreciation (in the range of R$5.10 – 5.20). This movement is linked to the rise in oil prices (two waves of increases: the start of the war and a resurgence in July), which is strongly correlated with diesel, soybean oil, and, to a lesser extent, corn.
• Inflation and monetary policy: the latest spike in oil prices has reignited inflation concerns in the U.S., Brazil, the Eurozone, and other countries, prompting central banks to adopt more hawkish stances (the Fed kept interest rates unchanged; the ECB raised them). This has direct implications for the carry trade and exchange rate dynamics in Brazil, especially in an election year, with the Selic rate on a downward trajectory and the U.S. rate stable—a development that warrants close monitoring through the end of the year.
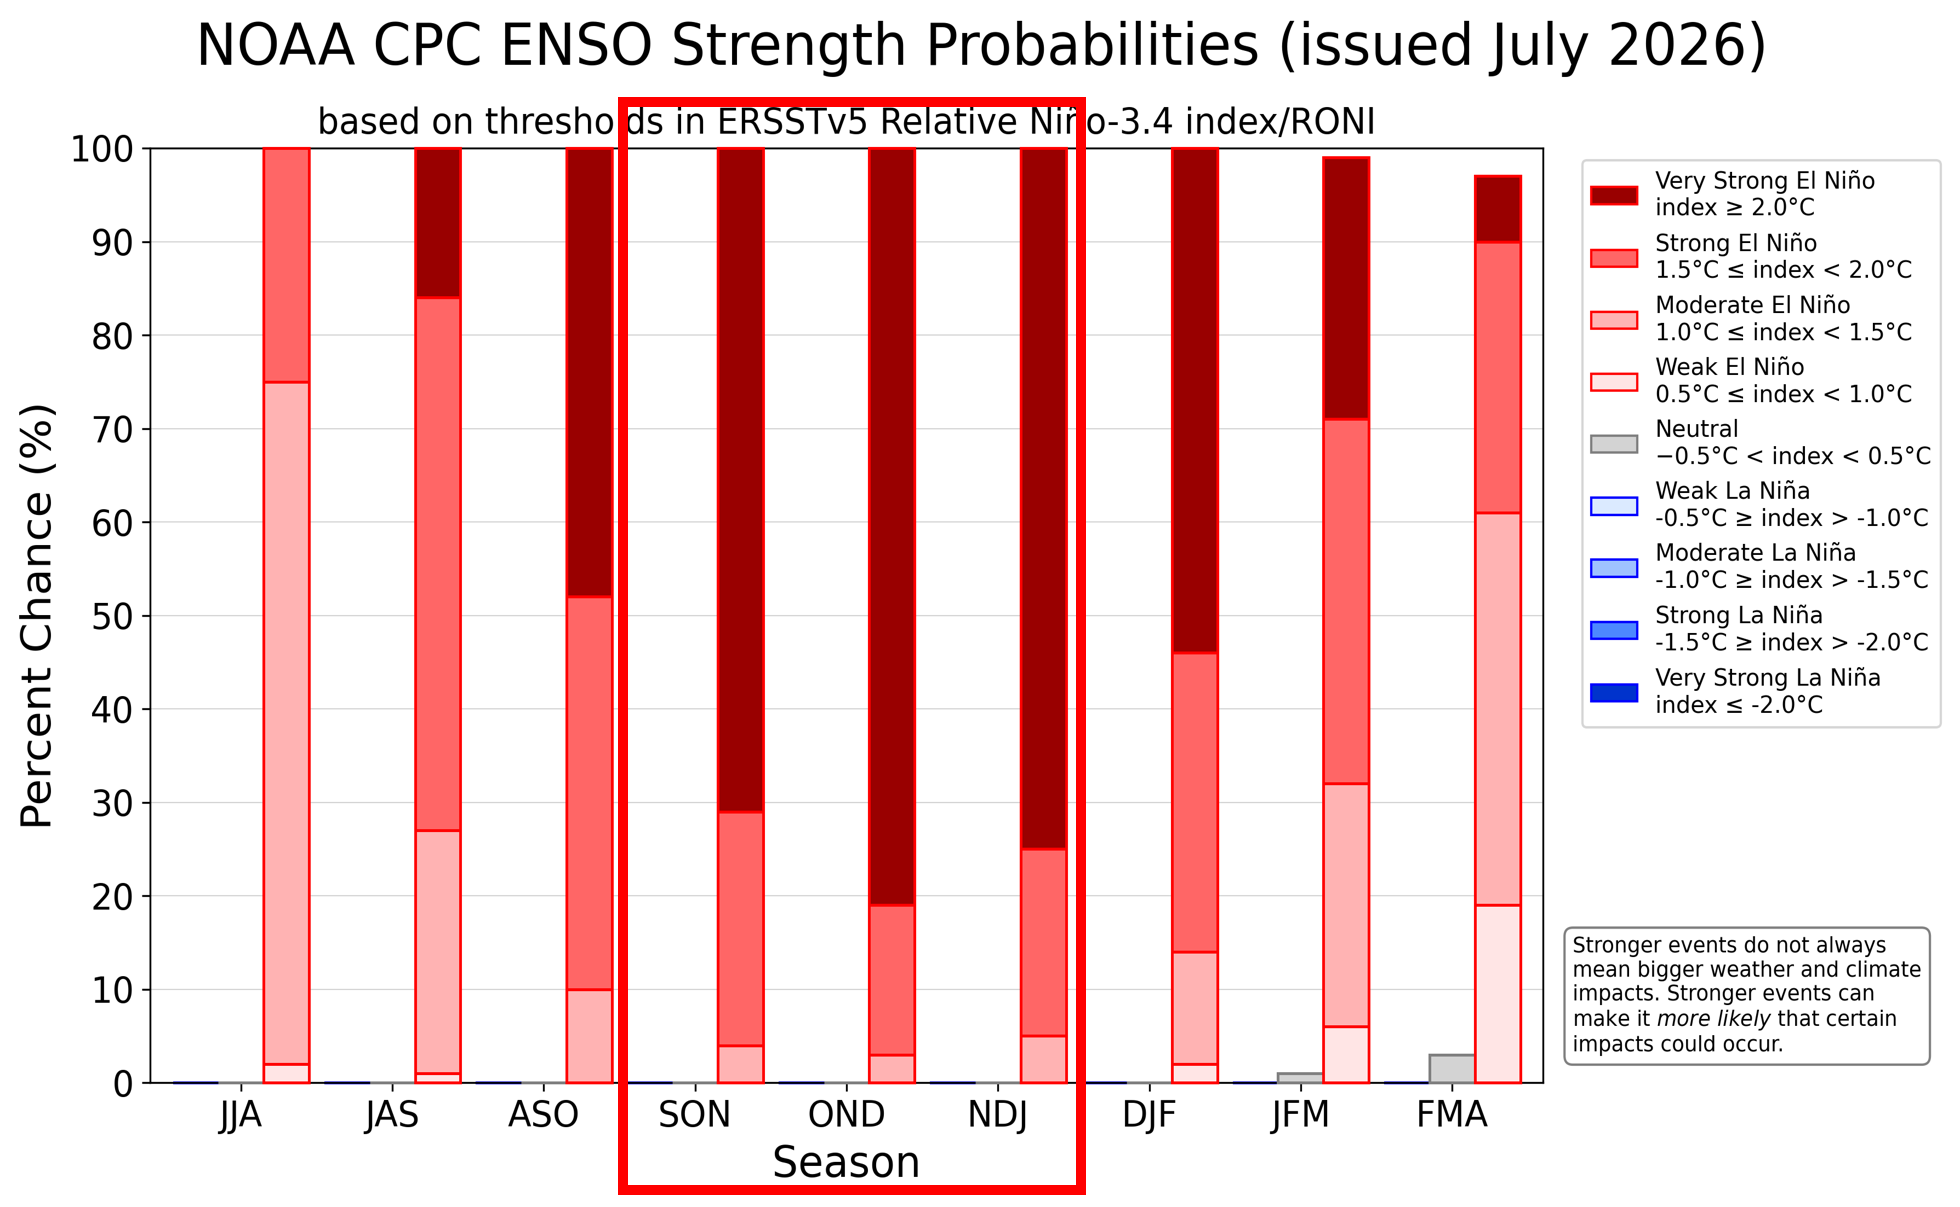
• El Niño has been officially confirmed. Stronger effects are expected between September and January, in line with the higher probability of a strong/very strong El Niño projected by NOAA for that period.
• There are already signs in southern Brazil (above-average rainfall).
• Historical impacts of El Niño: above-average rainfall for the southern half of South America (which typically benefits Argentina, Uruguay, Paraguay, and southern Brazil) and below-average rainfall for north-central Brazil — a pattern that severely hampered yield in Mato Grosso during the 2023/24 crop.
• Southeast Asia (Indonesia, Malaysia, Thailand — major palm oil producers) also tends to suffer from below-average rainfall, which could directly impact the vegetable oil market, including soybean oil.
• A key focus for the coming months, especially for South America.
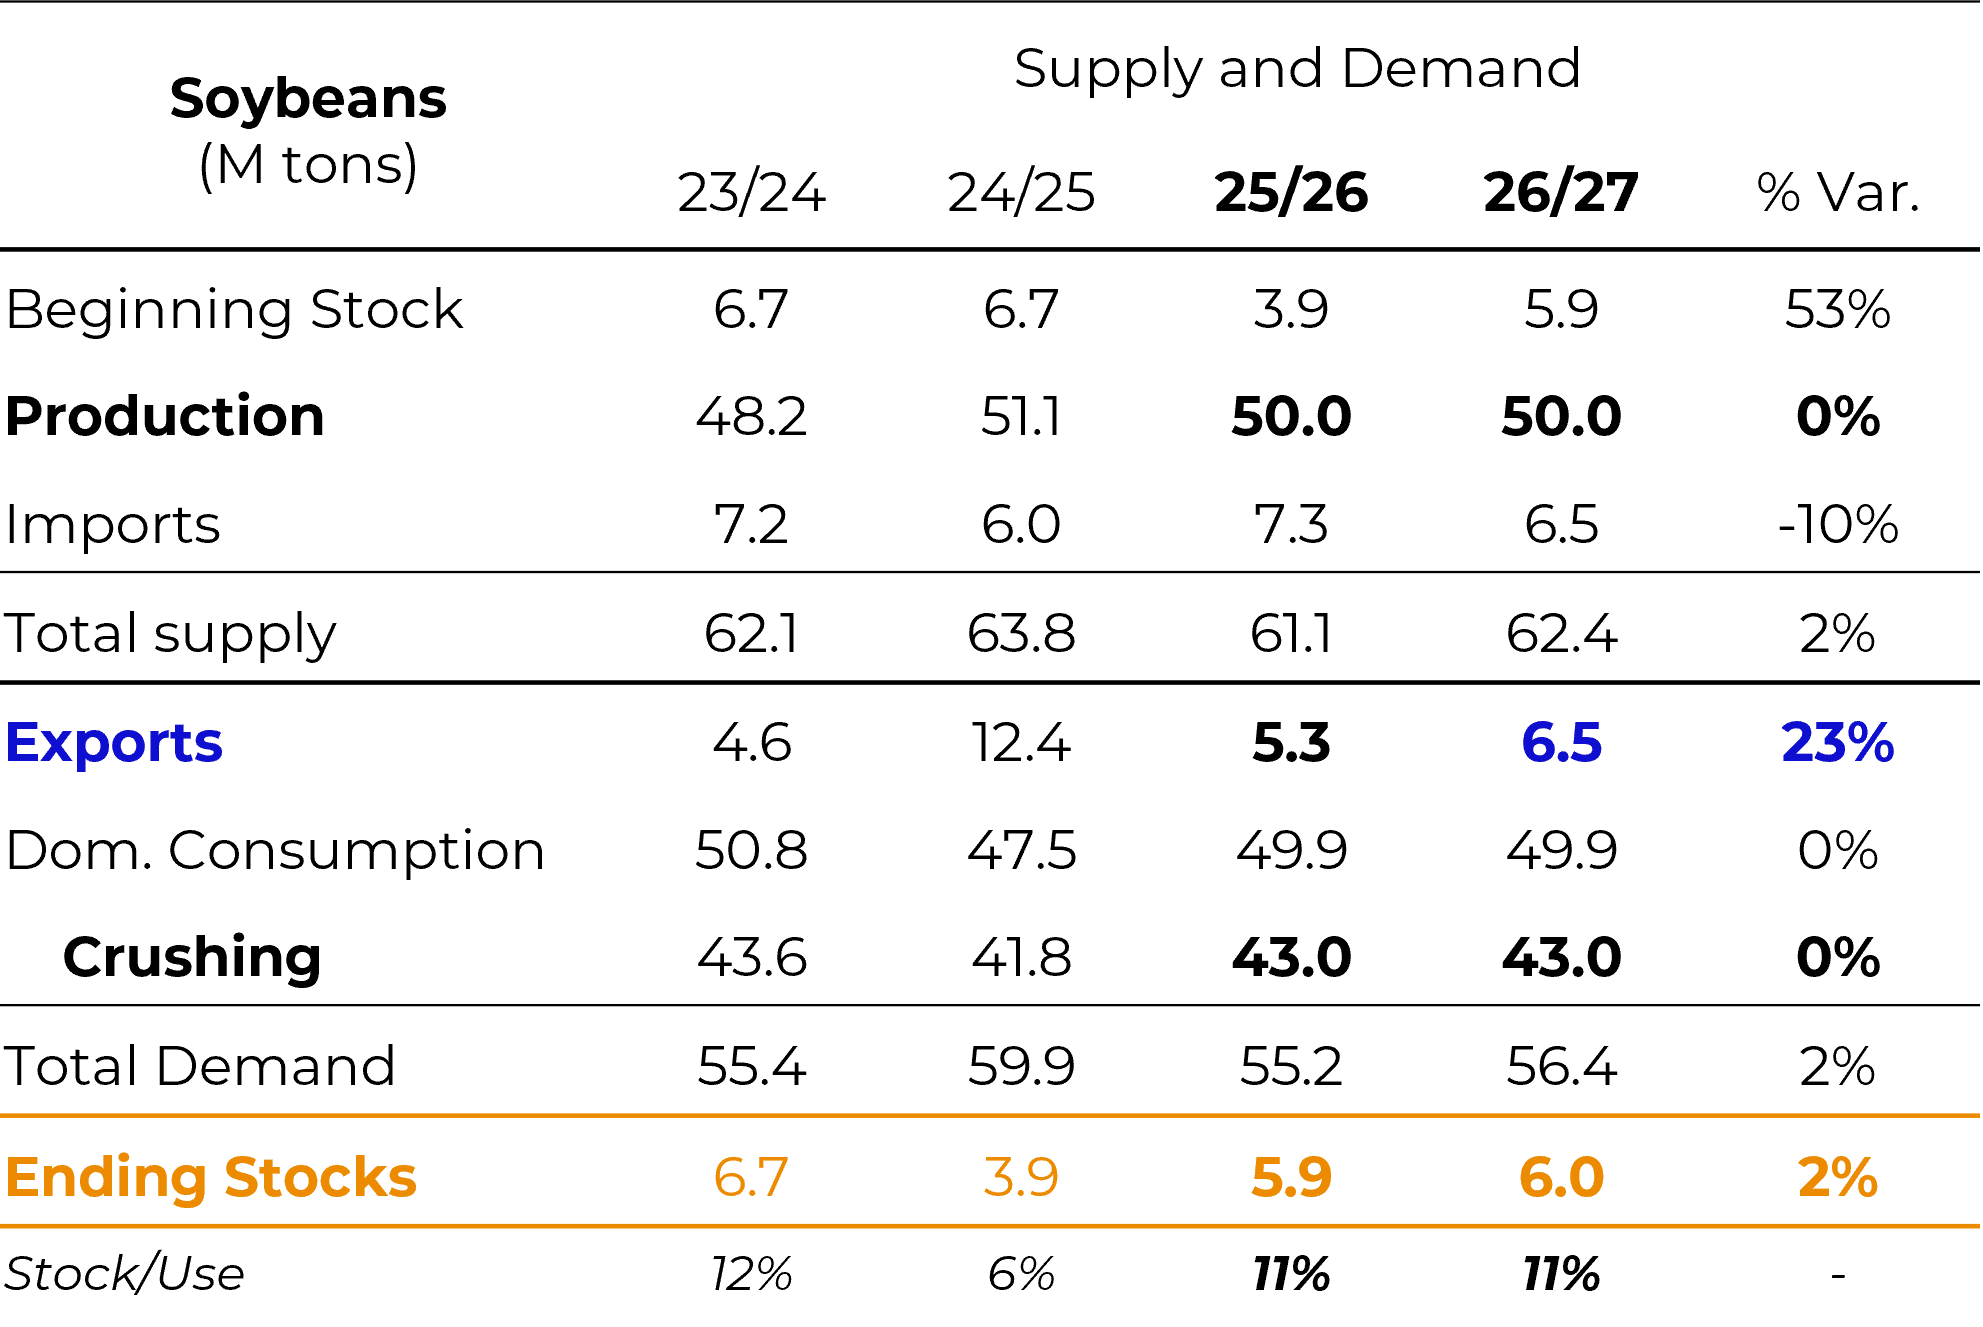
Harvests in Brazil and Argentina are complete; market attention is focused on the development of the U.S. crop, with the weather market gaining importance leading up to the start of the harvest in September.
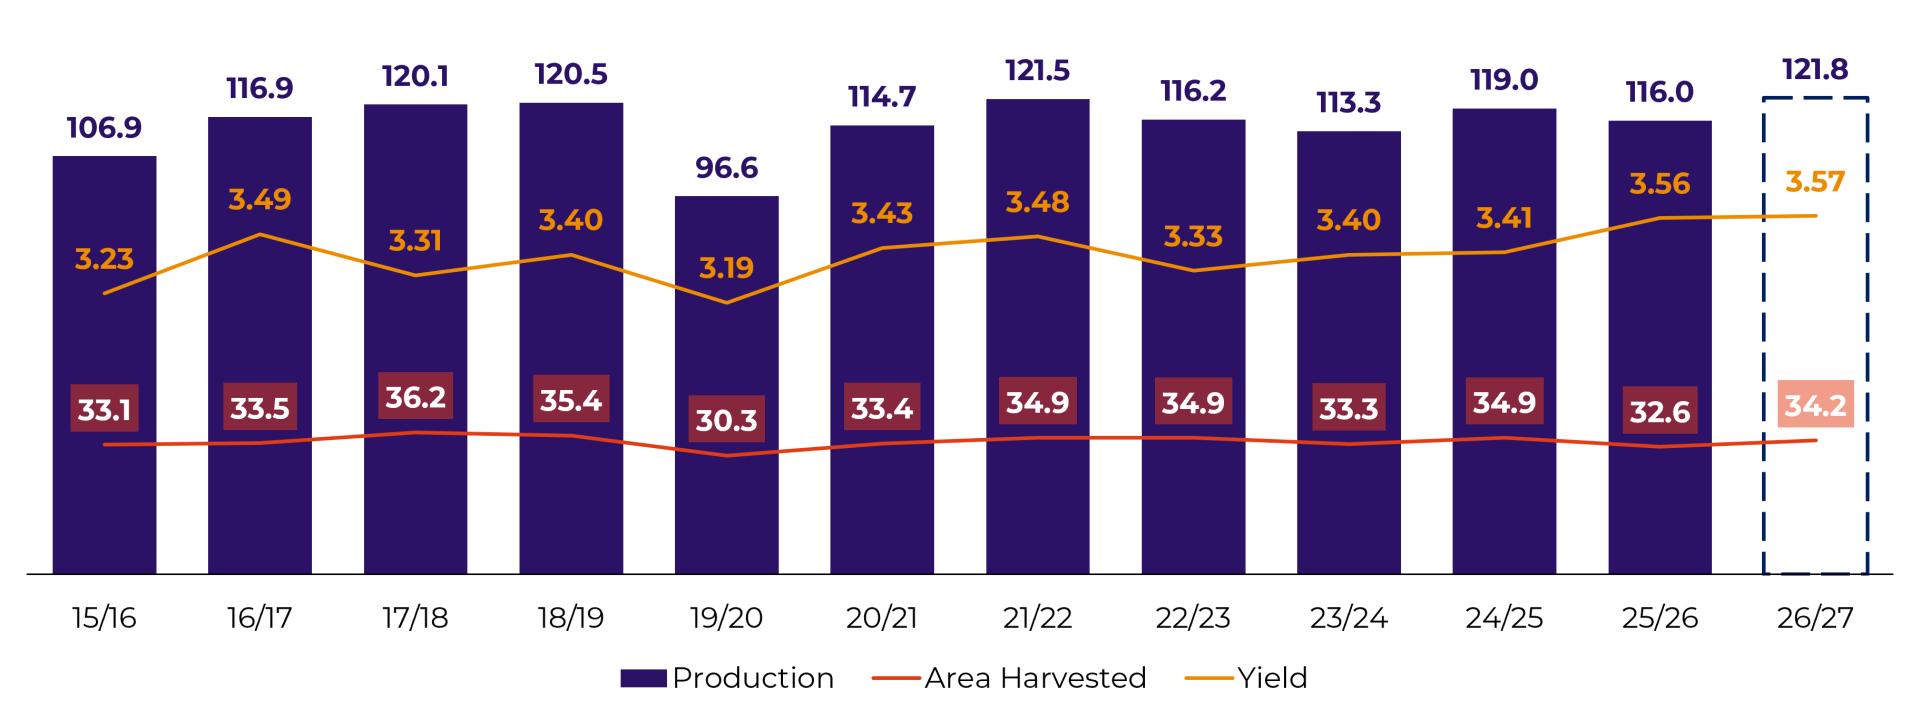
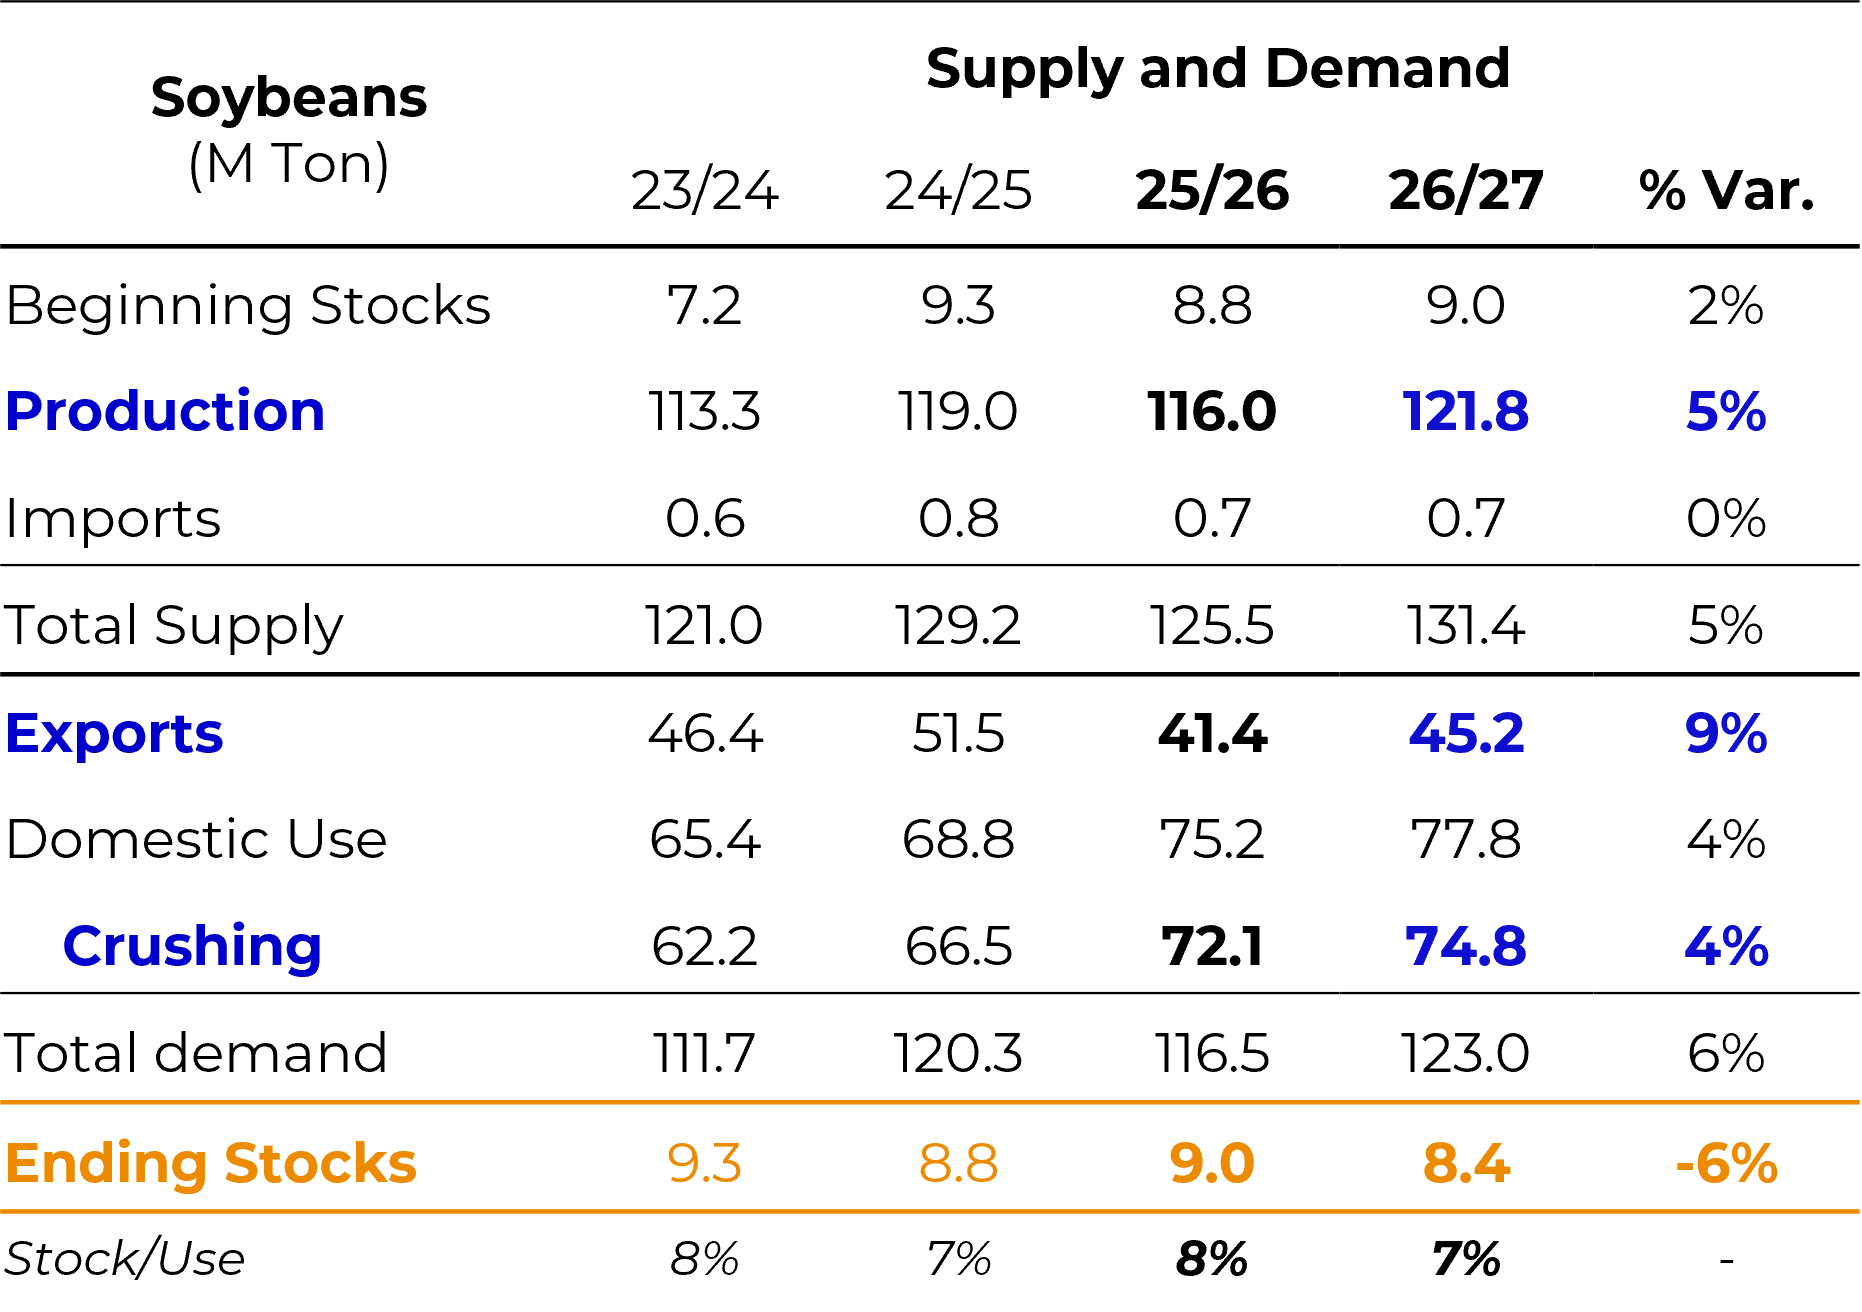
• The USDA raised its U.S. crop estimate to a record 121.8 million metric tons (previous record: 121.5 million), while also projecting higher crush volumes and exports in 2026/27 — which should lead to lower stocks despite a record crop.
• For Brazil and Argentina, it is still too early for final figures (planting does not begin until September); the USDA projects 186 million metric tons for Brazil.
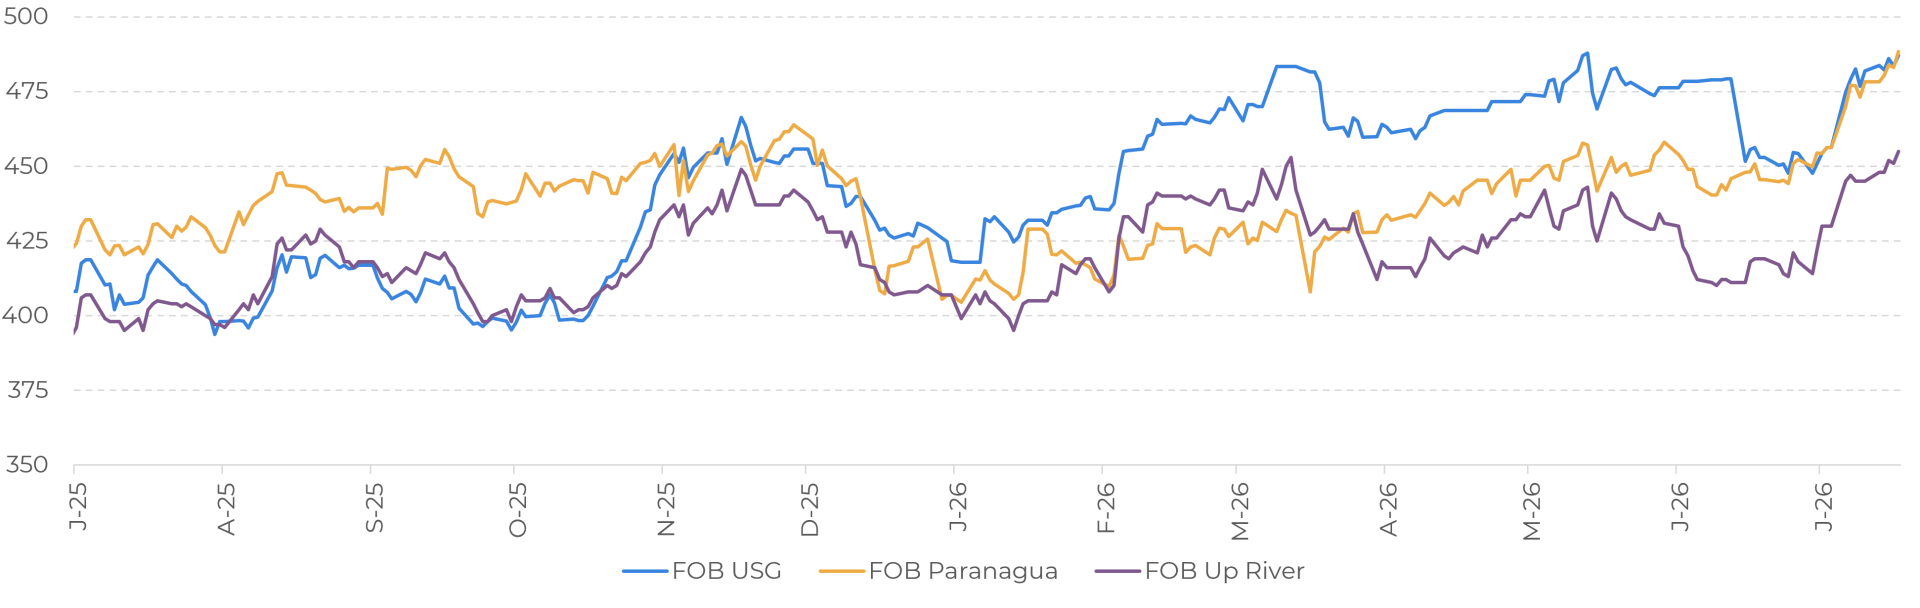
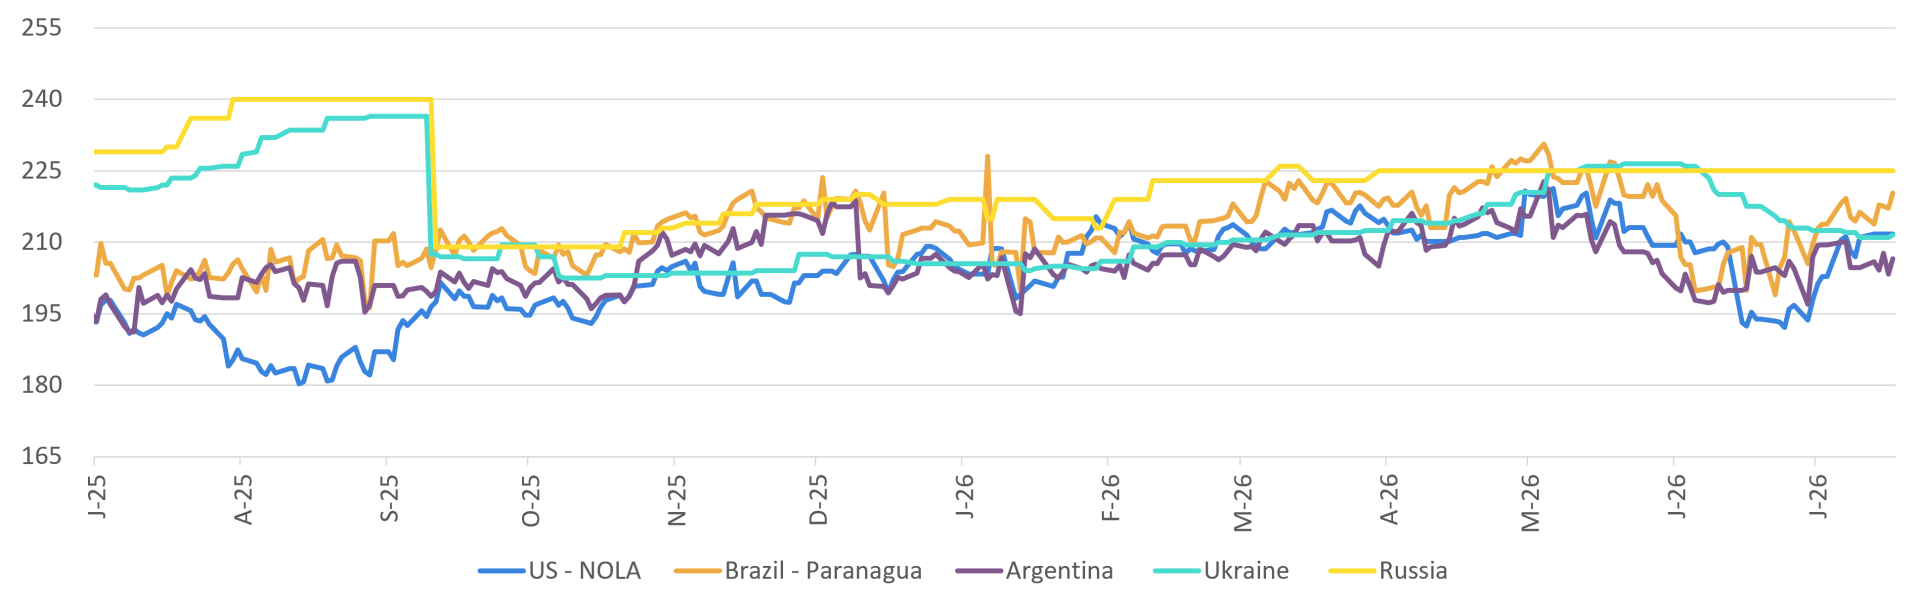
• Prices by origin: Argentina has remained the most competitive origin since April; the Brazilian price is gaining momentum due to second-half seasonality and is already vying for 2nd or 3rd place with the U.S. — a development considered early relative to historical patterns, driven by very strong Brazilian exports. Trend: once the U.S. crop comes online, the U.S. price is expected to fall, and Brazil is likely to become the least competitive origin among the three.
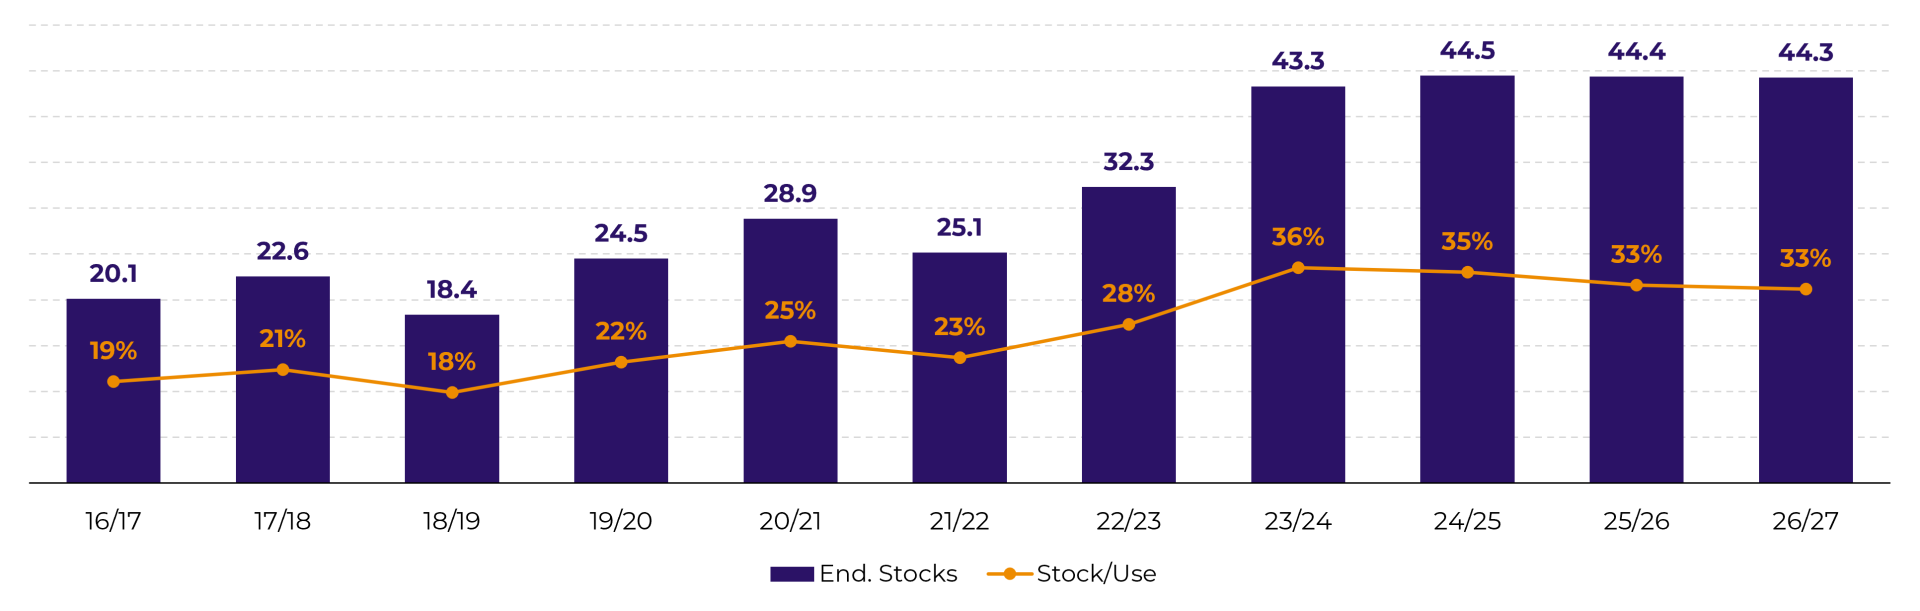
• A clear and consistent strategy (over the past 2–3 seasons) of maintaining high soybean stocks (43–44 million metric tons, a stock-to-use ratio of 33–36%, ~4 months of consumption) for food security reasons, even without significant growth in domestic crushing/consumption.
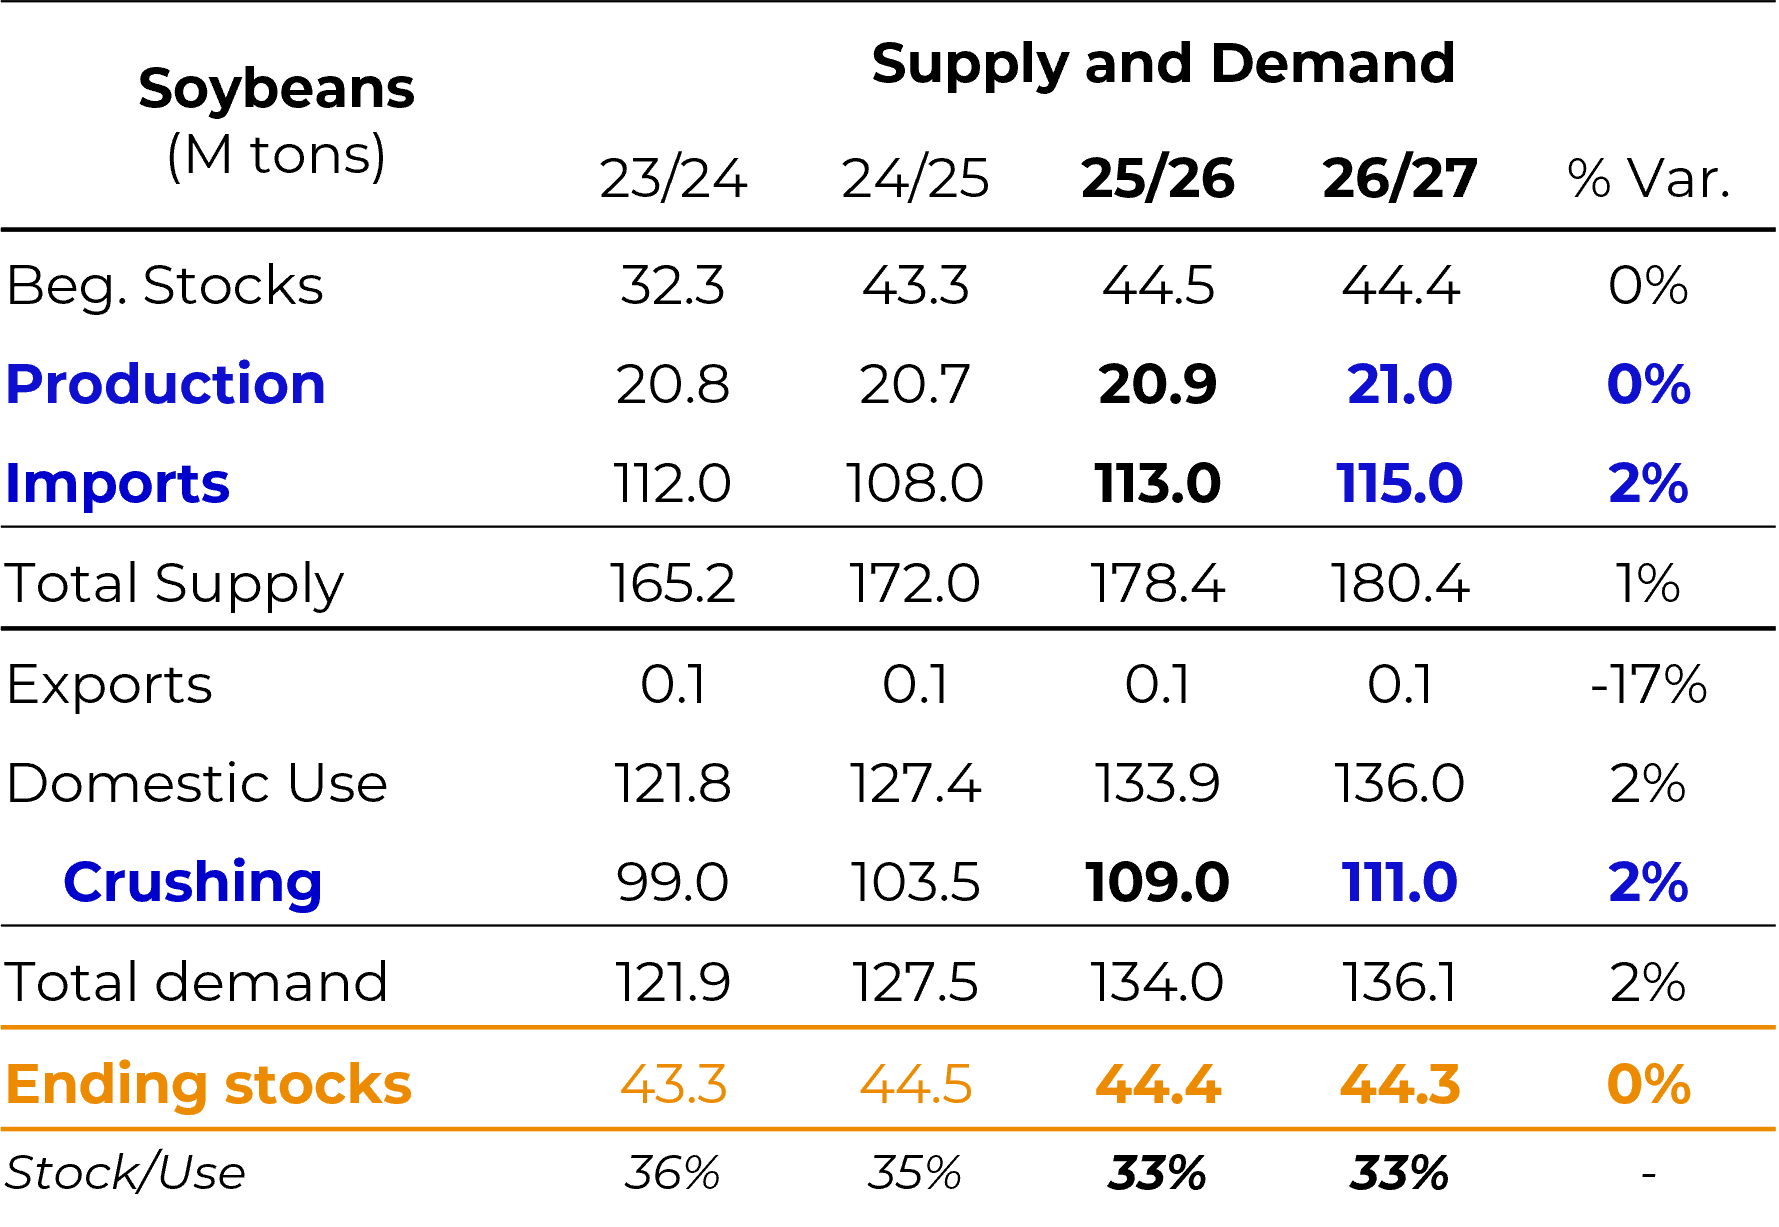
• Domestic production is stable; of note is a slight increase in imports and crushing, aimed at rebuilding/maintaining stocks.
• Margins in China’s swine sector are tight or negative; the Chinese government has already signaled a policy to reduce the breeding herd (from ~40 million to 37.5 million head) to improve margins — indicating that Chinese consumption is unlikely to grow in the short term.
• Argentina Loses Ground in China: Throughout 2025, Argentina gained prominence by selling soybeans to China due to the U.S.-China trade war; now, that gap is closing, with the U.S. regaining market share.
• Despite the potentially record crop, the USDA projects yield to be equal to or slightly higher than last year’s (which was nearly perfect) — a feat considered difficult to replicate.
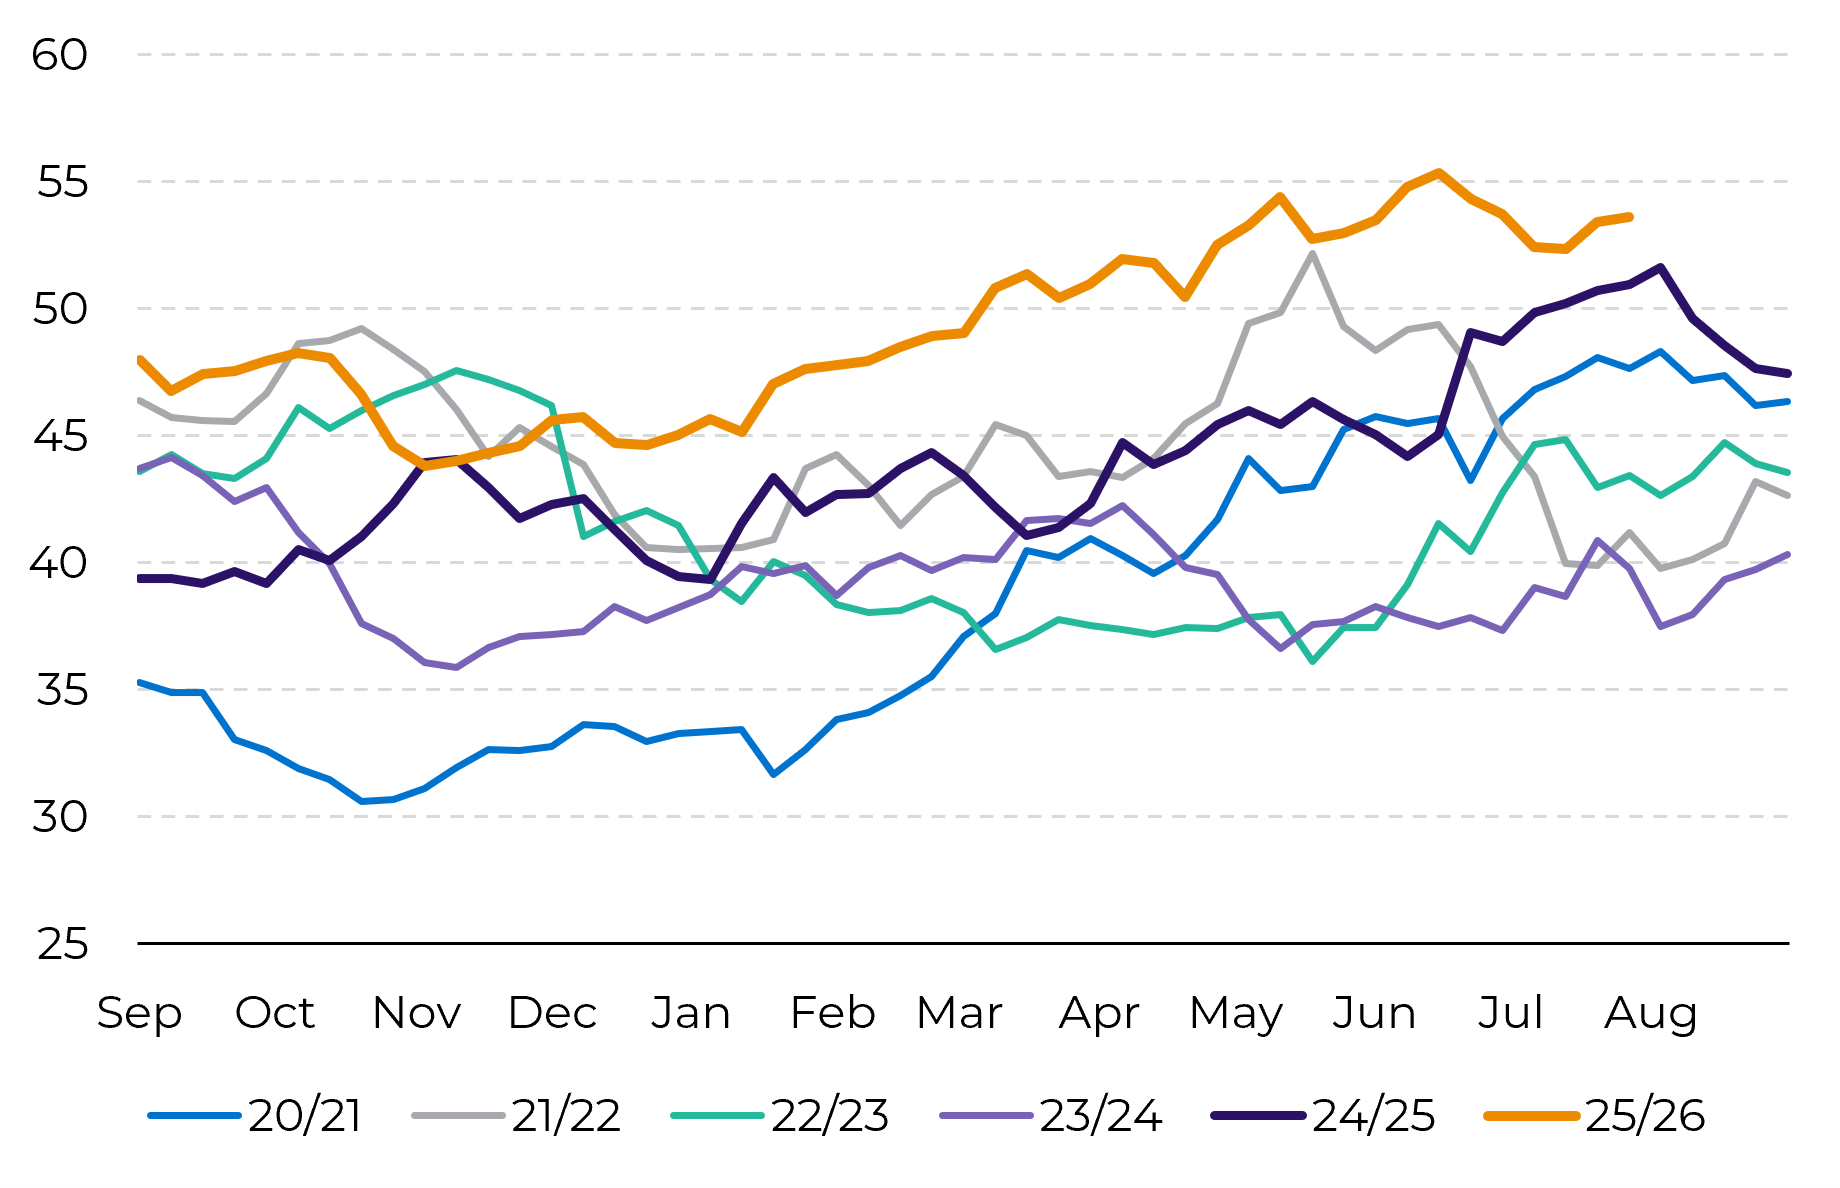
• Crop Conditions: Crop conditions are below last year’s levels, which opens the door for yield cuts in upcoming monthly USDA reports.
• Drought Monitor: The area affected by drought has more than doubled (from ~7% to ~18% of the soybean acreage) compared to last year, especially in the western part of the belt (South Dakota and Nebraska) — a sign that the USDA’s projected yields may be optimistic, although there are no indications of a “major problem” for the crop.
• Forecasts call for little rain and above-average temperatures over the next two weeks — a scenario that is already being partially priced in and could fuel climate-related speculation in August (a decisive month for soybeans).
• Crushing: an all-time high, driven by the high share of soybean oil in crushers’ margins (~54%) and very favorable board crush margins — a trend that is expected to continue as new plants come online (the effect of the higher biodiesel blend confirmed in March).
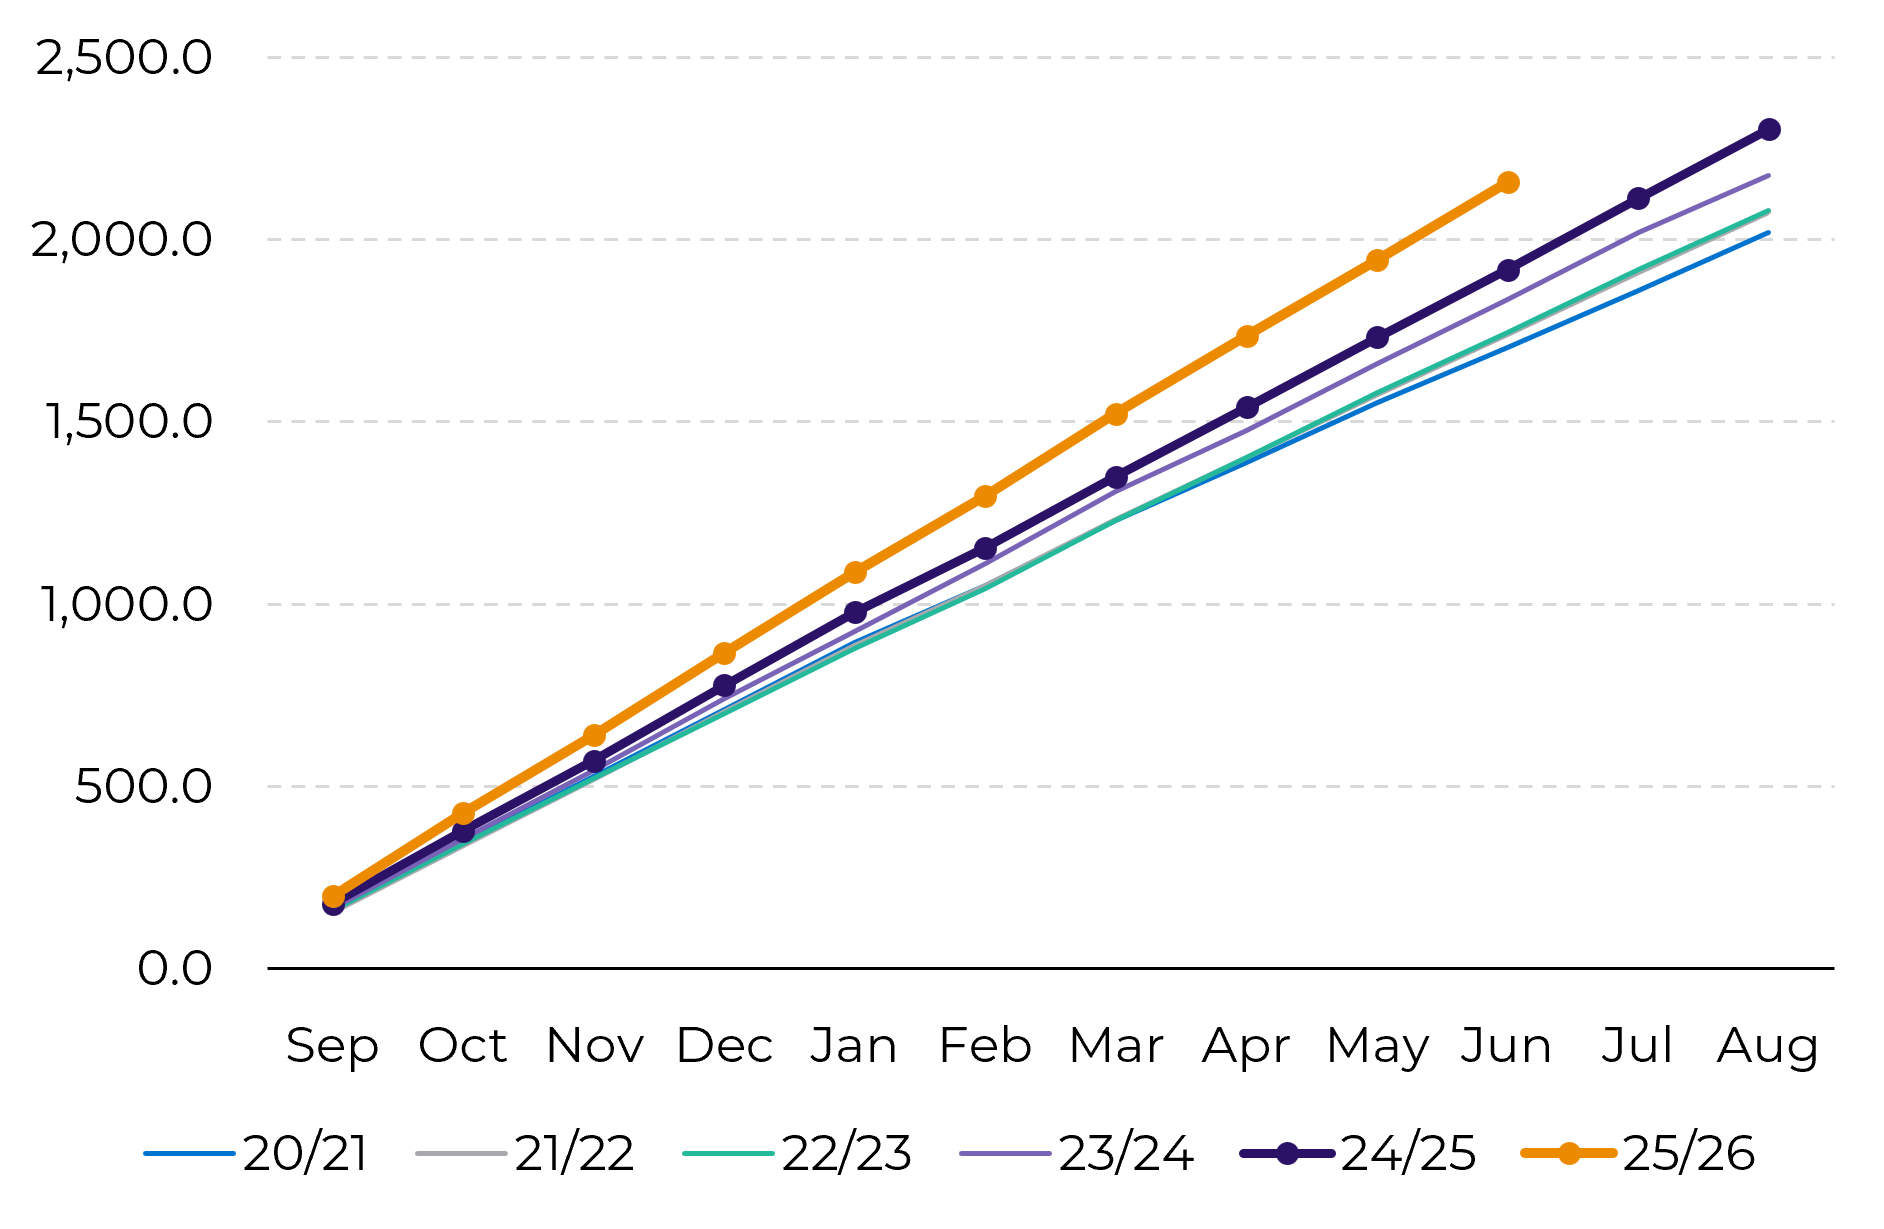
• Exports: The resumption of Chinese purchases of U.S. soybeans is already having a positive impact on the export curve for the 25/26 and 26/27 marketing years, following a period of weakness.
• Price: Soybeans around US$12.00–12.20/bushel, considered a fair level (a regression analysis would indicate a slightly lower equilibrium, ~US$ 11.50–11.70, but US$ 12.00 acts as a psychological support level). The US$ 11–12 range has held throughout the year.
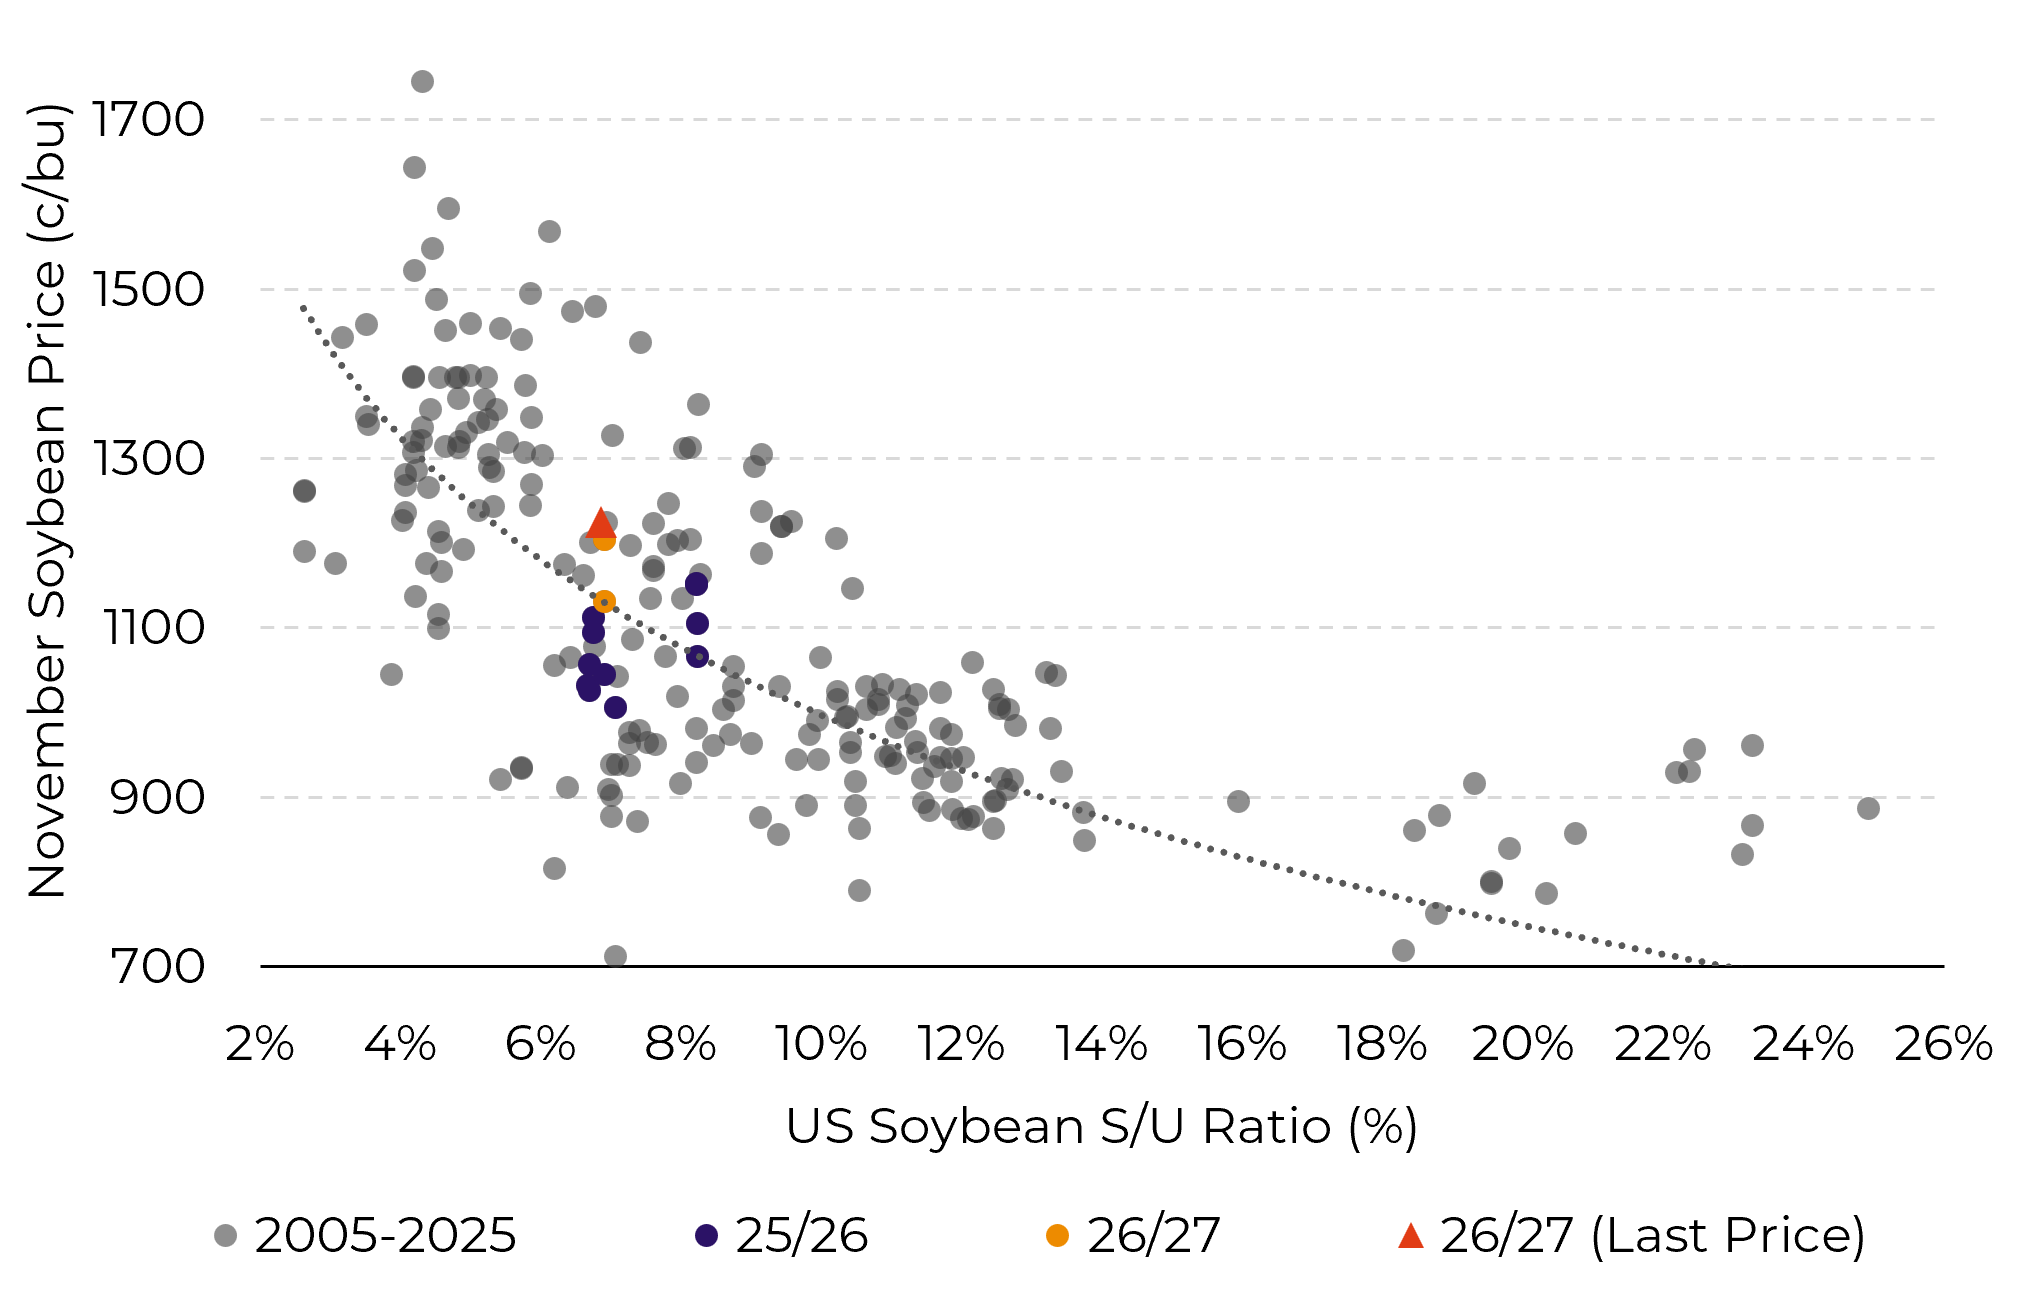
Source: USDA, CME, Hedgepoint
• Funds: liquidated long positions in May/June and resumed buying amid the resurgence of conflict in the Middle East and speculation regarding U.S. weather; the soybean complex (especially soybean oil) maintains net long positions.
• The USDA projects 186 million metric tons for the 2026/27 crop year, with no major surprises; Hedgepoint believes that the USDA’s projected increase in planted area is optimistic, given the still-challenging production cost environment — a more modest increase in planted area is expected, contingent on good yields (and El Niño itself) to sustain production.
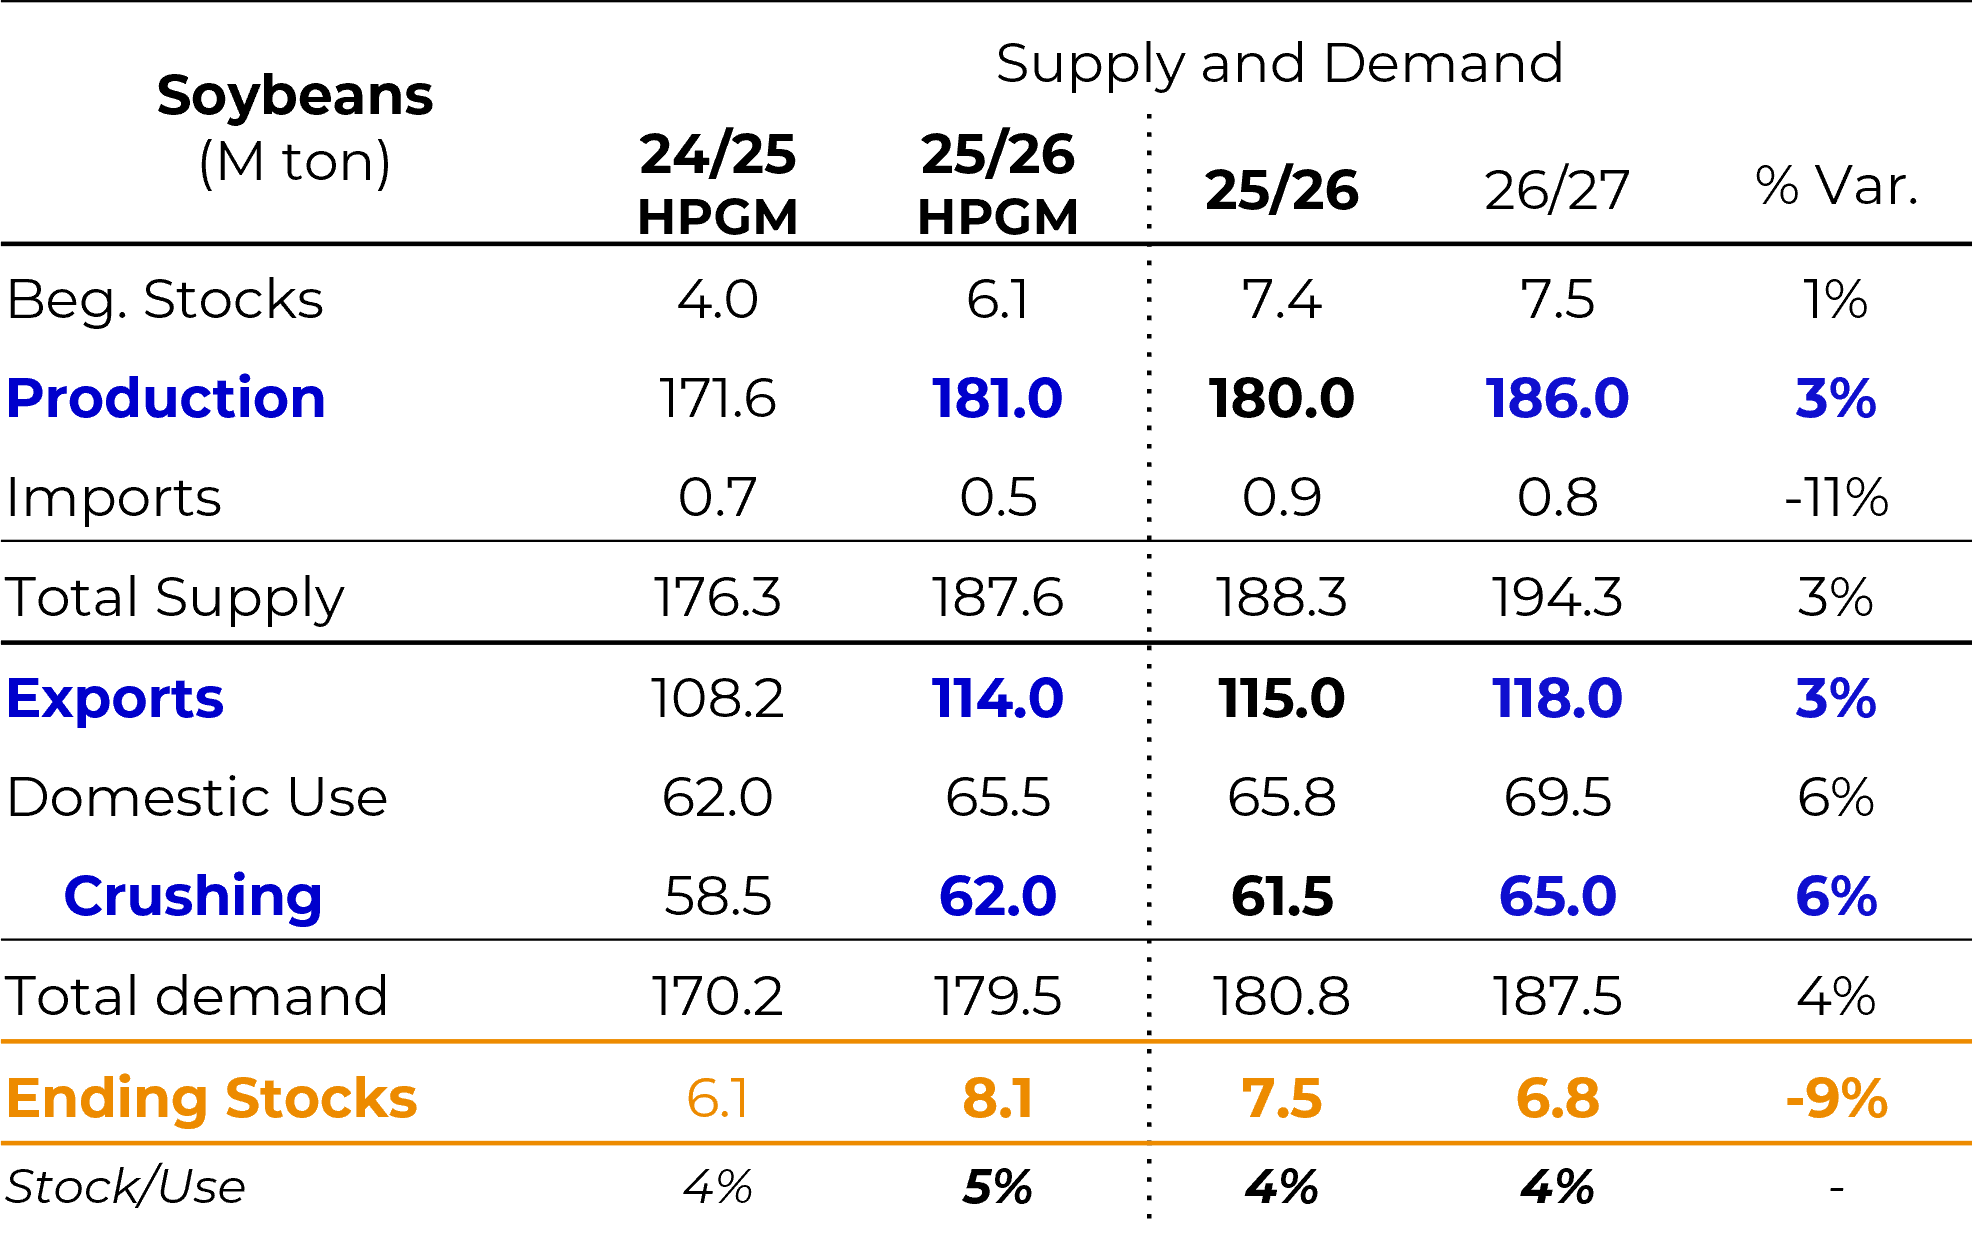
• Sales: 14% of the new crop sold and 71% of the current crop sold (both below last year’s levels) — sales are picking up as prices and premiums improve.
• Exports: The line-up shows 86.4 million metric tons already shipped, compared to 77.2 million the previous year (+9 million) — a strong pace that could lead to an upward revision of the export estimate (114–116 million metric tons). The big unknown: how much China will purchase from Brazil starting in September, when the U.S. crop enters into direct competition for volumes.
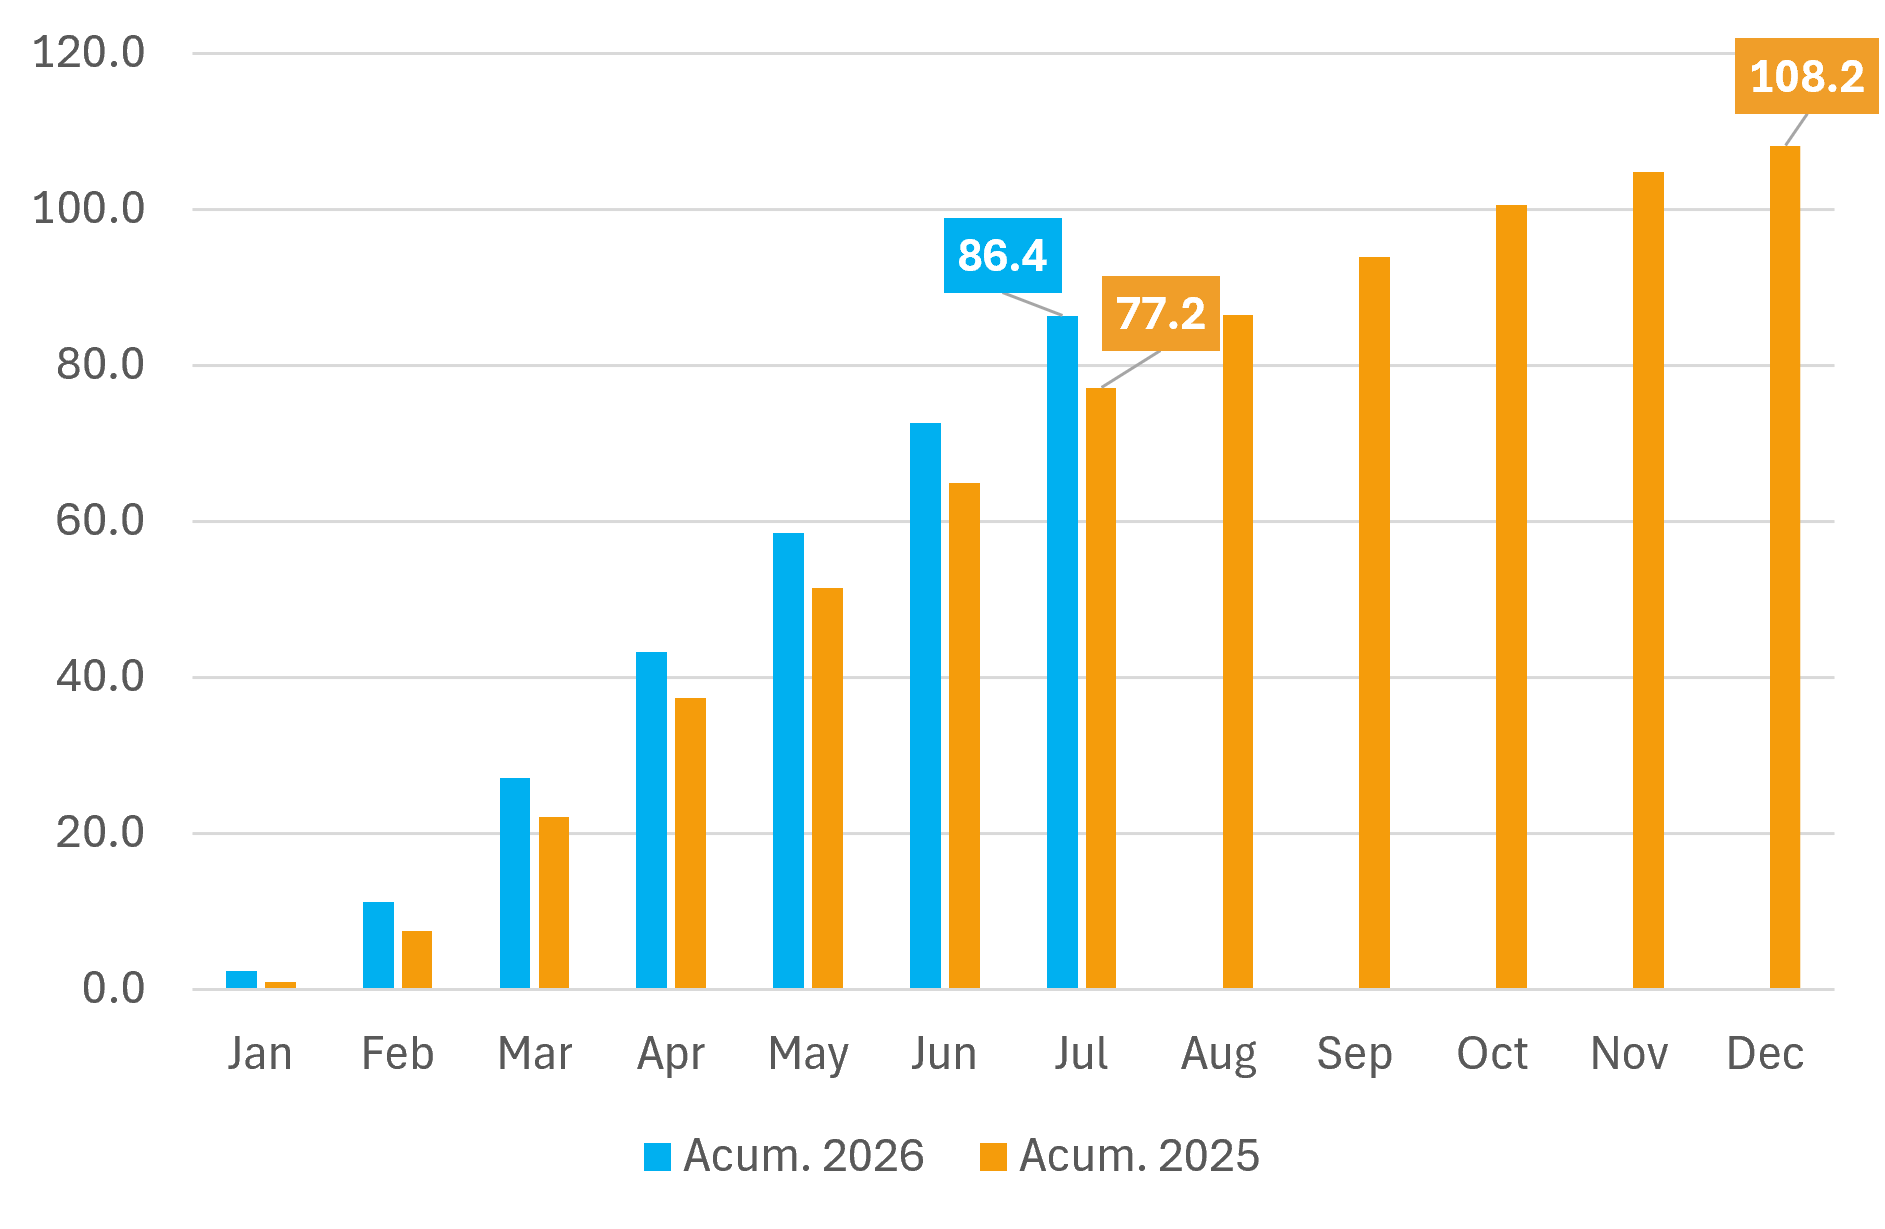
Source: Secex, Shipping Agencies, Hedgepoint
• Basis: gaining strength seasonally (second half of the year), driven by strong exports — a positive environment for producers in the short term, but with the possibility of more significant corrections toward the end of the year.
• Spot price (Rondonópolis benchmark): rose from ~R$ 108–110 to R$ 127, already exceeding the level from the same period last year.
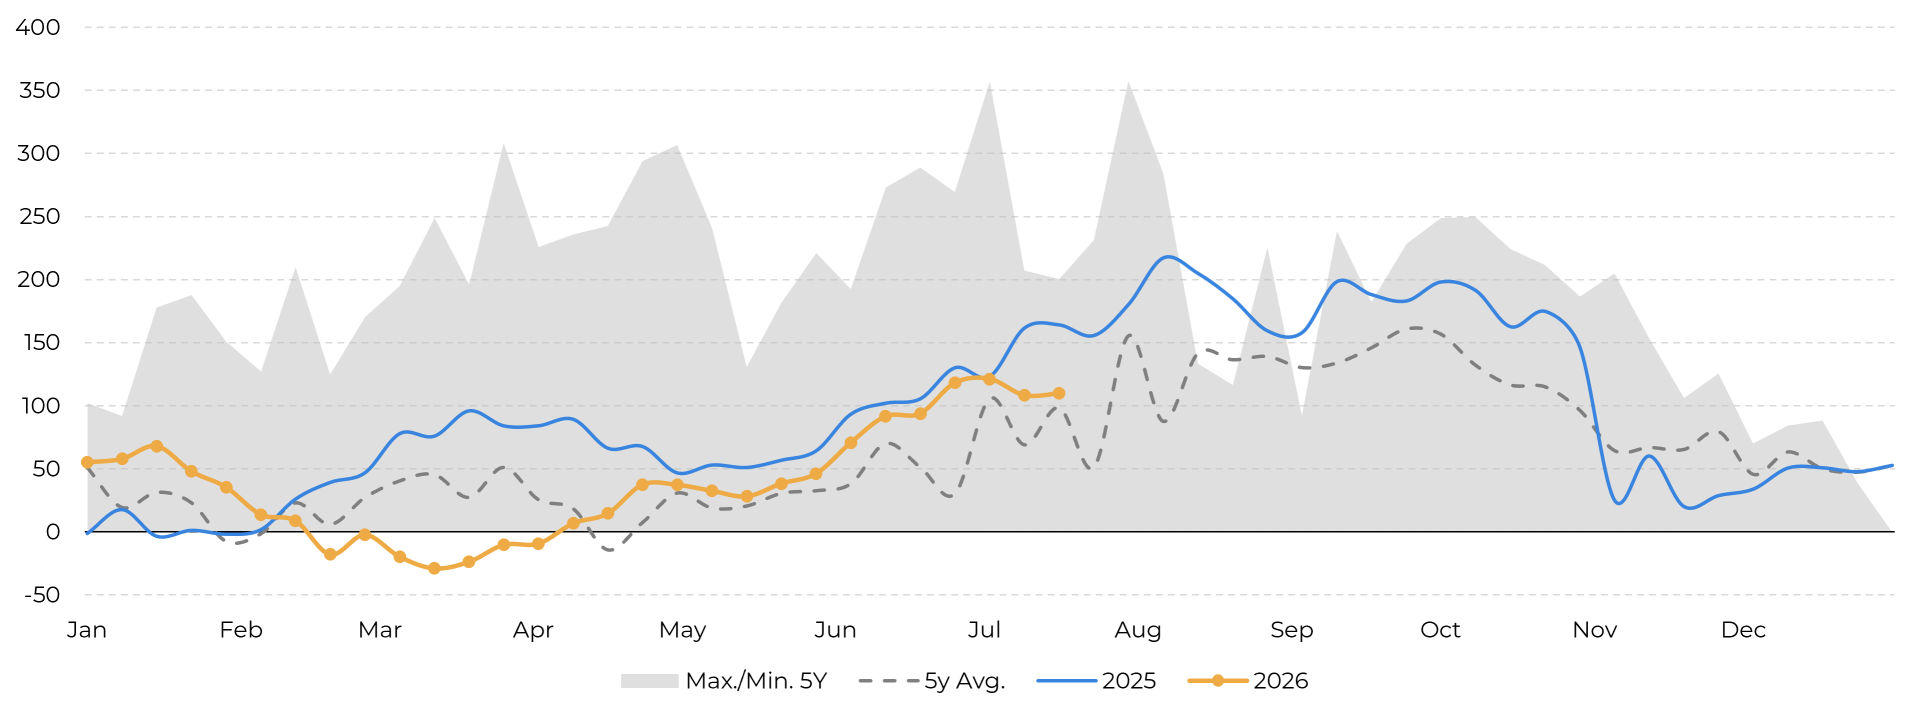
Source: CME, LSEG, ESALQ, Hedgepoint
• Little new information: The USDA is projecting the same crop for 26/27; it is still too early for precise figures.
• Key point: Exports will be much weaker in 2026 (an effect of the trade war already discussed); Argentina is expected to reduce its share of grain exports and focus more on crushing, which is projected to grow. The loss of market share in sales to China favors the U.S.’s return to that market.
• Keep an eye on potential measures from the Milei administration — there is already talk of a gradual reduction in export taxes, with elections in the country next year, which could stimulate both production and the pace of sales by Argentine producers.
Harvest entering the final straight in Argentina; Brazil in the midst of its second-crop harvest (safrinha); market attention focused on the U.S., where the crop remains subject to strong weather volatility.
• Global Highlight: Decline in U.S. production (reduction in corn acreage in favor of soybeans for the 2026/27 crop year) — even so, it could be the second-largest crop in history, below last year’s record of 432 million metric tons (a decline of ~26 million metric tons).
• U.S. exports and stocks are expected to decline but should remain at high levels.
• The USDA has been revising the 25/26 Argentine crop upward (from 52–53 to 63 million metric tons, versus the 67–68 million estimated by the Rosario Stock Exchange) — a large crop that expands Argentina’s export capacity and may put pressure on Brazilian competitiveness.
• European Union: The USDA has already been cutting its crop forecast (especially due to problems in France, which accounts for ~20% of EU production) and raising import projections — this may benefit corn exporters such as Brazil, Argentina, the U.S., and Ukraine.
• Prices by origin: Argentina has become the most competitive (surpassing the U.S.); Brazil is currently the least competitive origin in South America, although the difference is small and offset by quality and logistics.
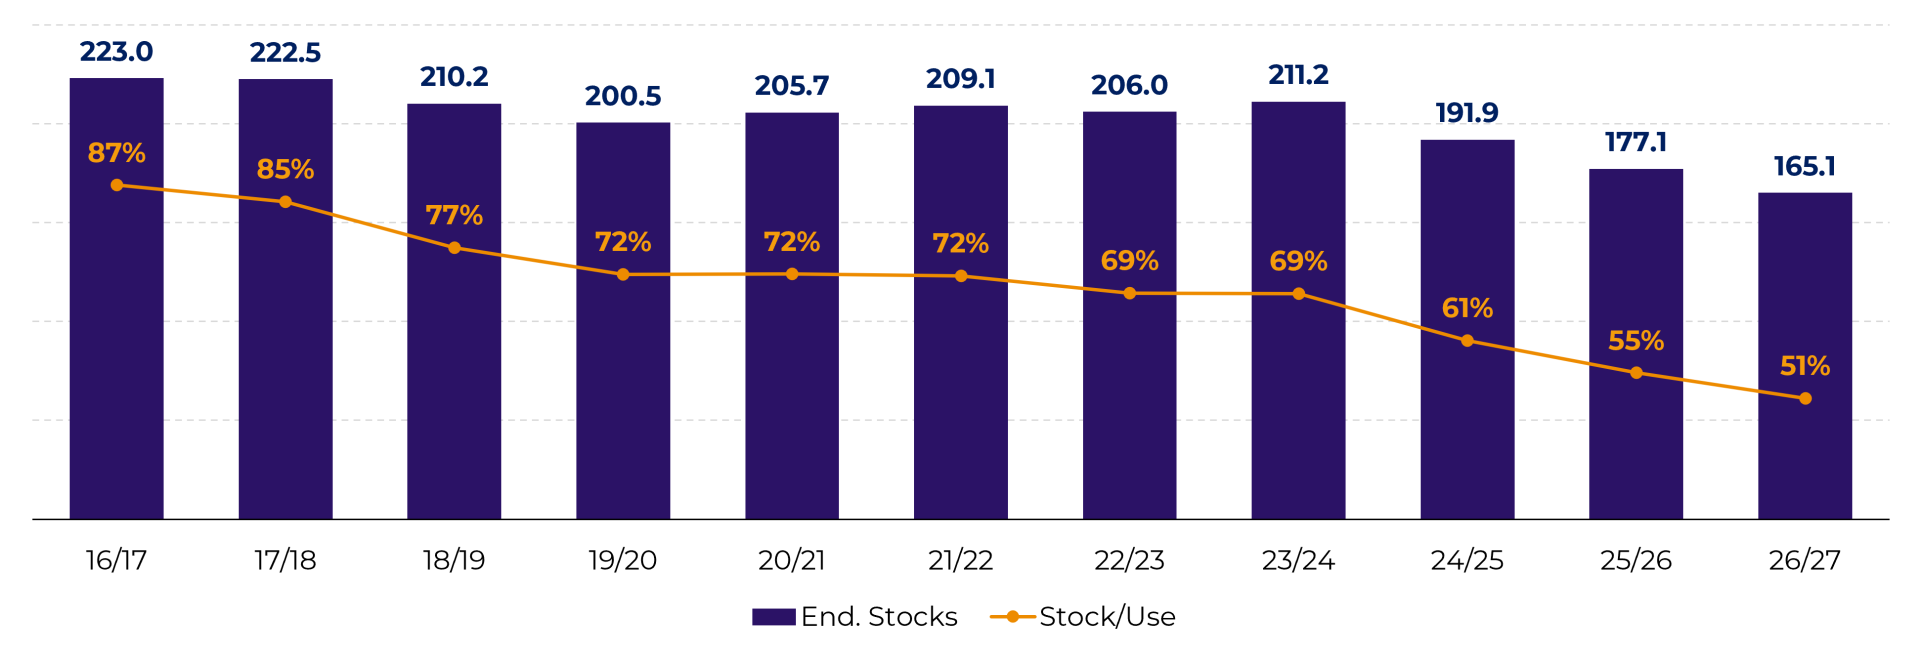
• A pattern opposite to that of soybeans: corn stocks are falling (even with successive record crops), signaling strong domestic consumption.
• Stocks below 200 million metric tons would open the door for China to resume imports at a stronger pace — a development that is not yet on the USDA’s radar for 26/27, but which is historically significant: it was precisely a strong surge in Chinese purchases (~23 million metric tons in 23/24) that made Brazil the world’s largest corn exporter that year.
• The USDA projects a minimal increase in Chinese imports (from 5 to 6 million metric tons) for 26/27, with a record crop of 307 million metric tons.
• It may be the second-largest crop in history, but yields are already projected to be lower than last year’s.
• Crop conditions: As with soybeans, crop conditions are below last year’s levels.
• Drought: ~19% of the corn acreage is affected by drought, vs. ~9% last year (more than double), reinforcing the risk of downward revisions to yields if August weather does not improve.
• Exports: have already exceeded the USDA’s estimate (86.3 million metric tons vs. an estimate of 84.5 million) — a major driver of price support in Chicago, even considering that part of these recorded volumes may carry over to the next season at the turn of the marketing year.
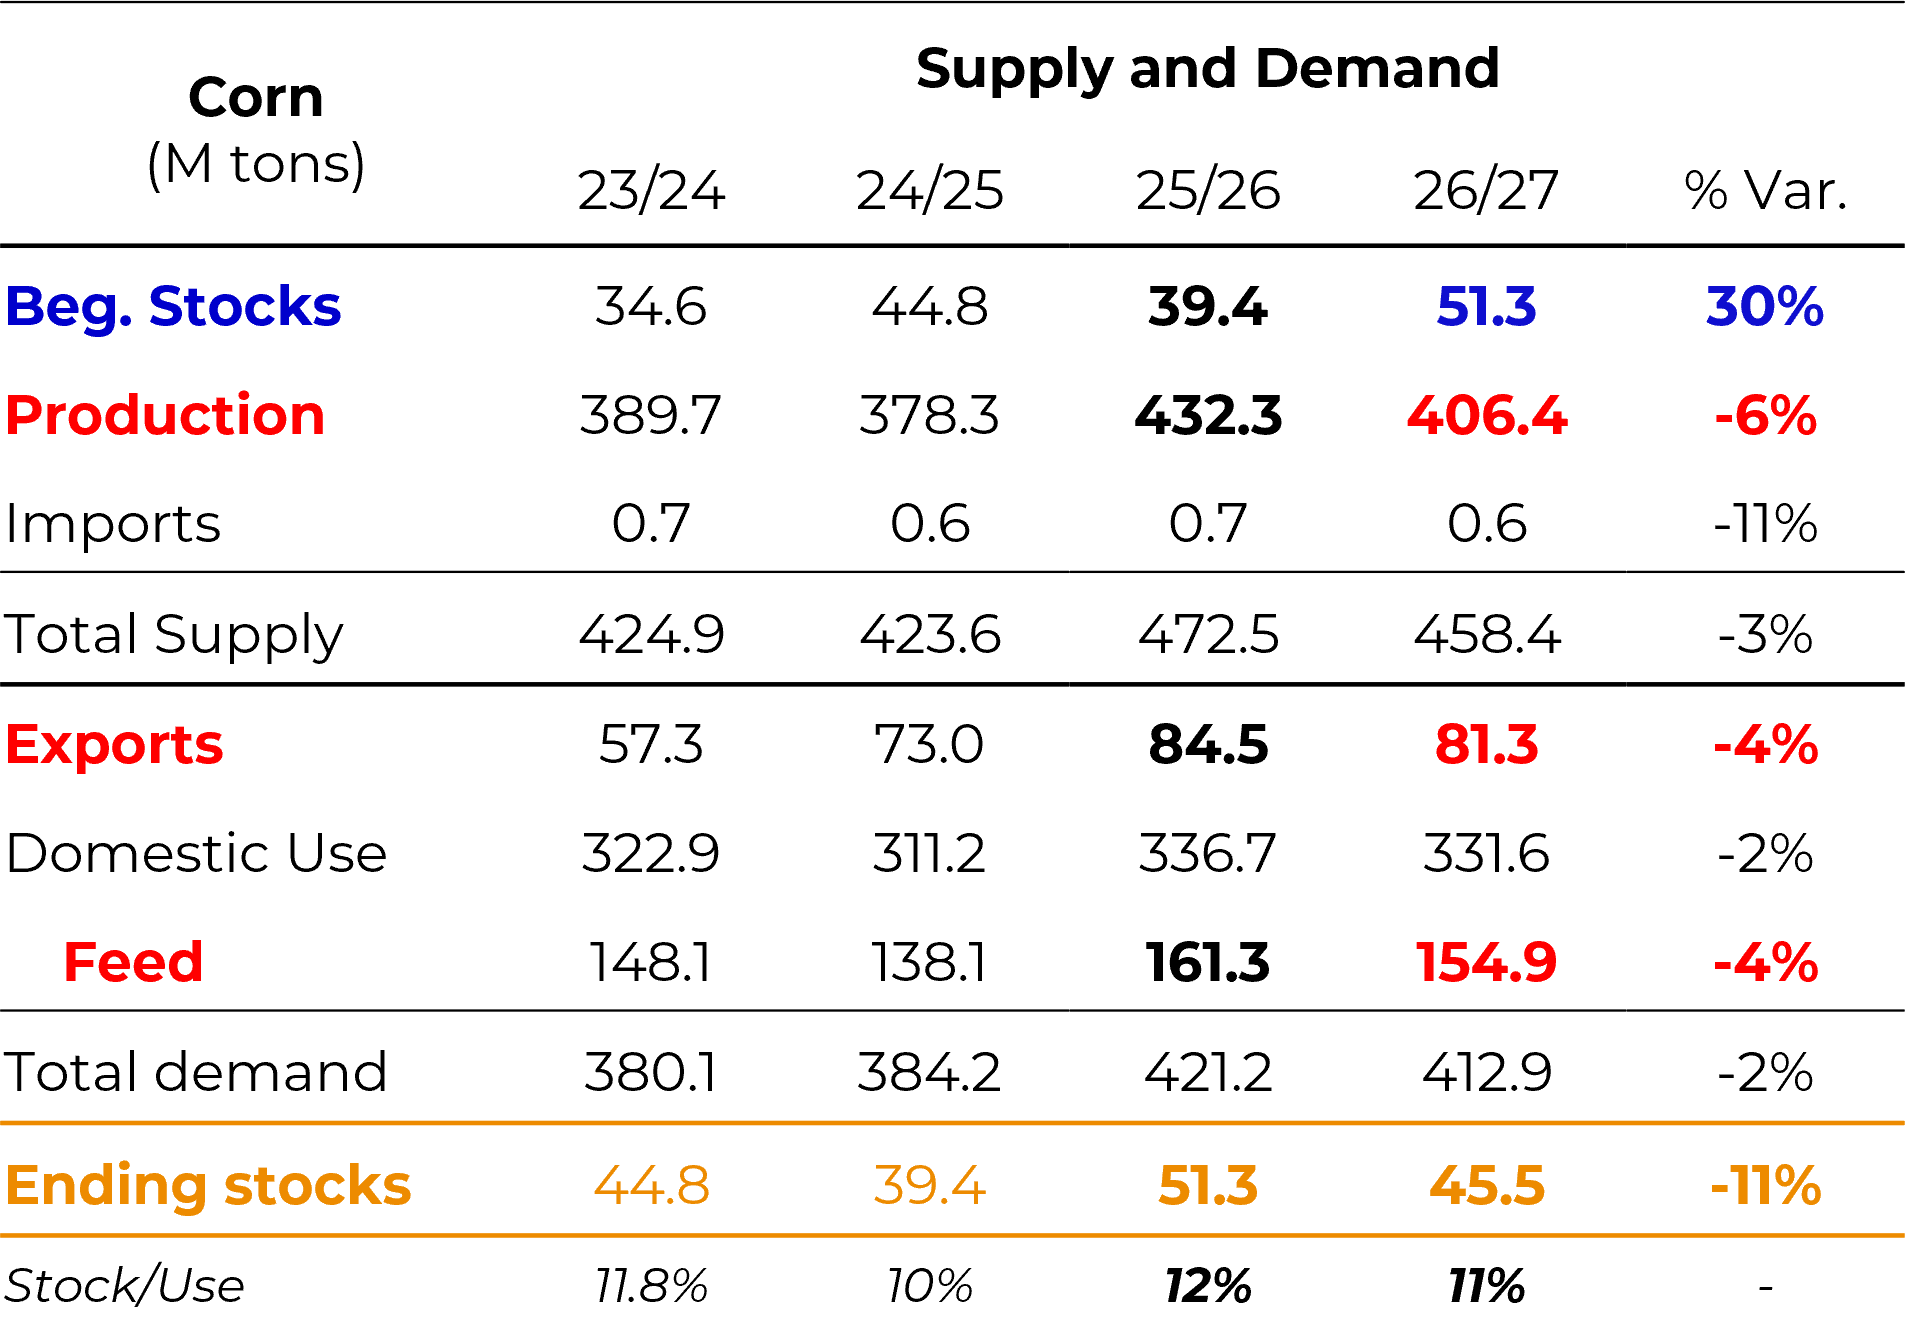
• Projected stock-to-use ratio at 11% — according to Hedgepoint’s regression model, a corn price of around $4.50/bushel is in equilibrium for this stock level.
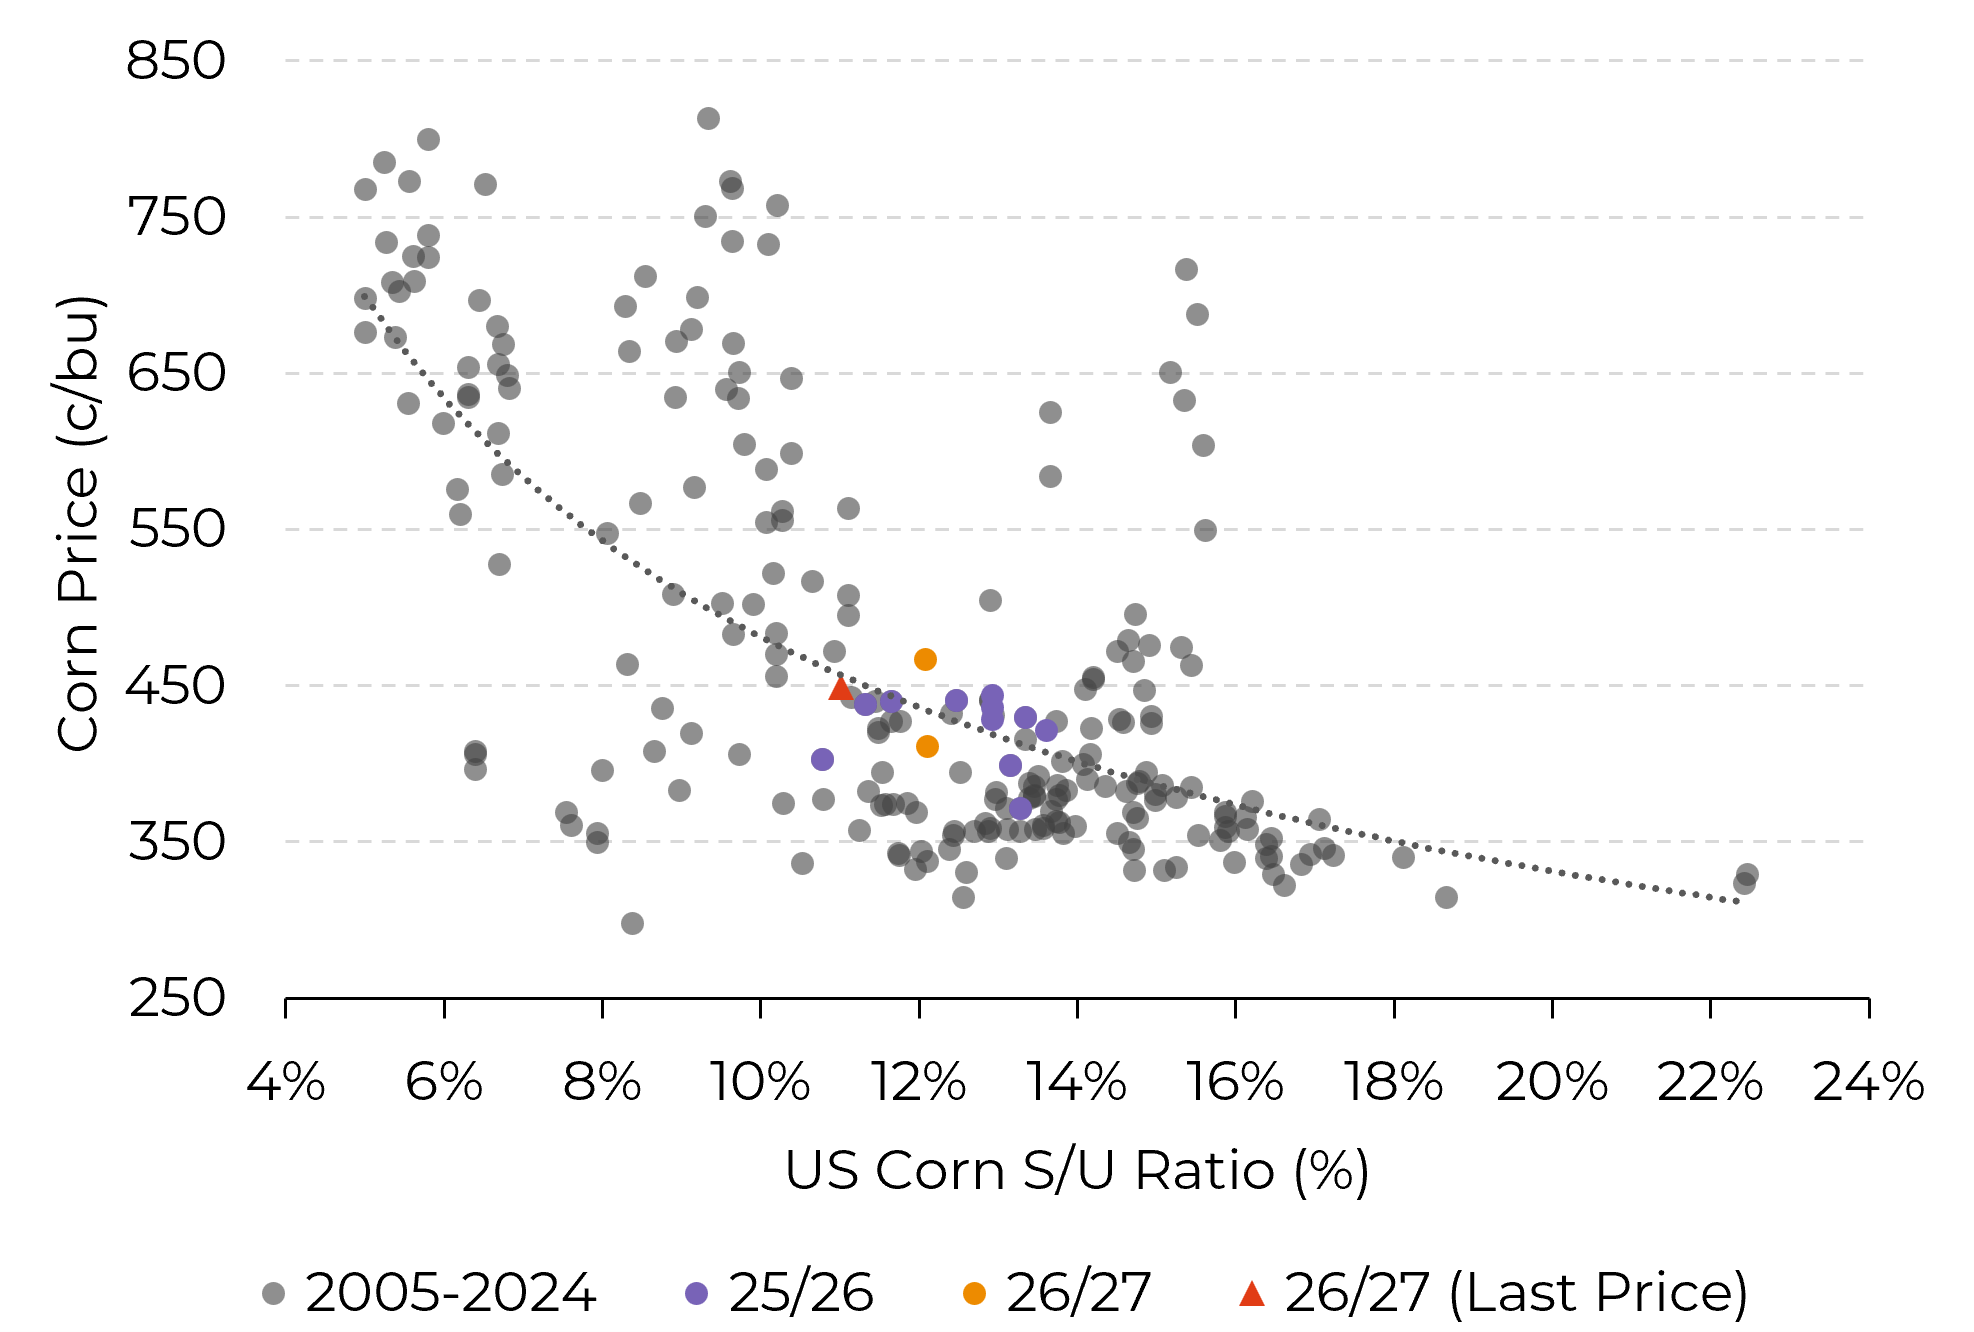
Source: USDA, CME, Hedgepoint
• Funds: have recently reduced their net short positions, reflecting strong demand; current positioning is close to the 5-year average, though still well above the level recorded during the same period last year.
• Hedgepoint estimates the 25/26 crop at ~140 million metric tons (USDA: 138 million) — Hedgepoint expects a positive upward revision in August, as the off-season crop exceeded expectations in several states, despite problems in Goiás.
• Exports: strong pace compared to last year (~1 million metric tons ahead of last year’s figures), but with significant risk related to Iran, the largest buyer of Brazilian corn in 2025 (~9 million metric tons). With the closure of the Strait of Hormuz, exports to Iran have already fallen 36% so far in 2026 (1.5 million metric tons vs. 2.3 million metric tons in the same period last year) — a critical point of attention for the second half of the year.
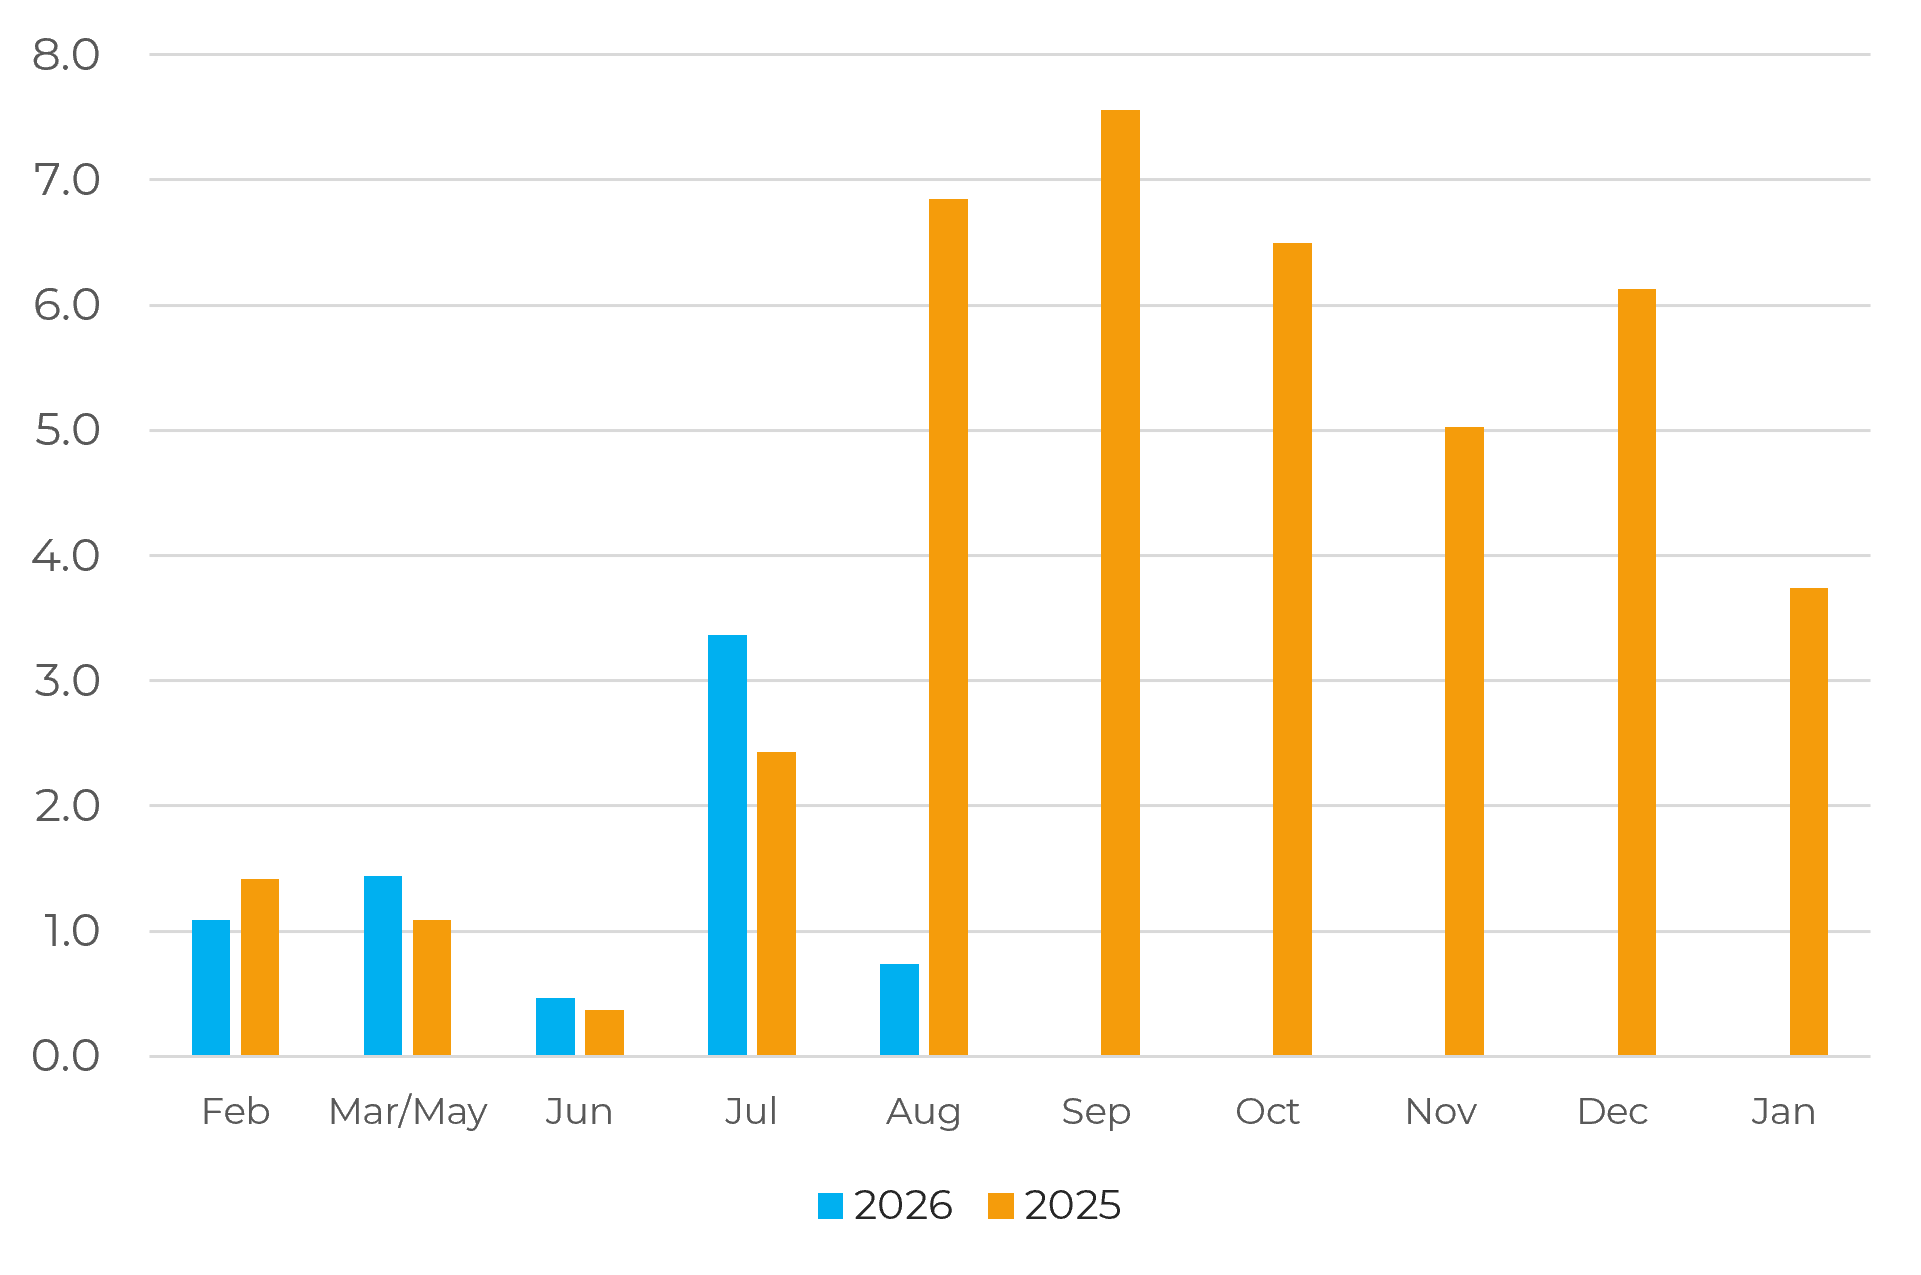
Source: Secex, Maritime Agencies, Hedgepoint
• Corn for ethanol: already at 28.5 million metric tons (+5.5 million vs. the previous year); with the possible definitive confirmation of E32 (currently approved for 180 days), additional demand could reach ~1.5 million metric tons (or ~700,000 metric tons if E32 lasts only 180 days). The number of corn-based ethanol plants in operation has already risen from 27 to 29, with another 27 planned or under construction — a sign of strong structural growth in domestic demand, expanding beyond the Midwest.
• Second-crop harvest: the harvest is behind schedule in the Center-South — an expected delay (due to late planting), but with no signs of major national supply issues, although isolated regional challenges may arise.
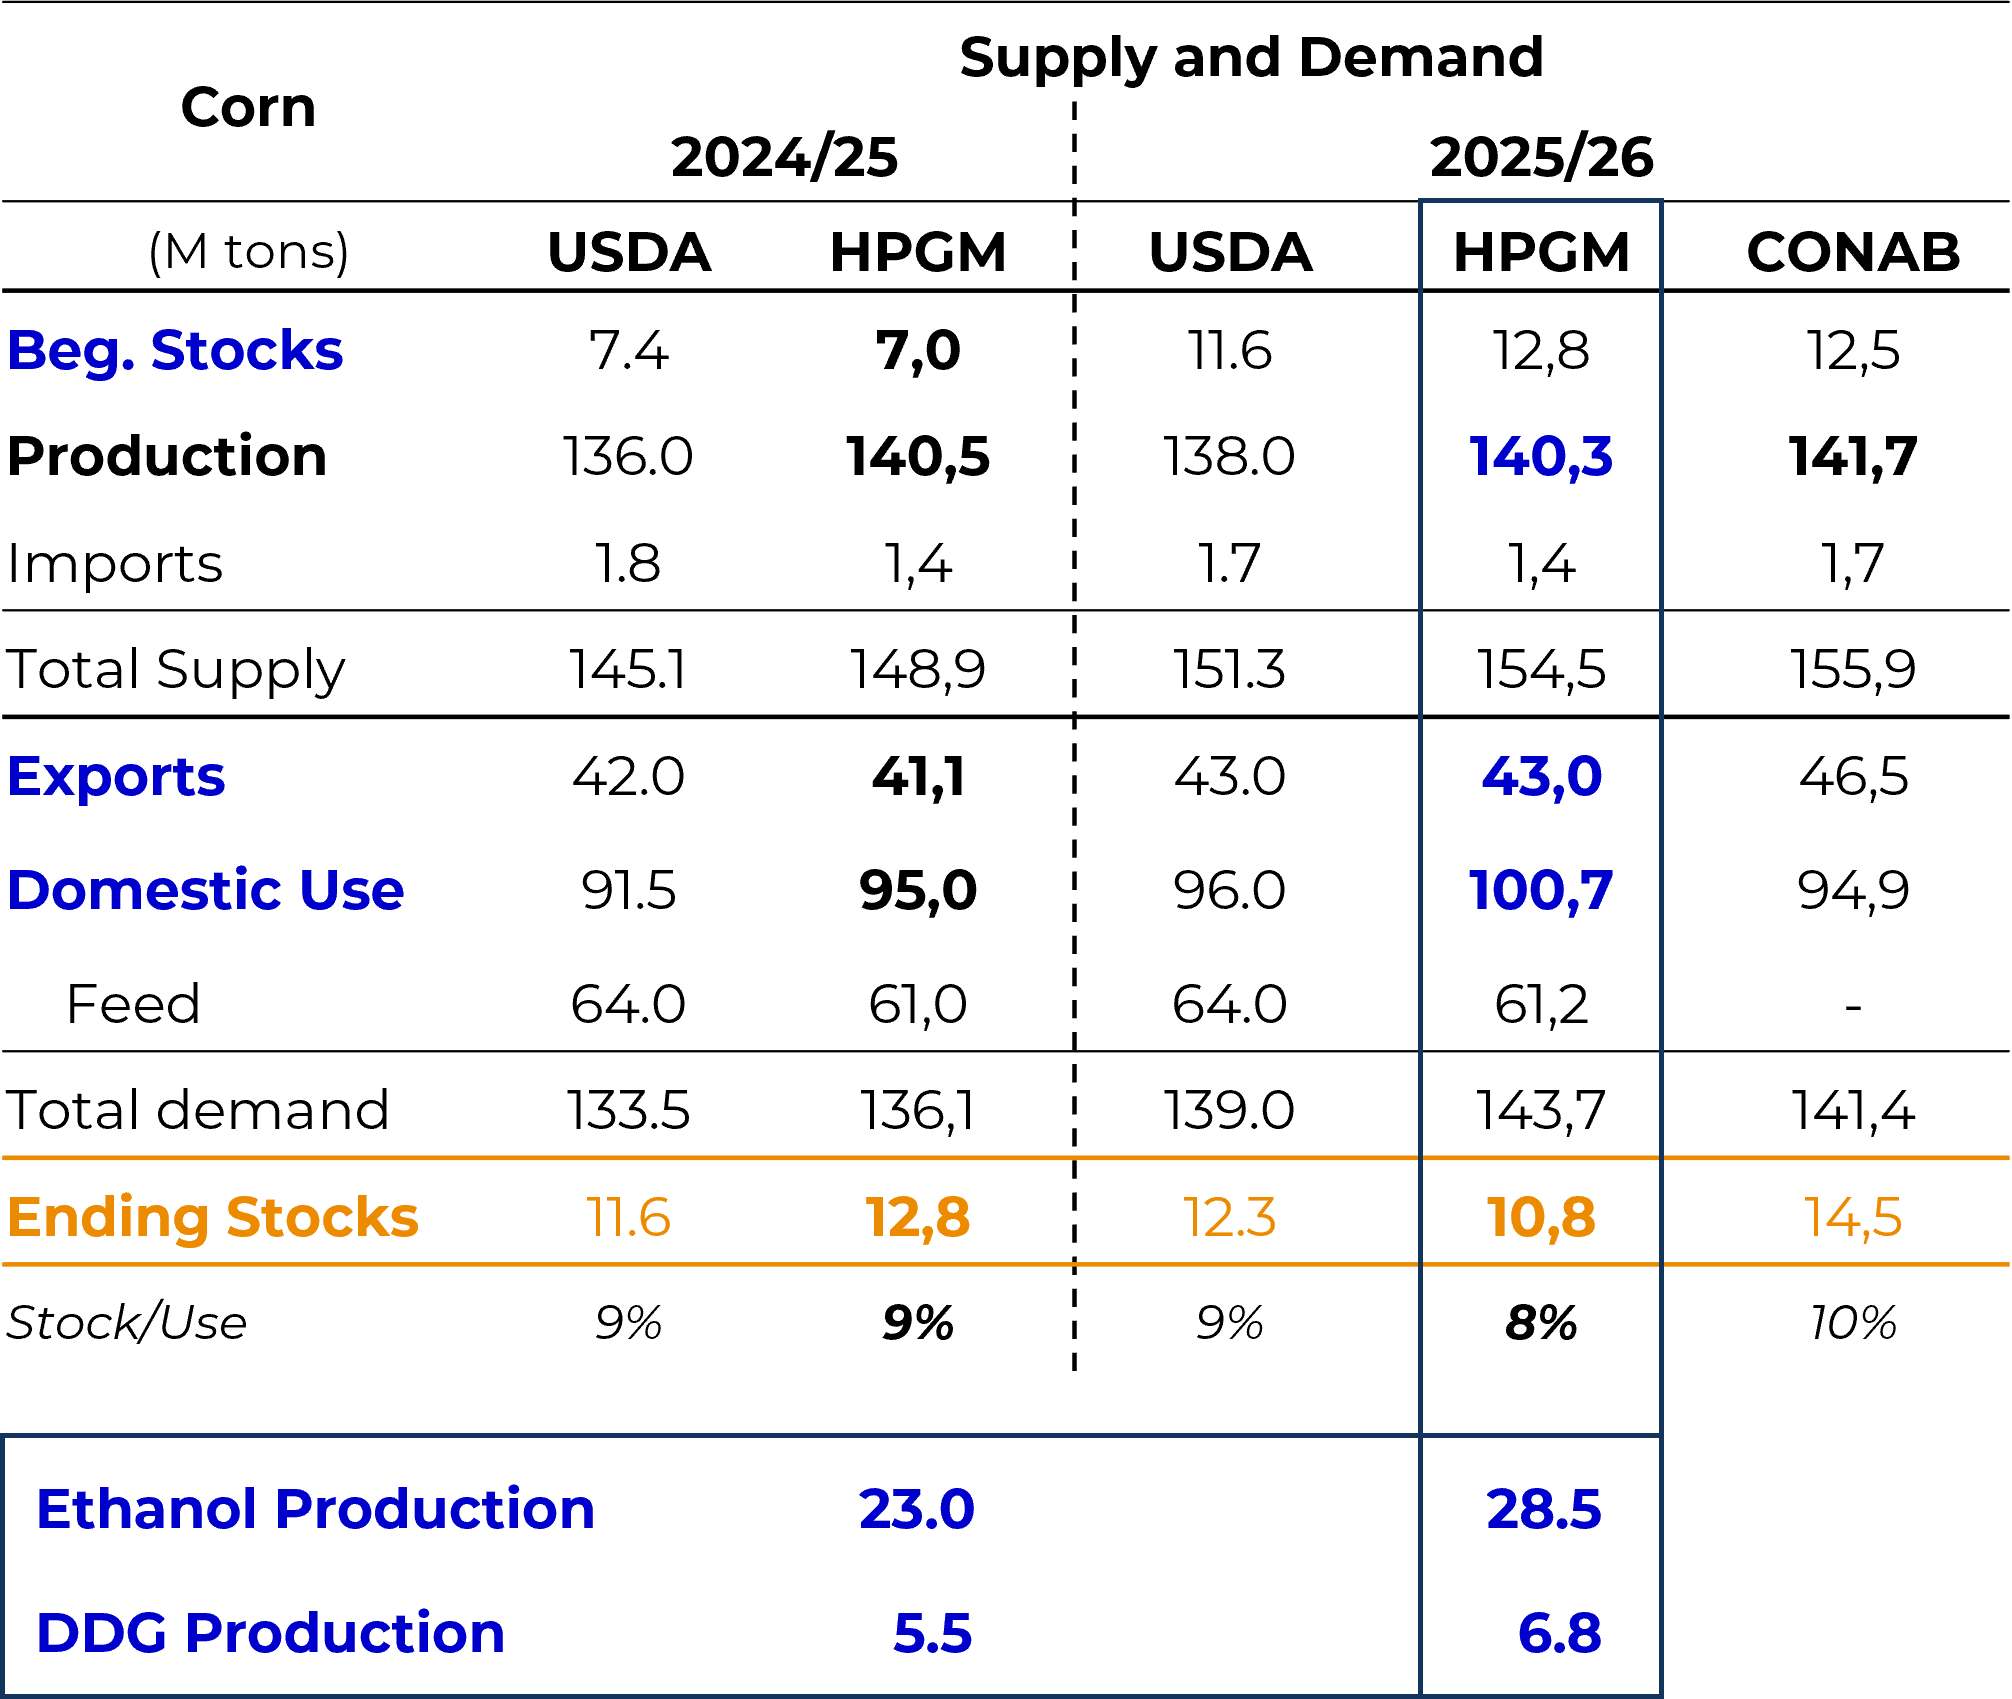
Source: USDA, Conab, Hedgepoint
• Export basis is gaining some strength with the arrival of the second crop, providing some relief to domestic prices, but this depends on the pace of exports remaining strong.
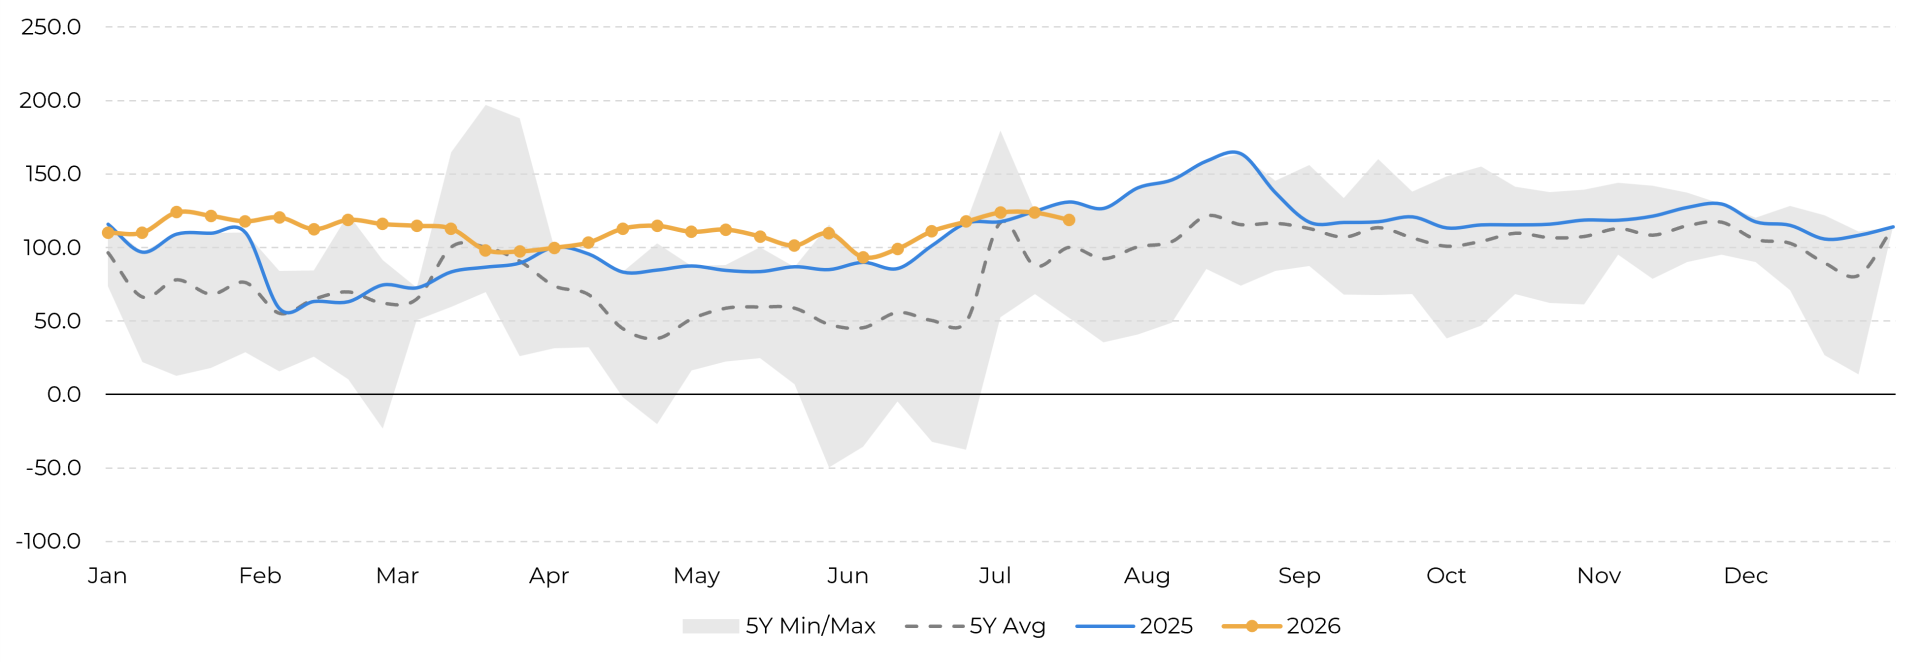
Source: CME, Esalq, Hedgepoint
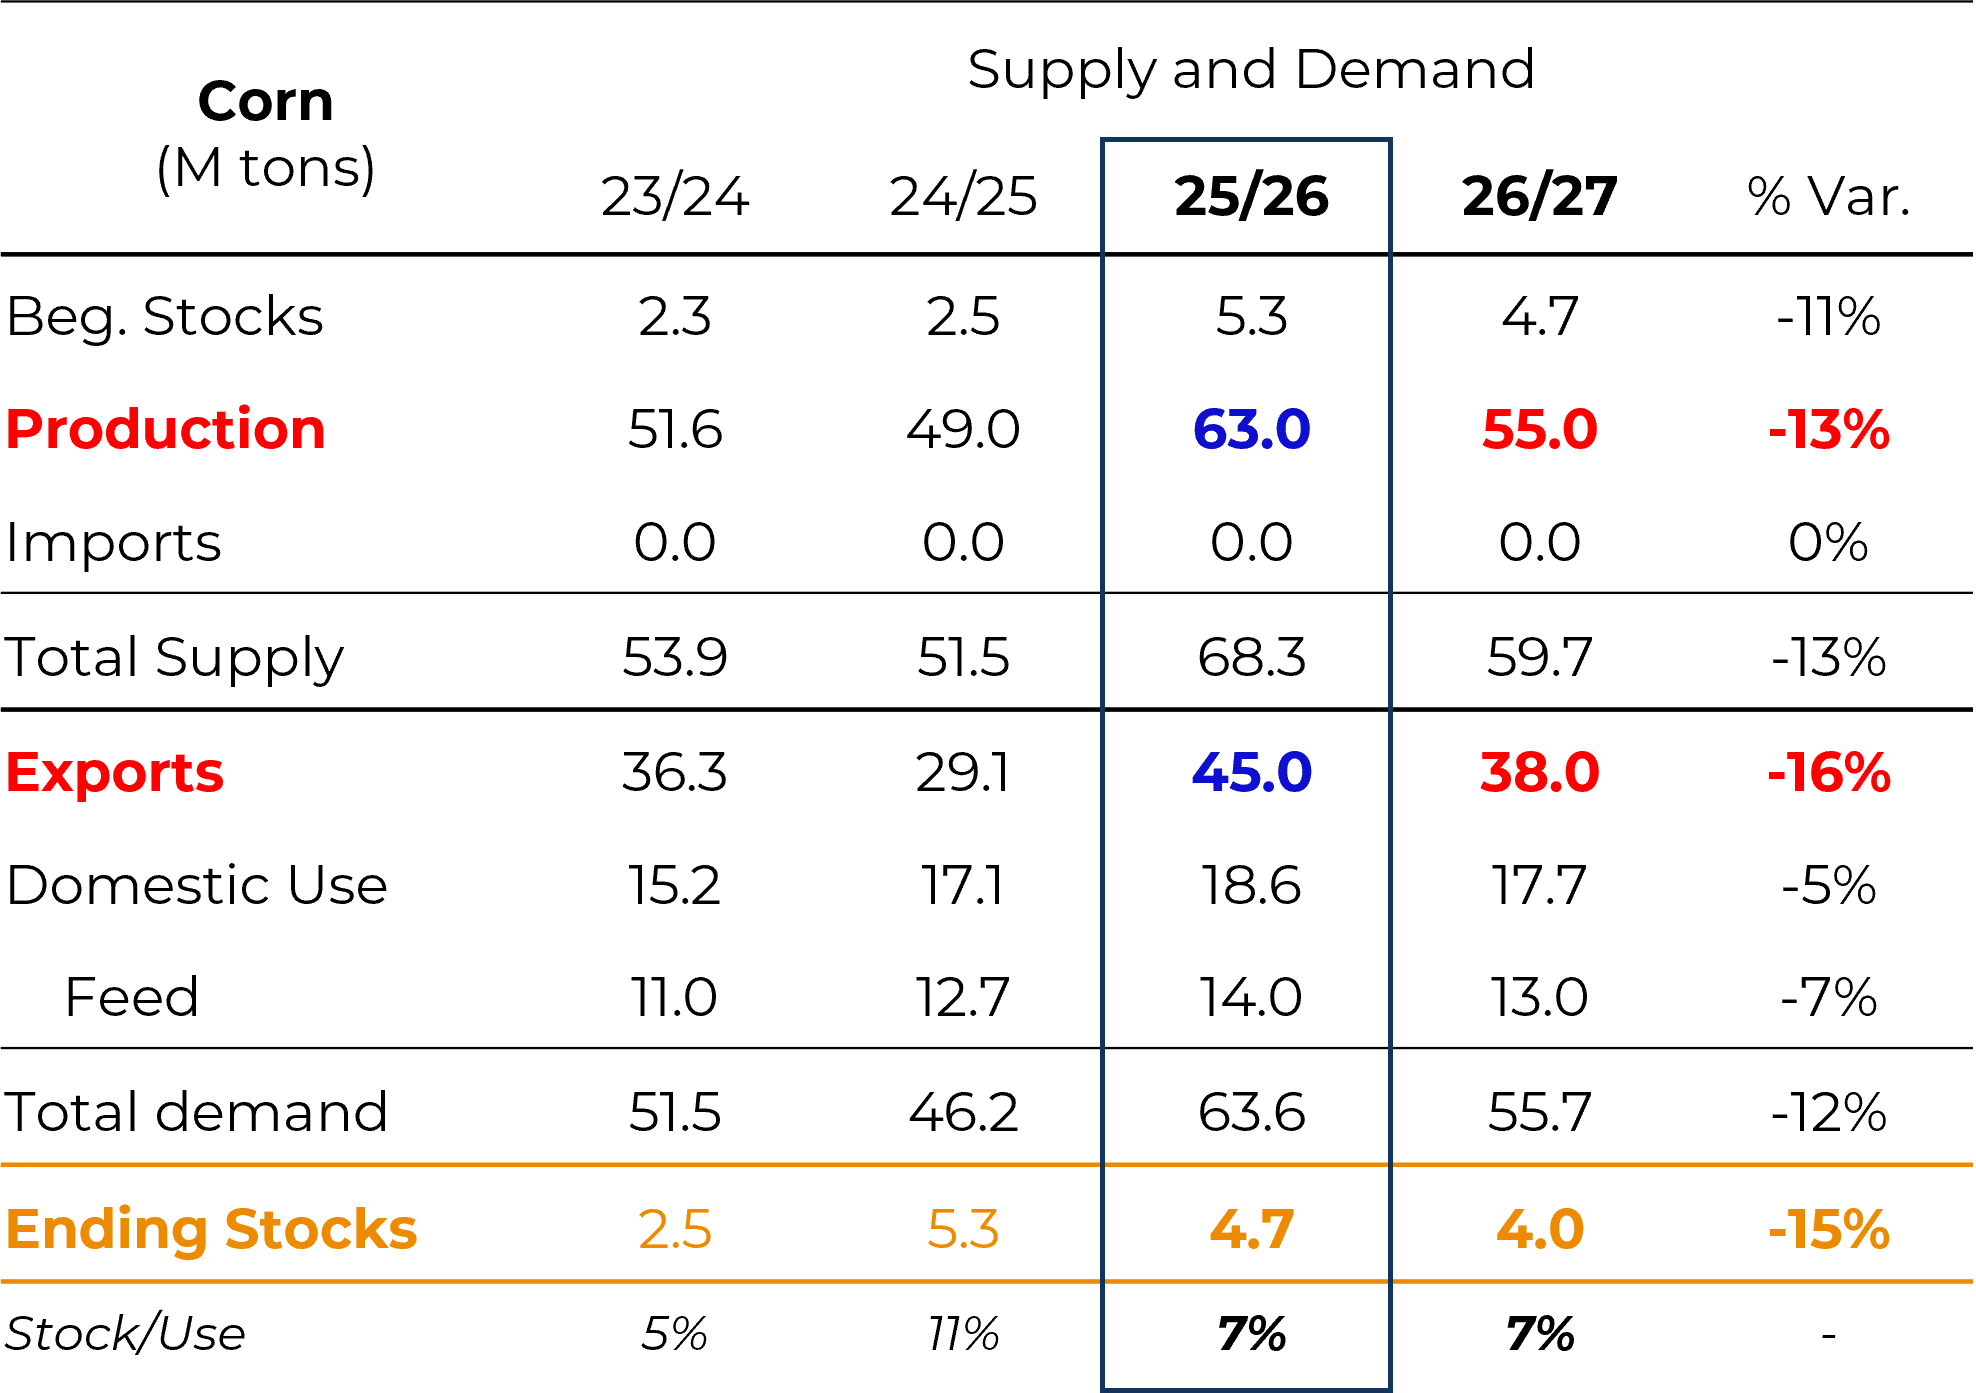
• Argentina: For 25/26, USDA estimates production at 63 million metric tons (Rosario Stock Exchange: 68 million) — still with room for an upward revision. Projected exports are set to jump from 29 (24/25) to 45 million metric tons (25/26), which could surpass Brazilian exports (43 million metric tons, with a downward trend) and make Argentina a significant competitor to Brazil in the international market. Margins for Argentine producers have improved, encouraging a faster pace of sales — monthly exports for March, April, and May have already surpassed those of previous years.
• European Union: Strong deterioration in the French corn crop — only 41% of fields are in good/excellent condition and 31% are in poor/very poor condition (a marked decline in recent weeks). The USDA is expected to continue cutting corn production estimates and raising import projections in upcoming reports (starting in August), which could benefit corn exports from Brazil, Argentina, the U.S., and Ukraine.
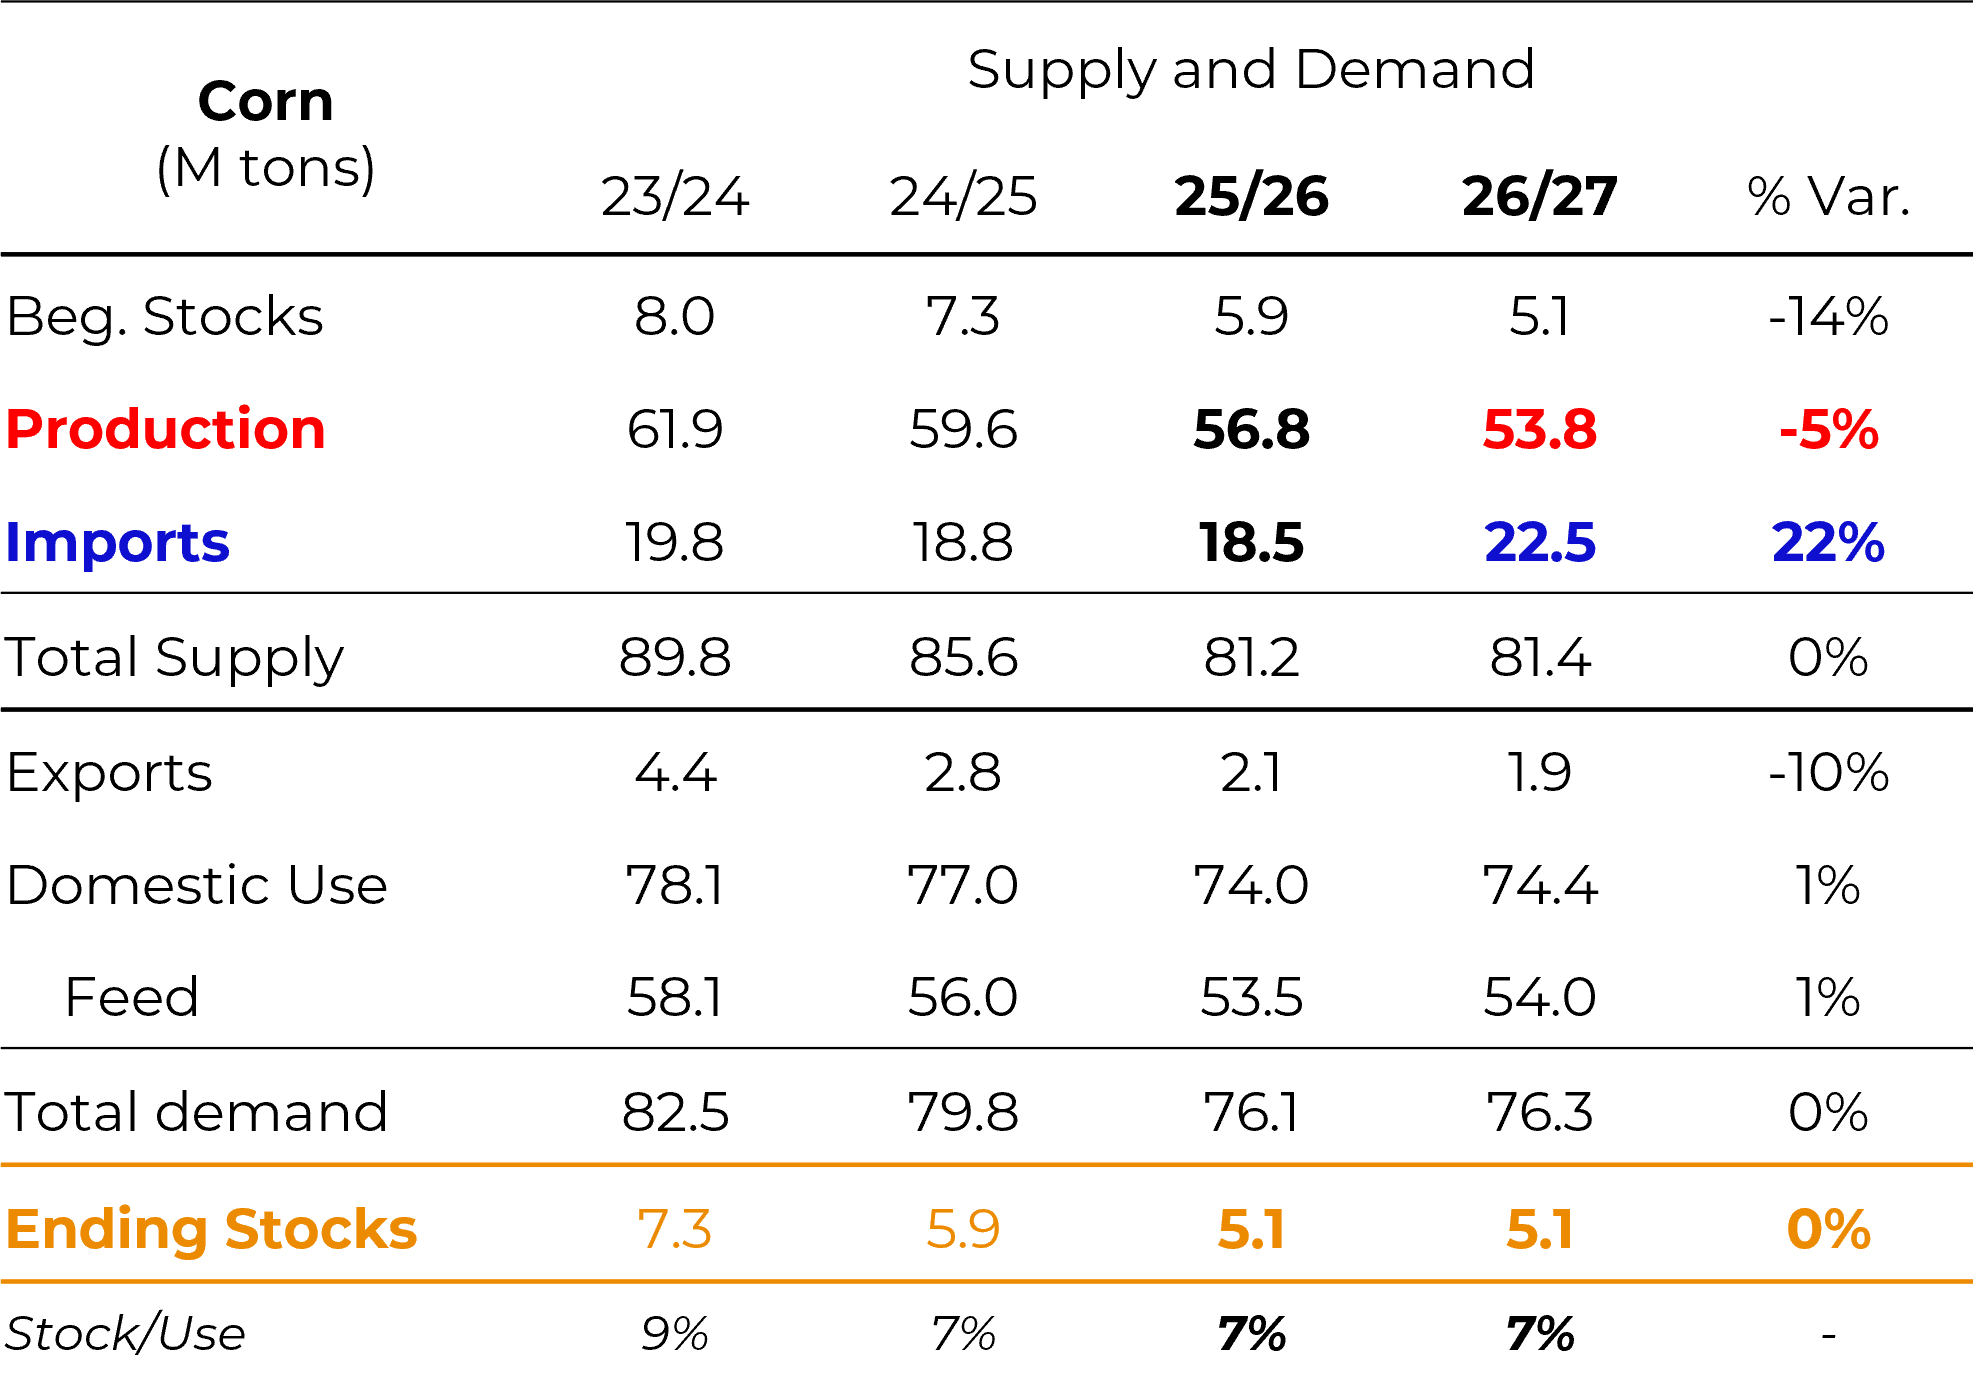
• Strong demand for U.S. corn exports.
• Increased biofuel blending in the U.S., boosting soybean crush.
• Resumption of Chinese purchases of U.S. soybeans.
• Reduction in U.S. corn acreage/corn production in 26/27.
• Weather market (could turn bearish depending on how August unfolds).
• Global soybean stocks remain ample.
• A possible end to the war in the Middle East, which could lead funds to take profits (soybean oil is tighter than soybeans and soybean meal).
• Increase in U.S. soybean acreage, with the potential for a record crop.
• Weather market (may turn bullish depending on developments in August).
The global market for corn and the soybean complex continues to strike a delicate balance between short-term bearish fundamentals and structural factors that tend to provide greater support for prices in the medium and long term. The prospect of large crops among the world’s leading producers, combined with continued comfortable stock levels and a more cautious stance on Chinese demand, keeps pressure on prices and intensifies competition among major exporters.
At the same time, a gradual shift in consumption dynamics is underway. The expansion of biofuels, the growth in soybean crushing, and the rise of corn-based ethanol in Brazil continue to strengthen industrial demand and reduce the likelihood of prolonged cycles of oversupply. This trend creates more solid fundamentals for the market and tends to raise the structural floor for prices over time.
On the macro front, the conflict in the Middle East and global inflation are keeping volatility high. On the weather front, the coming weeks will be decisive for the consolidation of U.S. soybean and corn production, while the confirmed El Niño is the key factor to monitor starting in September, with the potential to repeat the pattern of losses in north-central Brazil seen in 2023/24 (but to bring gains for production in Argentina and southern Brazil). For soybeans, a potential record crop in the U.S. coexists with tighter stocks due to increased crushing and a resurgence in Chinese demand, while Brazil is approaching a period of lower relative competitiveness. For corn, the key factors are Argentina’s growing export strength and the geopolitical risk surrounding Brazilian sales to Iran, alongside the structural expansion of corn-based ethanol as a new pillar of domestic demand.
Thus, this is a time for caution and the need for constant monitoring of these factors — including both weather conditions and supply and demand—since several key figures (U.S. crops, Brazilian exports, and Argentine crops and exports) remain uncertain and could shift market balances in the coming months.
To watch the full July's Live with Experts on the Corn and Soy Complex markets,
click on this link.