
Recession Risk 2023
Recession Risk
What to expect in commodity markets
Thais Italiani – Market Intelligence Manager
It all begins with the Macroeconomics context
What to expect in commodity markets
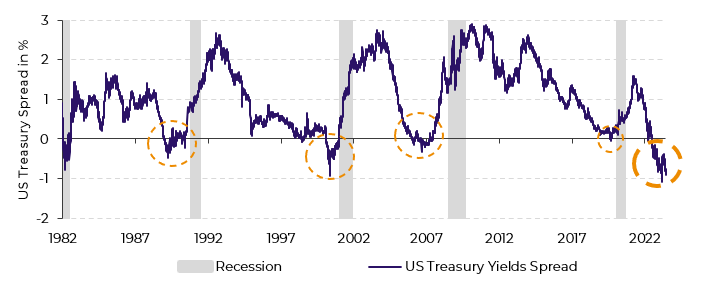
US Treasury Spread 10 and 2-year
Source: Source: Refinitiv, hEDGEpoint Global Markets
US Treasury Spread 10 and 2-year
Source: Refinitiv, hEDGEpoint Global Markets
Lívea Coda – Market Intelligence Coordinator
Macro
US 10Y-2Y Yield Spread (%)
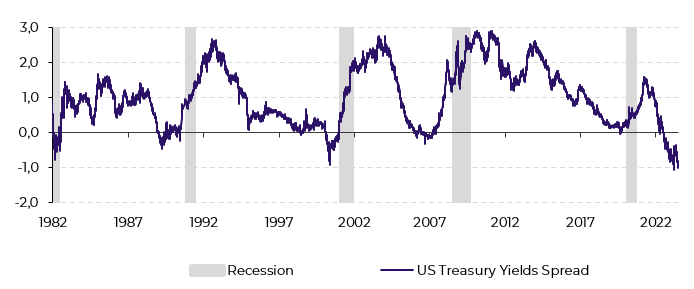
Source: Refinitiv
US Years Bond Yield (%)
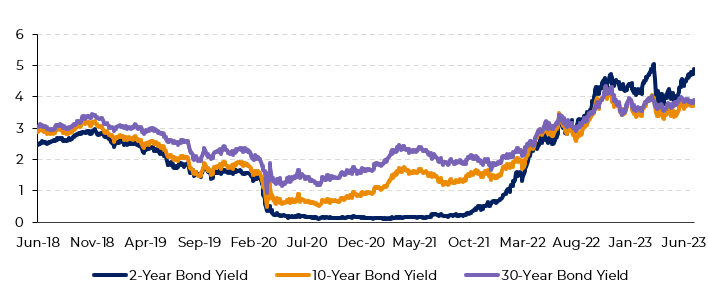
Source: Refinitiv
CPI US vs Fed Funds Rate (%)
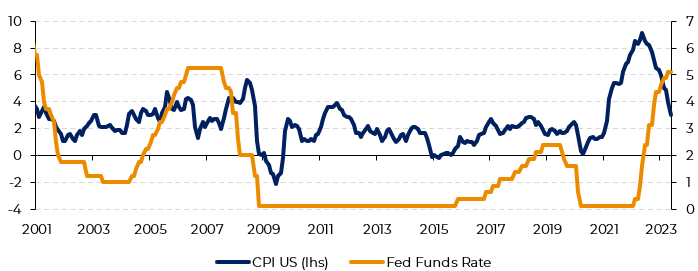
Source: Refinitiv
Dot Plot Fed Funds Rate Expectation
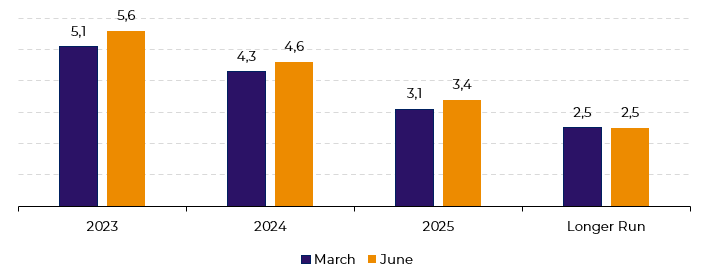
Source: Federal Reserve
If this scenario materializes,
the gap between long-term and short-term government rates should become even
more pronounced, increasing the already significant chances of a downturn in
the near future. Technically a recession is characterized by two consecutive
quarters of negative real GDP. Consequently, commodities that have their demand
influenced by economic growth, will be affected by an eventual recession. Therefore,
the current macro framework points out to a bearish scenario for the
commodities sector.
Although the United States is
not yet in a technical recession, the economy continues to show signs of
deceleration. Other data shows that the demand for capital goods is shrinking. That
pessimistic trend is not restricted to the US, with other countries also
showing signs of deceleration. For instance, China, an important driver of
global trade, has disappointed analysts with its economic data and insufficient
stimulus programs. As a result, many have already revised the country's growth
expectation down from previously anticipated.
Considering
the complete macroeconomic conjuncture, with not only the US and China, but
other countries struggling to fight inflation, the possibility of a recession
seems even more likely. The New York Fed, one of the banks of the Federal
Reserve, projected US recession probability 12 months ahead at 70.85%. However,
there are also fundamentals showing that it can be a mild one. In the US, for
instance, despite the recent initial jobless claims move and the Fed’s monetary
tightening, the unemployment rate remains at pre-pandemic levels, and financial
conditions have been easing since September.
Therefore, although a recession might seem inevitable, it might not be as problematic as past ones. Of course, the possibility of a downturn in global economy drives the commodity market to an alert mode. However, being mild, prices will tend to follow their own market fundamentals.
Alef Dias and Victor Arduin – Macroeconomics Analysts
Sugar
Before analysing sugar behaviour during each recession, it is important
to highlight that its consumption growth is rather stable, therefore, changes
to supply tend to add more volatility to its prices when talking fundamentals.
The first recession to be discussed happened over 40 years ago, during
crops 81/82 and 82/83. Both seasons were marked by output excess (6.9Mt and
5.6Mt respectively), meaning that there was no fundamental that could prevent
the risk-off sentiment from getting the best out of sugar, and its prices
dropped 71%, from approximately 37 Usc/lb to 10.5USc/lb. Besides that, the
crises had their kickstart with the 1979 energy crisis and were boosted by the
“stop-go” policy used during that period. By believing that they could reduce
unemployment through higher inflation, FED drove the economy to an unstable
situation and, when the monetary tightness was adopted, the recession thrived.
Soon, the crisis spread, and emerging countries such as Mexico suffered the
most. Among them, are many sugar producers.
Going to the second occurrence, in the nineties, not only the sugar surplus wasn't as guaranteed (2.6Mt), but the recession wasn’t as long and as deep as the past one. Therefore, sugar prices were affected, but less than previously – dropping only 8%. Associated with geopolitical uncertainty – Gulf War – the world saw a sharp increase in oil prices. Financial market weakness inherited from the 80’s didn’t help, and several western countries faced difficulties, especially in North America and Europe.
Raw Sugar vs. US Treasury Yields Spread
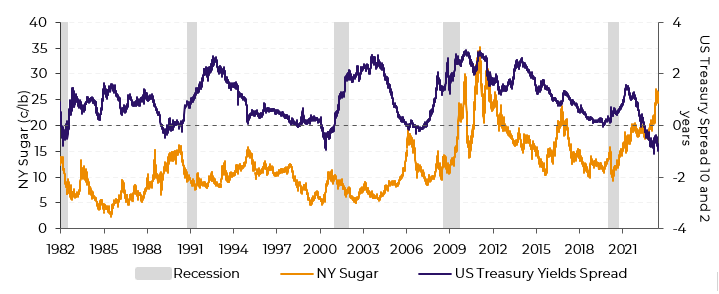
Source: ICE, Refinitiv
At the beginning of the 2000’s, the world faced another crisis known as the “dotcom bubble”. After a decade long bull market with low inflation and unemployment rate, market started to correct. The recession impacted mostly industrialized countries and wasn’t as relevant as the past two. However, during its peak (2002), the sugar market was in a bear momentum: around 4.2Mt surplus. Prices were already low dropped from 6.8 USc/lb to 5 USc/lb, a 25% correction. Following that, market entered a bullish trend reaching 10.85 USc/lb by the 05/06 crop end, having reached 19 USc/lb in early 2006 led by three consecutive deficits.
Global Sugar Balance (MT RV)
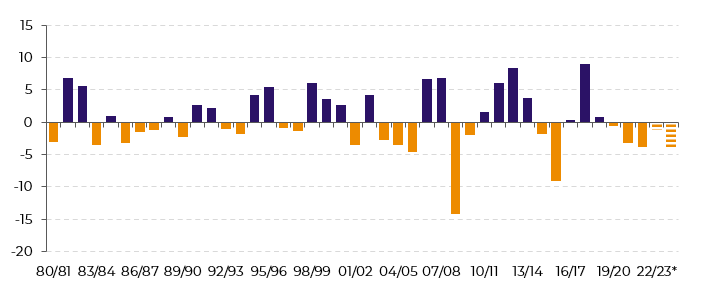
Source: USDA, Green Pool, hEDGEpoint *Projection
The great recession came a year later when, yet in 2007, US economy
started to show economic activity decline – especially its housing market. The
period between 2007 and 2009 is considered the most significant recession since
the Great Depression in the 30’s. During this period, weather wasn’t much help
as it slowed down the Brazilian harvest and disrupted Central America and US’s
cane total output. Also, during that crop year, India shifted from being an
exporter to an importer, pressuring origins stocks. Therefore, although macro
wasn’t supportive, prices rose 90% during the recession, from 13.7 USc/lb to
26.2 USc/lb having touched the 30 USc/lb mark.
Last but not least, in 2021 global economy faced the Covid-19 recession. Although short-lived, it was a year of an economic slowdown: timid growth and low consumer activity driven by lockdowns. During that period, Brazil faced its most recent sugar crop break. Not only was sugar cane already penalized by the lack of rains, but it was also hit by frosts and fires, resultant of La Niña’s occurrence. This led to a drop in both sucrose content and agricultural yield. The latter was the most affected since mills had to change logistics and anticipate crushing – not giving cane, which was already suffering from 20/21’s dryness, further time to develop. Center-South’s 21/22 crop year saw cane volume dropping from 605Mt to 523Mt – nearly a 14% break. Thus, sugar found support in fundamentals, and although macro drove a bearish trend, the sweetener’s prices rose around 8%, ending 2021 at nearly 19 USc/lb.
It becomes clear that fundamentals are a big part of the price equation.
Even at the worst recent recession, the sweetener found support in market
tightness – of course that amid high volatility. Therefore, one could expect
that, if a new economic slowdown proves to be true, current bullish market can
still find support in sugar’s output gap.
Going forward, if a new economic slowdown is on the verge of happening, one should keep the sweetener's fundamentals up to date: 23/24 is expected to be a deficit, the fifth in a row. The main reason behind it is the Northern Hemisphere crop deterioration. Weather, area competition, political decisions, and tighter stocks could prevent a recovery in key sugar producers, such as Thailand, India, and Europe. While we expect a possible weather improvement as the main bearish risk, the consensus points out availability tightening, adding a limit to possible losses. However, it is extremely important to prepare for greater volatility and, in this context, risk management becomes essential.
Lívea Coda – Market Intelligence Coordinator and Sugar Expert
Coffee
Spreads are inverted in the front-month contracts (July, September, and
December 2023), as the 22/23 cycle is still tight in terms of global balance
(-4.8M bags). However, the 24/25 Brazilian crop currently has the potential to
be a bumper crop, for both arabica and robusta/conilon. The former relies on
lower productive stress, and the latter, area expansion with lower densities,
allowing for higher yields.
Coffee prices started to consolidate as the Brazilian 23/24 harvest
became available. Not only that but the development of the 23/24 crop in
Centrals and Colombia improved, leading arabica to possible short-selling spec
moves, especially given the current macroeconomic scenario: not-so-supportive
for riskier assets.
The spread between 10-year and 2-year US Treasuries signals a recession coming up when it enters the negative range. The periods highlighted in grey are periods of recession, which followed these reversals. In the last five recessions, from 1980 to 2020, coffee fell, in these periods, respectively: 32%, 8%, 33%, 6%, and 12%, with an average drop of 13% during the recession periods.
NY Arabica vs. US Treasury Yields Spread
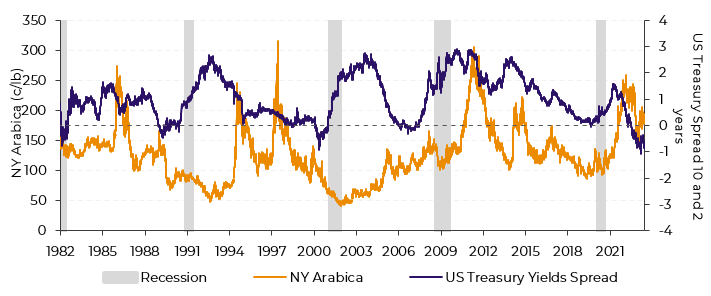
Source: ICE, Refinitiv
To understand how the current 22/23 and 23/24 global deficits may
counterbalance the current bearish perspective on the macroeconomic side, let’s
take a look at how prices behaved in the last three recession windows. In the
recession that took place in the early 2000’s, the global coffee balance went
from three consecutive years of production growth to a deficit in 03/04, led by
a crop failure in Brazil driven by drought. With this, prices entered a 4-year
downtrend, recovering only upon the expectation of a crop failure in the main
producing country.
In the late 2010’s, the global coffee balance went from a 07/08 -4.2M
bags deficit to +11.3M in 08/09, which, alongside the risk-off mode from the
recession, knocked down prices. More recently, in 2020, prices fell briefly by
12%, later rising to a 10-year high, at 258 c/lb, failing to break the 260 c/lb
ceiling.
Currently, despite the fact that global supply is failing to go back to 2020’s and 2018’s levels – we expect production to recover to 169.21M bags in 23/24, below the 180.33M bags and 176.93M bags reported in 20/21 and 18/19, respectively, the previous two on-years for arabica in Brazil – the sheer potential of the next on-year Brazilian crop in has shifted the spread structure into 2024.
Consequently, the likelihood of a global recession weighs similarly as
it did in the late 2010’s, when the balance moved from a deficit to a surplus.
It’s important to note that an El Niño phenomenon is expected to become active
this year, and, historically, it led to a 5% decrease in arabica output and 10%
in robusta output in Brazil. Therefore, there is a bullish risk within the
period that the phenomenon becomes active, depending, of course, on its
extension and intensity – as a mild occurrence would imprint less effect on a
crop that carries lower productive stress from the past two crop failures.
Weather, therefore, plays an important role in coffee fundamentals going forward, being key to understanding the extension that an economic recession could have on its prices. If the weather collaborates, then we can expect the economic slowdown to have its impact, although it might not be as hurtful as it once was. We should prepare for higher volatility going forward, making it essential to choose the best financial structures to manage risks.
Natália Gandolphi – Coffee Analyst
Soybeans and Corn
As for many other commodities, the analysis of how recessions affect
grains involves looking at how were the supply and demand balances at the time
and if anything changed with its arrival. As grains, in general, are associated
with staple food, we intuitively see them as more shielded from economic
downturns than other products, especially non-agricultural ones. Still, over
the last decades, with the expansion of their usage in biofuel production, some
lines of the balance became more subject to economic growth – or its absence.
In terms of balance, taking US corn as an example, supply shifts account for most of the fluctuation in demand, as shown in the figure below. The supply-based model is a regression model that aims to estimate how much should demand grow given the supply constraints. It indicates that consumption tends to adjust to the amount of product available within a given cycle with prices working as the feedback signal to the market. When production falls, prices surge, and demand slows down.
US Corn Domestic Demand Actual Change vs Supply-Based Model (% YoY)
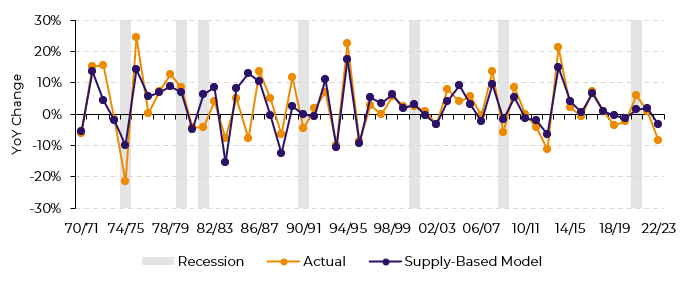
Source: USDA
In recession years, consumption year-on-year change was, on average, 3.6 p.p. smaller than what the supply-based model alone would indicate. This suggests that recessions indeed have an impact, while not major. For soybeans, the impact of recessions was on average close to neutral, although with a lot of variability from one year to the other.
For this reason, it is important to mention two caveats. One is that not
only the presence and intensity of the recession are relevant, but also its
reason and fundamentals in the period. Sticking with corn, in 74/75, when
actual demand diverged the most from what supplies suggest, the US market was
already coming from a tight cycle and the crop failure in the country also
coincided with smaller production worldwide.
Without many other exporters to compete, this scenario kept
international demand (and prices) for US corn high. In turn, this harmed
domestic demand, especially for feed. Some will even remember the (in)famous
large Soviet Union purchases of US corn around this period. Taking out this
single year - which was intensified by these fundamentals elsewhere -, the
effect of recession on US corn demand already diminishes from -3.6 to -2.2 p.p.
Conversely, the Covid pandemic in 2020 raised food security concerns which in
turn led to demand overshooting the “supply-driven” growth.
The second caveat is that recessions’ impact on prices can be more nuanced. Though times can scare speculative money away from risky assets like commodities. This can be very relevant over short periods, but over the long run, fundamentals tend to prevail. Using 74/75 once again, as the economy went into recession in the 2H of 74, corn prices were up 22% on the year, reflecting the poor output in the US. However, as the recession faded in the 1H of 75, the market was already starting to price a new crop in the US, which turned out to be a good one. Thus, although prices fell during the period, it is hard to argue that the poor economic condition was the only factor.
CBOT Corn and Soybean Futures versus US Treasury Spread and Recessions (USDc/bu, %)
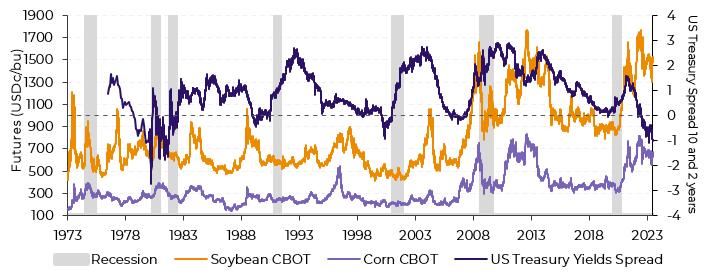
Source: CBOT, Refinitiv
Similarly, 2008 provides a good case study. Both corn and soybean prices
dived as the US entered a recession. However, the US was coming from a tight
cycle for beans, but a more comfortable one for corn. Additionally, Brazil,
which was already a big soybean exporter by this time, had a crop failure that
drove the world balance down and kept demand for US beans high. Meanwhile, the
rest of the world had a record high corn production, which limited export
demand for the US. Given this combination, as the brunt of the shock passed,
soybean prices recovered by a lot more than corn’s.
In summary, recessions do tend to hurt demand. However, it is not an
absolute factor, and especially when it comes to prices, its impact very much
depends on its interaction with fundamentals.
Globally, world supplies are not expected to be too tight in 23/24,
which limits its necessity to resort to the US, if prices surge. The country’s
crop is being decided as we write. The dryness in May and June has put fields
in a vulnerable position, but the weather has been improving in July. Even with
low corn yields, production is also expected higher, as acreage is up versus
last year. On soybeans, however, planted area is much smaller year-on-year and
crop conditions are also on the lower side.
All else equal, this combination signals that soybean prices will find support on tighter supplies, while the US corn balance should be more comfortable. With no supply constraints, a recession could have an impact on corn prices and demand. However, as of currently, US soybeans seem to be headed towards a more “supply-driven” market next year.
Pedro Schicchi – Grains and Oilseeds Analyst
Wheat
Talking about wheat, we should expect a smaller impact of recessions on its demand when compared to soybeans and corn, as biofuels are not a significant “demand-line” in wheat balances. And when we look at US’ wheat demand behaviour during past recessions, starting in the 70’s, we can confirm its stability, even though we cannot say that recession impacts are completely null.
US Wheat Domestic Demand Actual Year-on-Year Change vs Supply-Based Model (%)
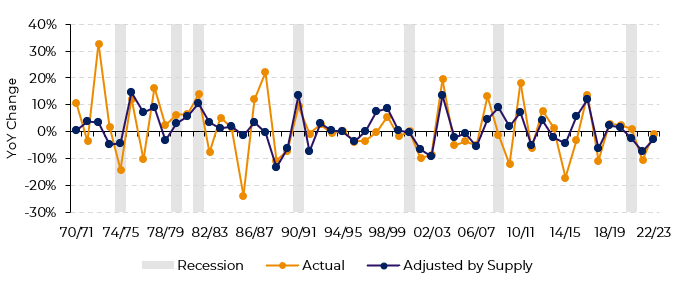
Source: USDA
As seen in the chart, demand fluctuations are highly correlated to shifts in supply, and recessions seem to amplify the moves in both directions. For instance, in the 72/73 season, demand should have fallen by only 4%, if considering only the supply reduction and its impact on prices. However, the impact was intensified by the recession, which eroded purchasing power. In the end, demand was reduced by 14% during the season. On the other hand, by 1979 and 1982, demand increased by more than the supply-based model suggested.
Looking from a “consumer economics” perspective, these moves make sense. When income is reduced, demand becomes more price elastic, so changes in prices tend to have a bigger effect on demand in recessionary periods. Given the larger supplies during the 1980 and 1981/82 recessions, wheat prices fell in both periods – so probably consumers switched demand from other food and feed products to wheat as they became more sensitive to prices.
Nonetheless, this hasn’t been the case since the ‘90s, as demand and prices moved pretty in line with supply swings, except for the last two recessions (08/09 and 2020). What can explain that?
Well, some fundamentals can explain this change. The main one is the straightforward application of a long-run price elasticity theory. As the nation grows wealthier, the demand for basic goods and foods becomes less “vulnerable” to price changes. Between 1982 and 1990 US’ per capita GDP grew by 65% while wheat prices had a negative performance of around 40% in the period.
For the 08/09 period, we got to make some considerations. Firstly, the Great Financial Crisis was preceded by the super commodity cycle generated by China's high-paced growth – which spurred the country’s demand for commodities. Most commodities were trading at all-time-highs, and wheat was no different. Secondly, it was the most severe recession since the Great Depression. Given these factors, it is understandable why the rising supplies were accompanied by severe cuts in demand on 08/09 and 09/10.
CBOT Wheat Futures versus US Treasury Spread and Recessions (USDc/bu, %)
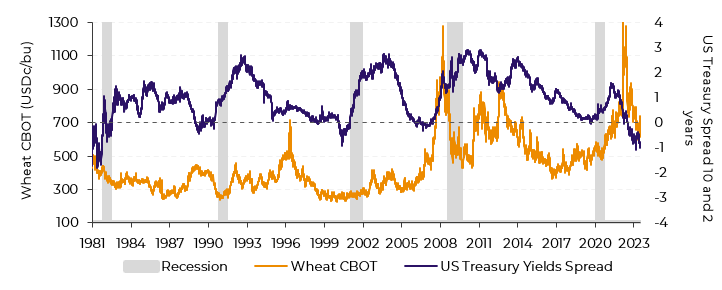
Source: CBOT, Refinitiv
For the “Covid recession”, there are also some considerations to be made to explain why demand rose 1% while supplies decreased by 3% and prices rose around 9%. It was one of the shortest recessions on record (only 2 months), as governments and central banks around the world throw huge amounts of fiscal and monetary stimulus to support economic activity.
So, given wheat's demand history during recessions, what can we expect for this year in terms of demand and prices? Well, everything points to small to null effects, as it will most likely be a mild recession, reducing the likelihood of a greater impact on demand. Also, we should consider that wheat prices have already fallen more than 40% since the Ukraine War peak. This movement seems well priced looking at the historical correlation with US’s stock/use ratio, making any further corrections as we have seen in '08 and '09 very unlikely.
Alef Dias – Wheat Analyst
Energy
The energy sector is the most correlated with world macroeconomics within the commodity complex. When countries face adversity in their economies, fossil fuels suffer a reduction in demand. Periods with substantial increases in oil prices are associated with high inflation.
In 1979, for example, the Iranian revolution caused a sudden cut in the world's oil supply. The US, which was heavily dependent on crude oil imports, saw a devaluation of its currency and a strong increase in inflation. The world fell into a recessive scenario with rising interest rates, which affected commodity prices. Therefore, it is extremely important to understand what the current macroeconomics and fundamentals are.
At that time, the inversion of the yield curve foreshadowed the difficulties that would come with the economic downturn of 1981–82, which was triggered by tight monetary policy. Similar phenomena were seen in the 1990–91 crisis, when Iraq invaded Kuwait, and the 2007–09 subprime crisis, when oil climbed to record levels in mid-2008 and then collapsed. Would these indicators be pointing in the same direction today? To understand it better, let's first recap what happened in the most recent global recession.
Volatility has well described the energy sector in recent years. Logistics and transport were severely affected during the COVID-19 crisis, leading to insufficient demand for a market whose structure is highly dependent on revenues for investments and supply expansion. An example of the chaotic scenario was the price of WTI falling almost 300%, trading at around negative US$ 37.00 per barrel on April 20. Oil demand took a hit, and, as a result, the energy complex faced a crisis. Key producers and exported saw the need to cut their production to try to balance out supply and demand.
On the other hand, policy makers decided to inject unprecedented liquidity into their economies through lower interest rates and fiscal stimulus. This helped to mitigate the effects of the pandemic on the global economy and, consequently, supported energy prices. However, as the world recovered from the pandemic crisis, demand for goods and services increased, causing inflationary pressure. When prices, in general, are higher, oil prices tend to move up. This is exactly what happened in the second half of 2020, when in 2021 the prices of Brent and WTI surpassed their pre-pandemic levels.
Crude Oil Benchmark Prices vs US 2Y Yield Treasury (%)
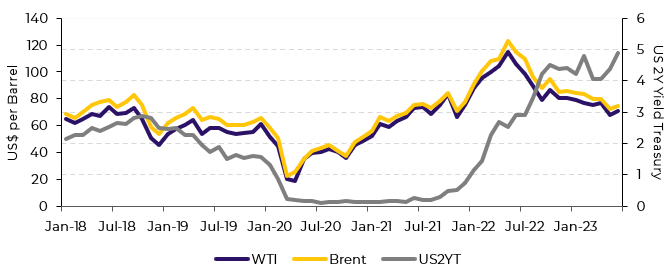
Source: Refinitiv
The reopening of the world economy and the invasion of Ukraine by Russia led oil prices to their highest level in recent years. As oil has a well-known spill-over effect, its surge added fire to the flame, strengthening the inflationary trend. As a result, the US central bank carried out one of the fastest and most intense interest rate hikes in its history, moving from a level close to zero to 5%–5.25% in 12 months, as already highlighted in the begging of this white paper. Yields on 2-year bonds rose sharply over the period, while energy commodity prices fell. With high borrowing costs, consumption, and investment are reduced. Expectations of a more adverse scenario for the world in 2023 are corroborated by the inverted yield curve, in which earnings from short-term bonds are more favourable when compared with long-term bonds. This is a warning sign for investors, especially those focused on energy, since economic growth and energy consumption are strongly correlated.
The signs of a recession, even if a small one, are reasons for the market to worry, driving prices throughout 2023. As the yield inversion curve deepens, the chances of a downturn on the horizon increase. At this point, announcements, and speeches by the monetary authorities regarding possible interest rate increases have influenced the energy market more than bullish fundamentals. The market seems to be ignoring the recent cuts to key-exporters production, and current lower stock levels. Also, China, the biggest importer of crude oil in the world, has been disappointing in the release of its economic data, showing a slowdown in its industrial and real estate activity. Therefore, this year should be marked by intense volatility as fundamentals might point to one way and the macro front another. In this situation, monitoring monetary authorities and key market players' activity is essential, as is choosing the correct risk management strategy.
Victor Arduin – Energy Analyst
White Paper — Multi Commodities
alef.dias@hedgepointglobal.com
victor.arduin@hedgepointglobal.com

