
2023 Outlook
Introduction
Thais Italiani – Market Intelligence Manager
Macroeconomics
YoY M2 Supply (China, U.S., %)
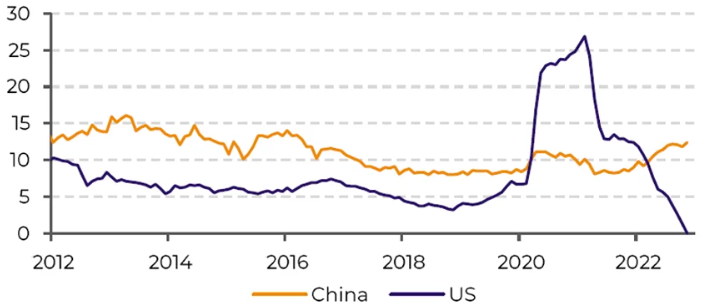
Source: Bloomberg
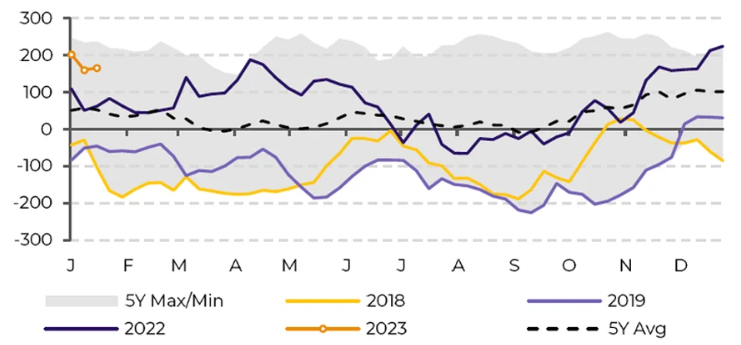
EM Currencies and Commodities Indexes
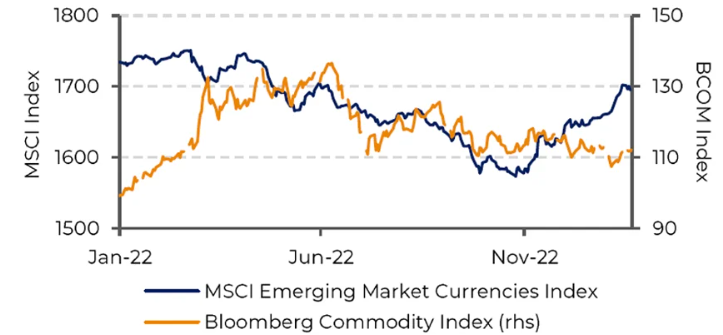
Source: Refinitiv
USD/BRL - Spot Rate and HPGM Fair Value Model
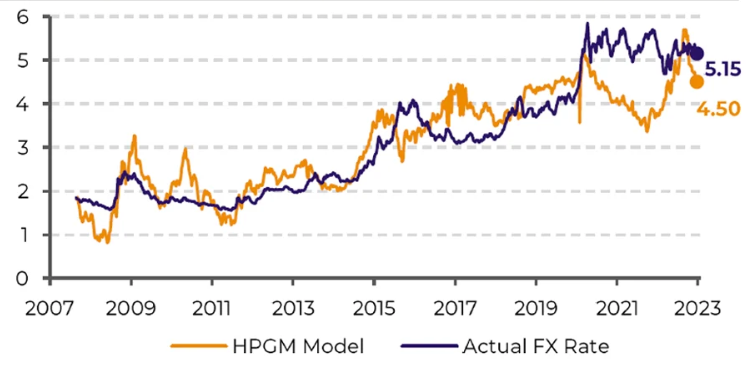
Source:
Alef Dias and Victor Arduin – Macroeconomics Analysts
Energy
Brent, Heating Oil Time Spread (M1VsM6)
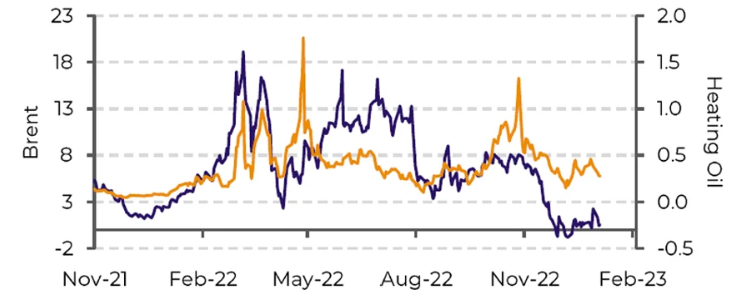
Source: Bloomberg
.
LMG Metrics in Europe
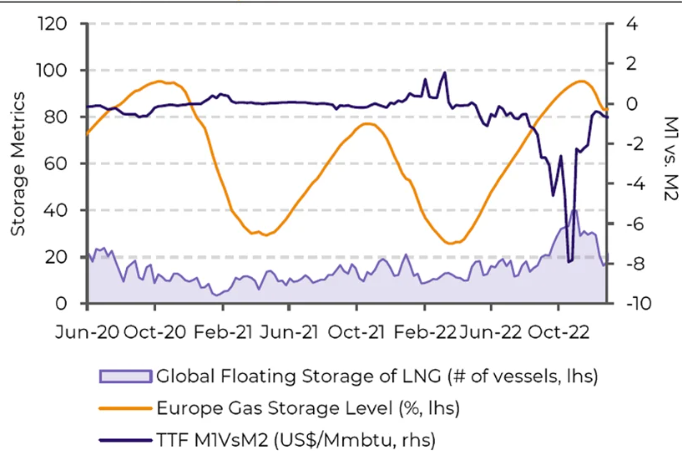
Source: Bloomberg
Heitor Paiva – Energy Analyst
Carbon Market
CBIO (RENOVABIO)
Cbio Traded Volume vc Monthly Avarage Price
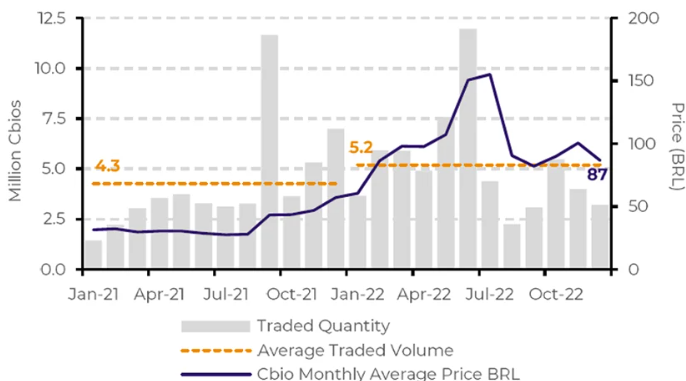
Source: Bloomberg, hEDGEpint Global Markets
Risks
RIN (Reweable Fuel Standar - RFS)
EPA Proposed RFS (Billion Gallons)
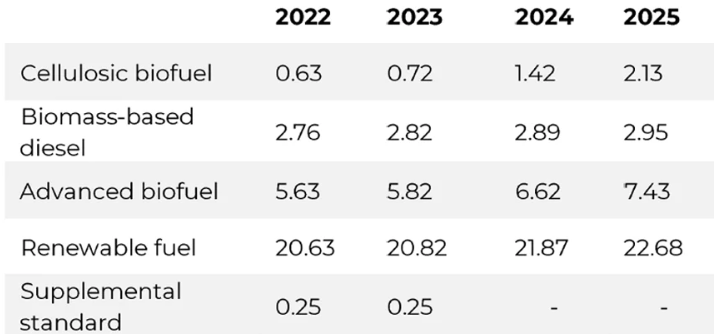
Source: EPA
RIN, SBO
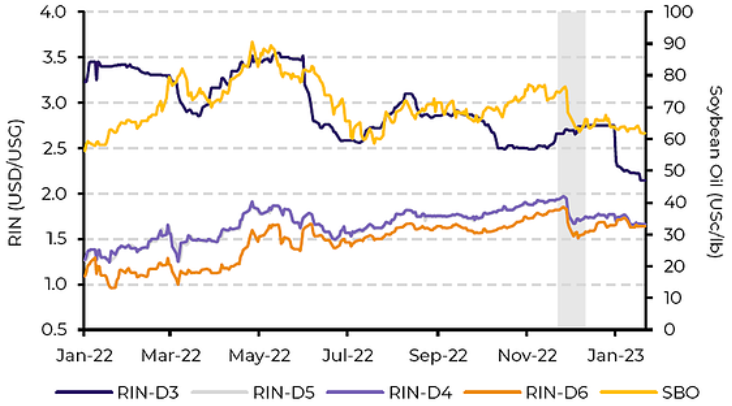
Source: Bloomberg
Yuri Renni – Carbon Analysts
Sugar
Macroeconomics
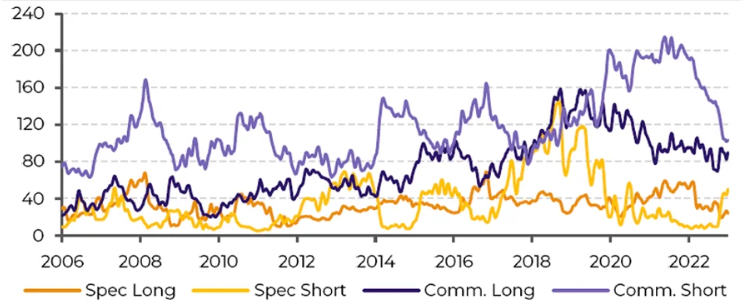
Fund Positioning
Raw Sugar Spaculator Positioning ('000lots)
Source: hEDGEpoint Global Markets, CFTC
Fundamentals
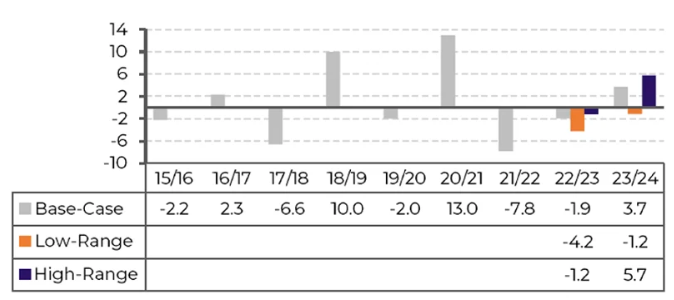
Sugar Global Suply and Demand Balance (MT rv)
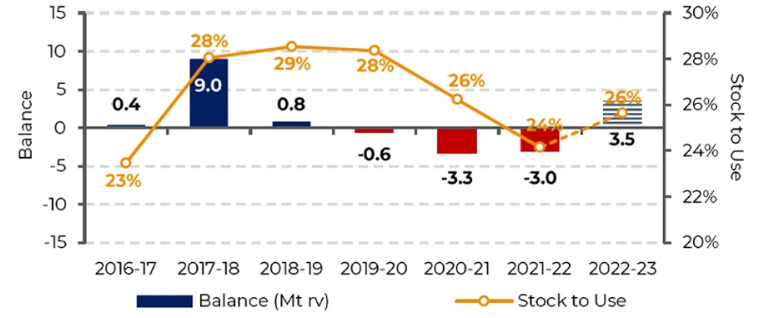
Source: hEDGEpoint Global Marktes
Total Sugar Trade Flow (MT tq)
Source: hEDGEpoint Global Marktes
Asia
India, for instance, has shown a great crushing pace, producing 12Mt of sugar until December, 2022, compared to 11.6Mt the previous year - a 4% improvement. However, when it comes to total production, the country has faced some adverse weather - excessive rainfall and cloudier weather might have affected the cane’s vegetative development. Thus, we don’t expect production to reach last year’s 36Mt record, especially considering a higher ethanol diversion. However, there’s an upside risk, as actual yields only become clear around March. Hence, our preliminary sugar production expectation is 35.5Mt. For exports, we believe in a 6 to 7Mt range - depending on the production upside, as stocks are already pressured with 6Mt of exports and 35.5Mt of production. In the end, the announcement of a further 1Mt export quota is seen as difficult.
Thailand has also shown a positive rhythm. By December’s end, the country produced 1.8Mt of the sweetener, 11.7% higher compared to last year - even with a late start. While we do believe in a production recovery to around 11.5Mt, we should be weary of yields - its growth can be restrained by the lower use of fertilizers, higher cost (green cane opposed to burnt), and the ban on some agricultural chemicals.
Europe
North America
Mexico’s area is expected to be 4% higher. However, yield reductions should offset its positive implications. The latter was affected mainly by a drier-than-average weather during the cane’s vegetative development. A 6.3% drop is expected, according to Conadesuca, which implies a cut of 2.7% in sweetener production.
Central America
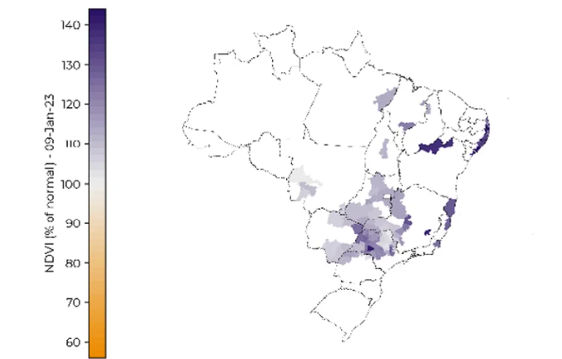
Brazil
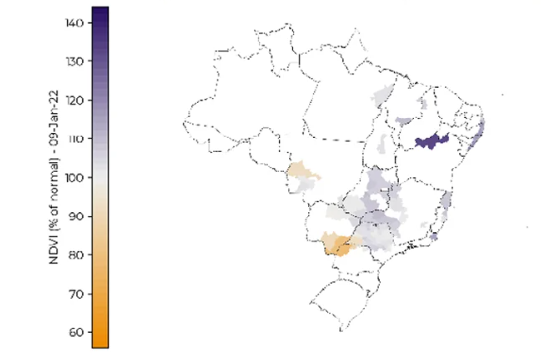
Brazilian Cane Region NDVI Anomaly - Jan. 9, 2022
Source:
Brazilian Cane Region NDVI Anomaly - Jan. 9, 2023
Source:
Risks
Livea Coda – Sugar Analysts
Coffee
Macroeconomics
Fund Positioning
Fund Positioning in Arabica Coffee ('000 lots)
Source: hEDGEpoint Global Markets, CFTC
Production
Suply & Demand Balance (M bags)
Source: hEDGEpoint Global Markets
ECF (left) and GCA (right) Stocks (M bags)
Demand
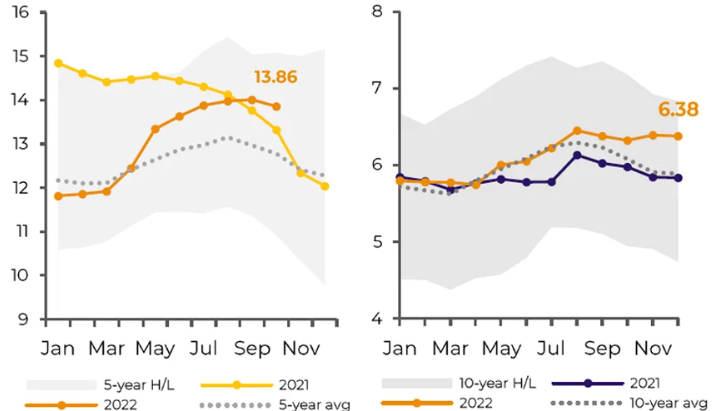
Source: Europian Coffee Association, Green Coffee Association
Weather
Forecast El niño/ La niña (Nino 3.4 Index)
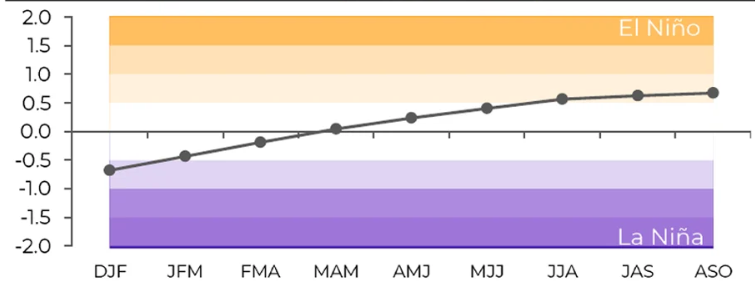
Source: IRI
Nathalia Gandolphi – Coffee Analysts
Cotton
Davi Silbiger – Cotton Analysts
Soybean
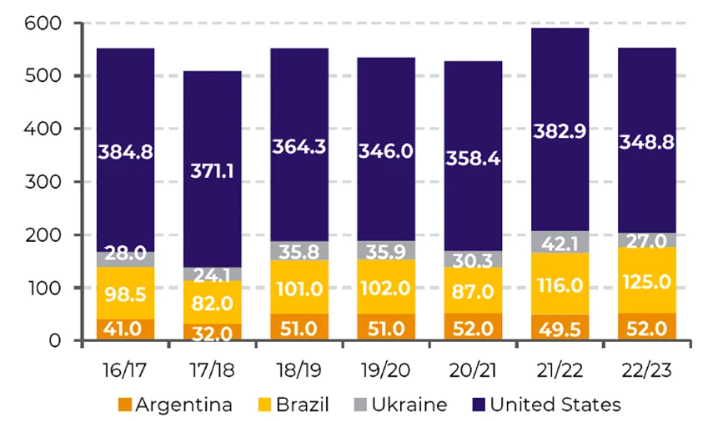
Soybean Global Production - Top 4 (M ton)
Source: USDA
At this point, USDA numbers point to a somewhat comfortable global surplus. However, we believe a couple of trims in Argentine and Brazilian production could still come, which would put us much closer to net zero, a slightly bullish case.
Growth in Domestic Use in Brazil and the U.S.
Source: USDA
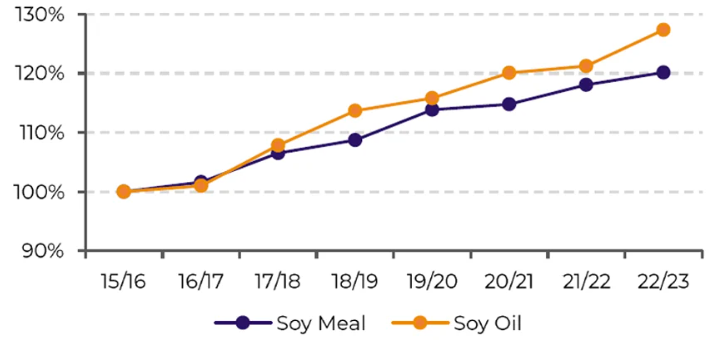
The fate of the soy oil market has been tied to a combination of government decisions on biofuel policies, rising inflation, and frequent changes in Indonesian and Malaysian palm oil export/biodiesel policies.
Soybean Global Balance (M ton)
Source: USDA
As such, there will be more demand for soy oil as well.
Alef Dias and Pedro Schicchi – Soybean Analysts
Corn
Corn Global Balance (M ton)
Source: USDA
The next in line to harvest is Argentina. However, high fertilizer prices have pushed farmers off the grain in favor of soybeans, and the “early corn” in the country has been facing much of the same weather conditions that are dragging soy production lower.
Thus, at the very least, we shouldn’t count on a bumper crop from Argentina. We could see a pretty poor one if the “late corn” also doesn’t perform. We currently estimate 48M ton of production, versus the USDA's 52M and 49.5M last year.
Corn Global Production - Top 4 (M ton)
Source: USDA
Alef Dias and Pedro Schicchi – Corn Analysts
Wheat
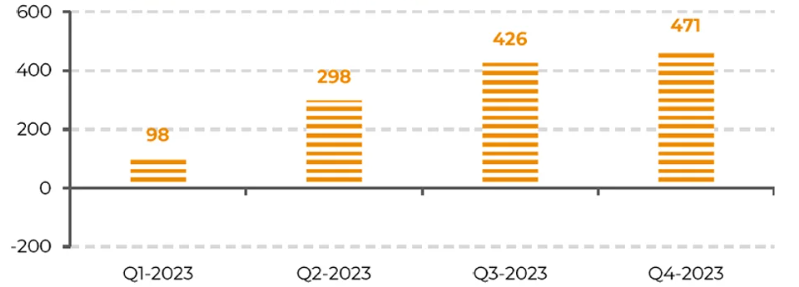
Weekly Tonnage of Grains Exported by Ucraine throughthe Grains Corridor Deal ('000 ton)
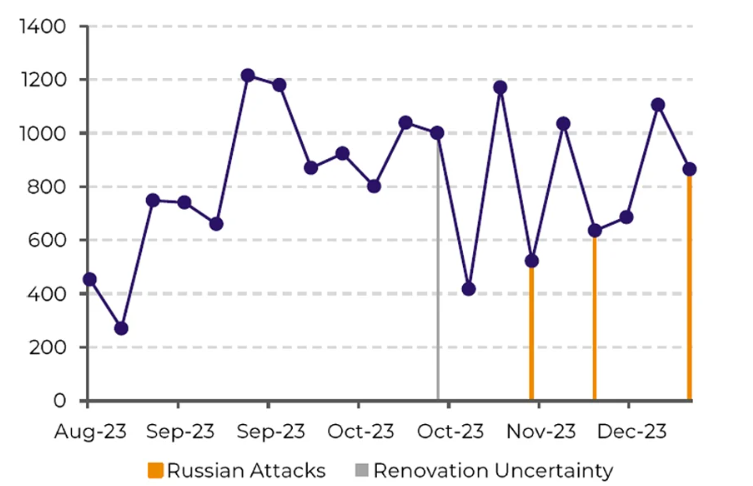
Source: United Nation Black Sea Grain Initiative, hEDGEpoint
Wheat Russia - Area, Yield, and Production (M ha, mt/ha, M mt)
Source: USDA, Russia Agriculture Ministry
Alef Dias and Davi Silbiger – Wheat Analysts
In Summary
- Thin liquidity and an economic slowdown in the West will be key themes to watch in 2023, as well as the rapid comeback by China - where liquidity has been rapidly rising and providing optimism to commodity markets. The perception of peak interest rates in developed nations, with commodities in tight supply, has created a positive outlook for most emerging currencies within the macroeconomic framework.
- Oil markets were very volatile in 2022, and 2023 is anticipated to be the same. Supply restrictions and worries about a potential slowdown in the West have made prices swing recently. China’s comeback, after strict COVID-containment measures, adds optimism to the demand side - especially since it could offset any demand weakness in the West throughout the year.
- Political aspects play a considerable role in any compliance market. For both Cbios and RINs, recent developments have impacted prices. Some relevant announcements should be made in 2023, adding volatility to these markets.
- The sugar market starts 2023 with a bearish bias, as a surplus is often associated with falling prices. However, there are some risks to this vision. Much can still change - whether in terms of macroeconomic developments, government decisions, or even weather anomalies.
- Bearish macro trends may affect coffee in the 1Q. Destinations are well supplied, and demand may lag early on, but growth is expected. Global economic recovery is bullish for commodities, enjoying support in the 3Q. If crop development is not affected by El Niño, the 23/24 and 24/25 crops may lead to some pressure in the 4Q.
- The Chinese reopening (which can be seen as almost as a certainty) and the macroeconomic scenario (still under debate) will be the leading demand drivers for cotton, with increases in imports potentially benefitting Brazil, while American producers may start to focus on other cultures.
- The main soybean producers showed an increase in area for 22/23. Still, for Argentina, the larger area may not translate into higher production. Biofuel policies can support oil consumption, but meal possibly won’t see the same growth.
- For corn, the scenario is tight, at least until 2H/23, due to crop failures (in the US and Ukraine) and potential losses in Argentina. Thus, there’s a lot of pressure on the Brazilian winter crop and incentives to increase the area of Northern Hemisphere crops.
- The impacts of the war in 2022 may linger through 2023 in the wheat market, leading to acreage changes, and a bigger role for Russia and the European Union, as they fill the gap left by Ukraine and Argentina in global markets, all the while forcing the main importers to adapt.
White Paper — Multi Commodities
alef.dias@hedgepointglobal.com
victor.arduin@hedgepointglobal.com
heitor.paiva@hedgepointglobal.com
yuri.renni@hedgepointglobal.com
david,silbiger@hedgepointglobal.com

