
Multi-commodity White Paper - El Niño
· As ENSO forecast points out a higher probability of an El Niño formation during May-August, concerns regarding 23/24 total sugar output have risen. Usually, Asia is the region that is affected the most as the climate pattern may reduce monsoons and impact crop development. If extremely strong, Brazil, the main sugar supplier may also suffer: a rainy winter can be extremely bad for sucrose concentration and affect the crushing pace.
· Regarding coffee production, the phenomenon is known to historically lead to warmer weather during the vegetative growth and flowering windows in Brazil. This year, specifically, soil moisture levels are adequate and therefore, the outlook is currently less vulnerable, but it can still change throughout winter. El Niño has also impacted Central American arabica production in the past, since it leads to warmer weather during flowering and cherry growth.
· When it comes to soybeans and corn, regions of interest include US, Brazil, Argentina, and the Black Sea. Given the large extension of these countries and differences in crop calendar, effects of El Niño vary widely.
In the US, El Niño is usually weaker during the summer. As a result, its effects on yields in the country are mild, although mostly positive.
In South America, El Niño is known to bring heat to most of Brazil, and higher-than-average rainfall in Southern Brazil and Argentina towards the end of the year. As such, the event is usually negative for winter corn, but positive for soybeans and corn in Southern Brazil and Argentina during the summer.
· Regarding wheat, Northern Hemisphere producers with spring crops and Southern Hemisphere producers will be mostly affected. This year, Canada's spring wheat production is expected to be the most impacted in the Northern Hemisphere, while in Russia, good prospects for the winter crop and high carryover stocks could reduce El Niño’s influence over total supply. Argentina and the US may benefit from El Niño’s effects, but Australia may see reduced rainfall and lower crop yields, causing a bullish impact on wheat markets.
Introduction
How does it work and why does it matter?
Sometimes these winds, also referred to as trade winds, weaken. If this event is intense enough, the warm waters stop piling up on the Asian side of the Pacific and move to the East, reducing upwelling of cold water on the coast of South America.
This scenario, with above average sea surface temperature in the eastern section of the tropical Pacific Ocean, is known as El Niño.
Conversely, when these winds are especially strong, the sea surface temperatures over the coast of South America (again, in the tropical region) become cold compared to normal. As you might have guessed, this is called La Niña.
Both these changes cause major shifts in the weather, especially around the tropics which will be later discussed.
The bottom-line is that ENSO is a single phenomenon that oscillates between three phases: warm (El Niño), neutral and cold (La Niña). And for each of them the weather pattern is different, and so are the impacts for crop development around the world. This is why we are here: to detail it and connect what can be expected for each of one of the commodities we follow.
How is it measured?
However, the most usual index, and the one officially used by US National Oceanic and Atmospheric Administration (NOAA), is the Oceanic Niño Index (ONI), based on sea surface temperatures.
The ONI is calculated by comparing the running 3-month average temperature in a region called Niño 3.4 to its 30-year average.
If the average temperature for that 3-month period is greater than 0.5°C then NOAA considers that El Niño conditions exist. On the other end, La Niña conditions exist when ONI is smaller than -0.5°C. Alternatively, between 0°C and 0.5°C, Neutral Positive conditions exist, whereas Neutral Negative conditions are seen between -0.5°C and 0°C.
However, simply getting to one of these thresholds is not enough to state that one of both events is taking place. NOAA and other weather agencies haveseveral criteria to be met before officially declaring an El Niño/La Niña pattern, like wind strength and a number of consecutive months with high/low ONI.
Therefore, it is also important to be attentive to the watch and alert outlooks emitted by the main weather agencies. These outlooks basically mean that favorable conditions for one of the two ENSO stages are in place and specialists believe it could develop into a full El Niño/La Niña.
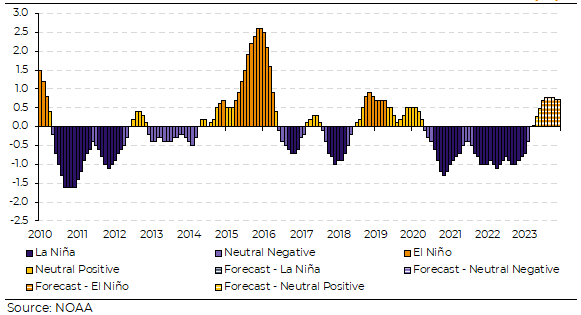
Historical Look to the Oceanic Niño Index and 2023 Forecast - ONI (°C)
Source:
What is the outlook for El Niño/La Niña in the next months?
Generally, it can also be classified as Watch, when the forecast suggests that in the next months, either of the two states may become active, or Alert, when the influence of either state becomes clearer.
This being said, what to expect in the next months? The NOAA model shows a 60-70% likelihood of El Niño becoming active through the May-July quarter. Moving the last quarter of the year, chances increase to 80-90%.
We invite you to join us in the analysis regarding this weather phenomenon’s impacts for the global markets of Sugar, Coffee, Soybean, Corn and Wheat. We will go from phenological and fundamental aspects to its implications for prices in the main exchanges.
Sugar
Sugar can be produced out of two main products: sugar cane and beet. Each culture requires a different set of conditions to thrive. While cane is the best fit for sub-tropical climates, beet is a little more resilient to cold temperatures and can endure temperate climates. As a result, sugar’s main suppliers, Brazil, India, and Thailand, as well as most Central American, produce sugar out of cane, while regions such as Europe, Eurasia, and Northern North America deal best with beet.
Each country and region has its own crop calendar, but one thing is alike: both cane and beet need rain, soil moisture, and sunshine for a good development during their growing stage. Therefore, changes to regular weather conditions can affect them directly and thus, the sweetener’s total output.
Sugar Crop Calendar
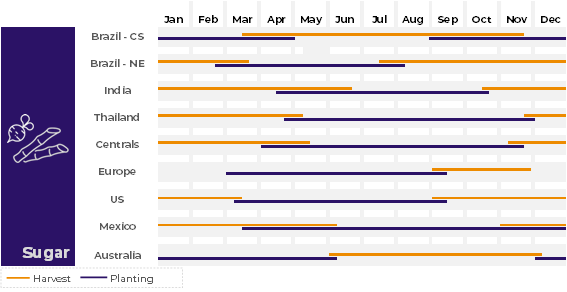
Source: CONAB, EC, ICCO, ISMA and USDA.
Although there is no strong correlation between the occurrences of El Niño pattern and sugar crop failure, it is well known that it does add some volatility to its availability, especially during the Jun/Aug window, as it might affect both the Brazilian harvest and the Northern Hemisphere crop development. However, we should keep in mind that not all effects are negative, as El Niño unfolds differently depending on its intensity and affected region.
Source:
Oceanic Niño Index (ONI) For Jun/August
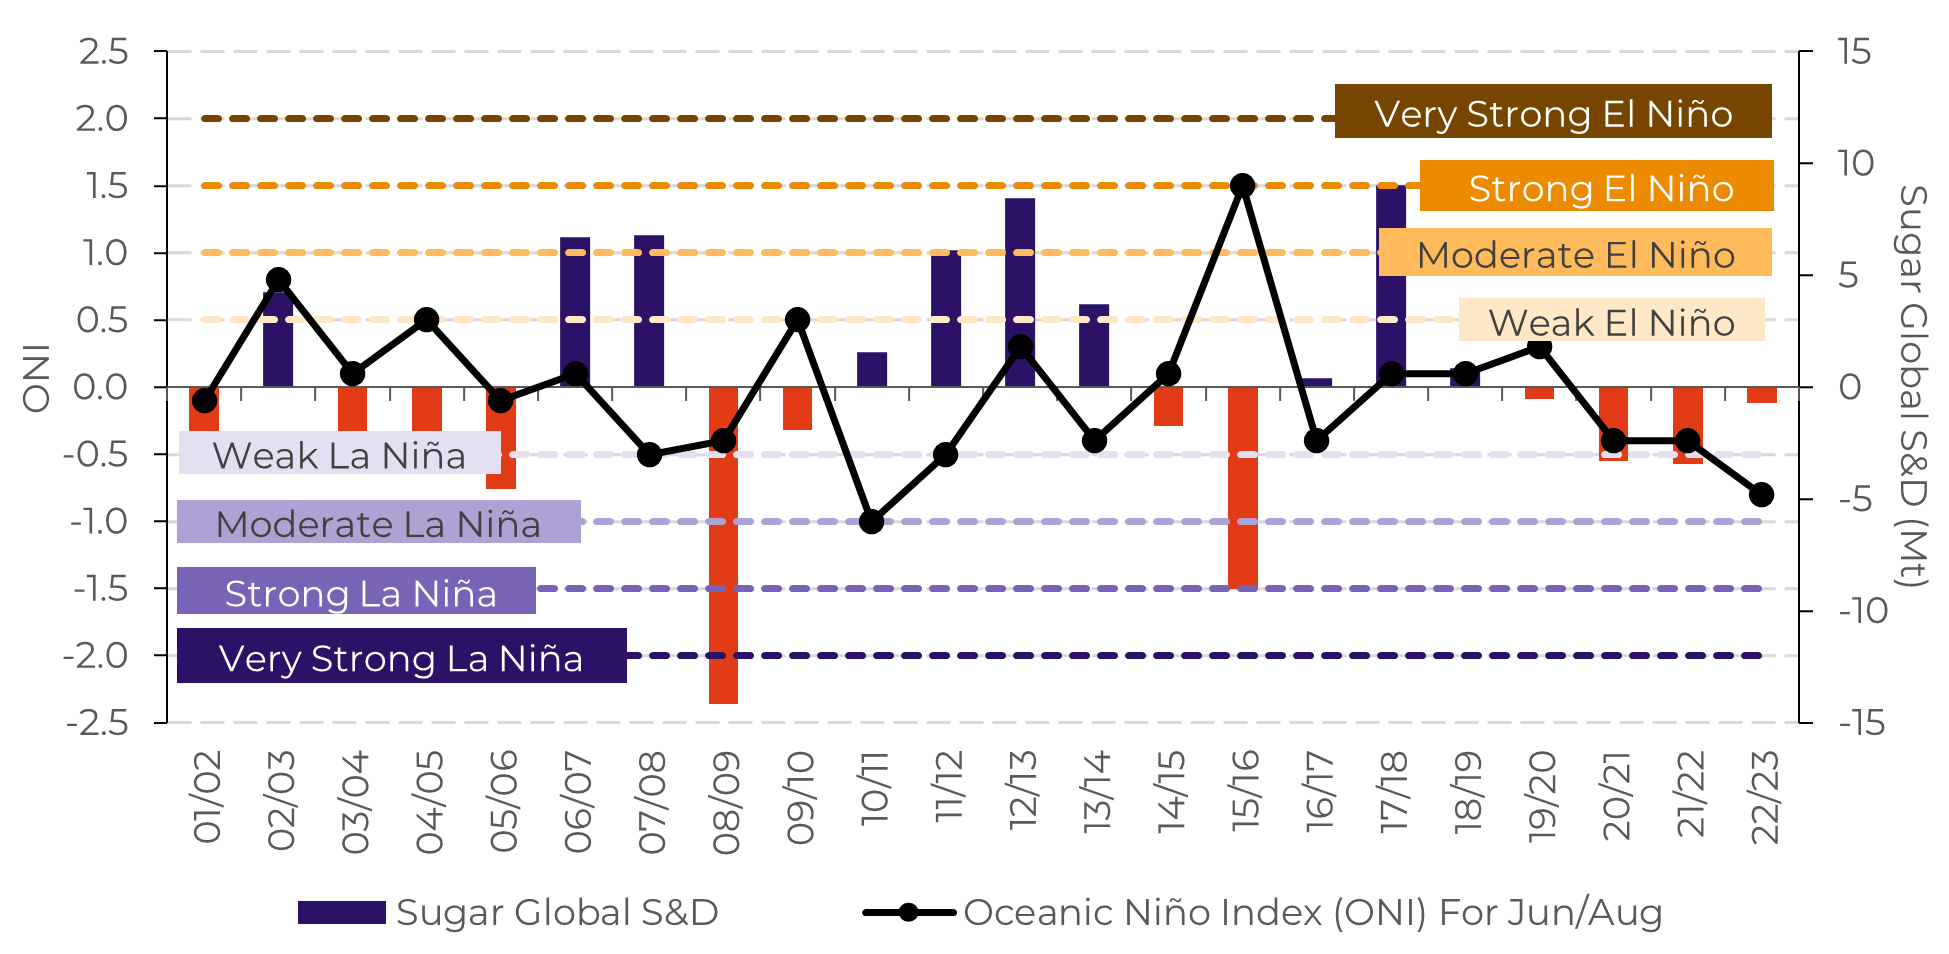
Source: Golden Gate Weather Services; hEDGEpoint Global Markets
Central America: El Niño usually leads the region to drier-than-usual weather during the most important cane development window. Between April and November, if the country doesn’t rely on irrigation methods, cane might suffer and fail to develop properly.
India: Between June and November, accounting for basically the whole cane-developing period, El Niño makes weather drier – leading to lower-than-average monsoons and possibly compromising sugar yields. This year, if El Niño intensity escalates affecting current monsoon formation, it might add to the tighter sugar availability scenario, however, if the dryness period comes later, it might induce higher sucrose content!
Thailand: As in India, El Niño brings drier-than-average weather for most of the year, except for the December-February period, when it can induce higher-than normal precipitation. Therefore, the weather pattern is extremely worrisome as it affects both cane development and crushing pace negatively.
Europe: El Niño can be responsible for a slight increase in the region’s precipitation – especially in France and Germany. Therefore, it can be beneficial if restricted to the March-August window, which is exactly the sugar-beet developing stage. If an extremely strong event takes place, El Niño might lead to an extension of the rainfall period – making harvesting more difficult. As ENSO forecast points out a higher probability of an El Niño formation during May-August, concerns regarding 23/24 output have risen. Although it may not affect current harvesting (22/23), India’s 23/24 sugar output might be affected if the weather pattern probability escalates quickly. But India is not the only one at risk. As discussed, the Brazilian CS could also suffer from its effects. A wetter winter can be extremely bad for sucrose concentration and affect the crushing pace. Still, we should be aware of this weather event’s expected magnitude. Due to low correlations, a more subtle El Niño may not affect the region as much. For other regions such as Europe, the pattern might even be beneficial, and, to others, namely Central America, technological investment in irrigation have been made and might prevent major breaks.
Source:
Coffe
Coffee has been subject to negative impacts from La Niña over the past three crops, and El Niño might bring as much of a threat for crop development. As a perennial crop, coffee is more vulnerable to weather anomalies, since those events may impact not only the current crop, but the upcoming ones as well. With this in mind, it’s important to note that the crop that would be mostly affected by the phenomenon this year is the 24/25 crop, since it’s expected to become active only in 2Q.
At first, the phenomenon
would decrease frost likelihood in Brazil, with warmer temperatures during
autumn and winter. On the other hand, if winter proves to be drier than
average, in addition to warmer weather, soil moisture and water reserves may be
negatively impacted. Still, this is not an immediate threat, since those
reserves are adequately high from recent rains – it would take an extreme
occurrence to change this scenario. Also, even though the event carries more
correlation to temperatures, it may also impact rainfall levels during this
window – however, bringing higher rainfall levels than average. In this
scenario, harvest disruptions may occur for the 23/24 crop, and, happening in
the second half of 2023, it could trigger early flowerings.
Moving from the
vegetative growth period into the post-flowering one, the El Niño view changes
drastically: warmer temperatures during cherry filling and maturation may
threaten development. In addition to that, if the phenomenon does affect the
rainfall pattern as well, it could lead to a drier period, threatening the
optimistic view for 24/25.
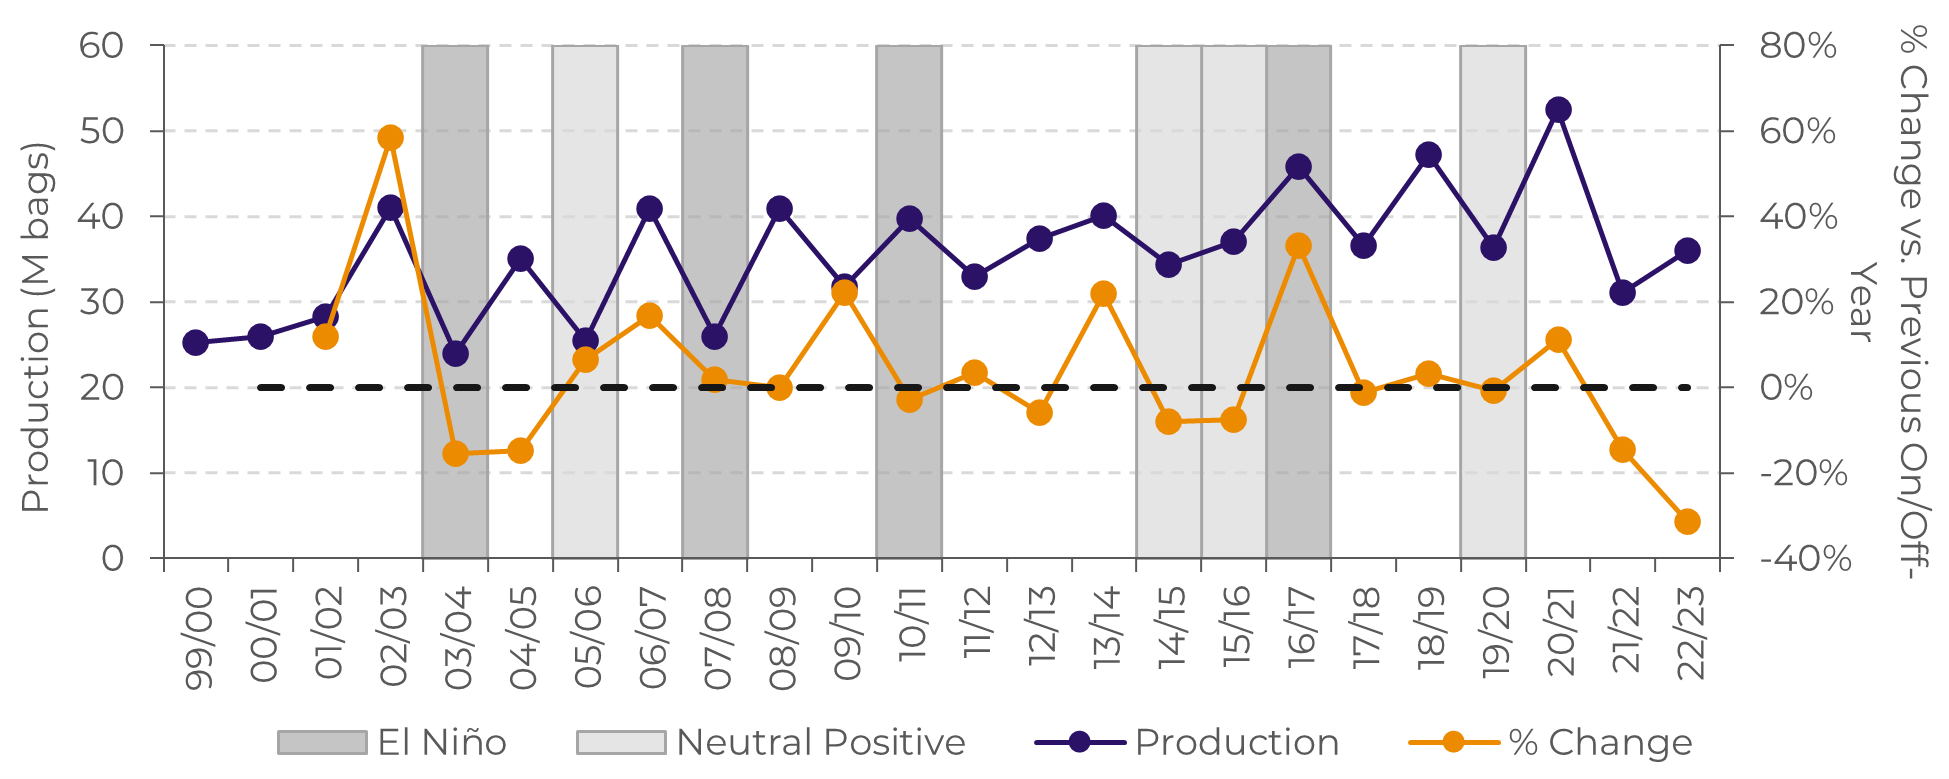
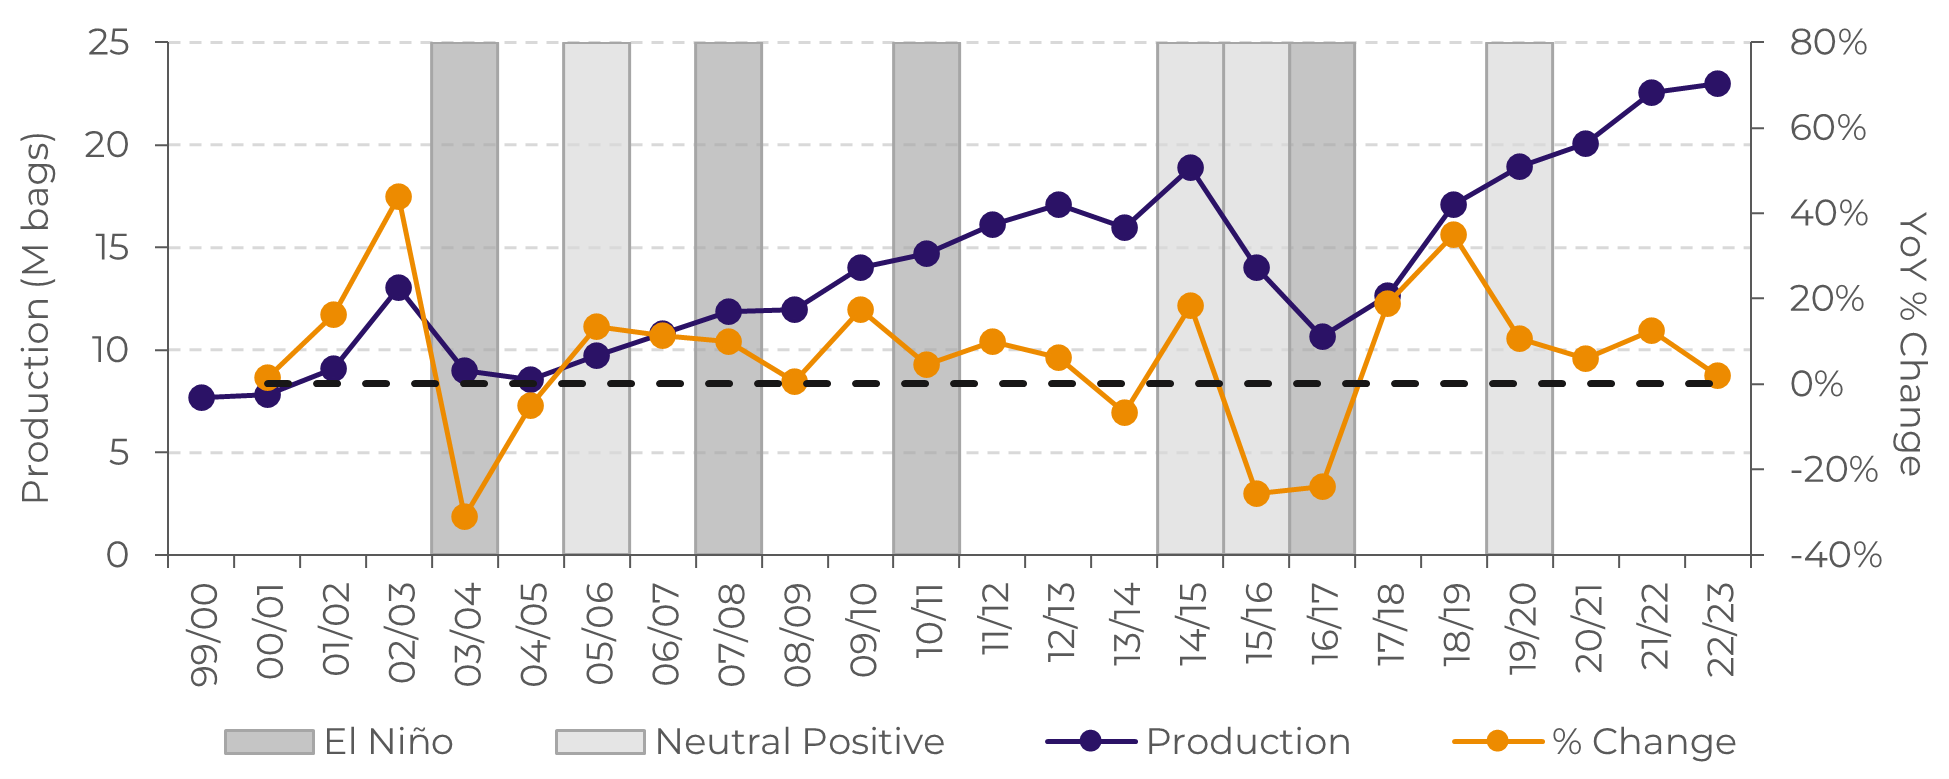
Arabica BR Production, % Growth and El Niño/Neutral Positive Years
Source: hEDGEpoint Global Markets, BOM
Historically, El Niño
happened in 03/04, 07/08, 10/11 and 16/17 during the key development periods
(post-flowering through maturation). 16/17 is an outlier when compared to the
other cycles, since production was recovering from the 14/15 and 15/16 crop
failures. These two were mostly affected by the 2013 drought, that happened on
a Neutral-ENSO year – the second-warmest year in over a century without an
active El Niño. Both crops were also affected by the neutral-positive scenario,
that was leading up to El Niño.
On average, not considering the 16/17 crop, arabica production fell by 5% during El Niño years (when compared to the previous on- or off-year). During neutral positive and El Niño years, the average drop is 4%.
Source:
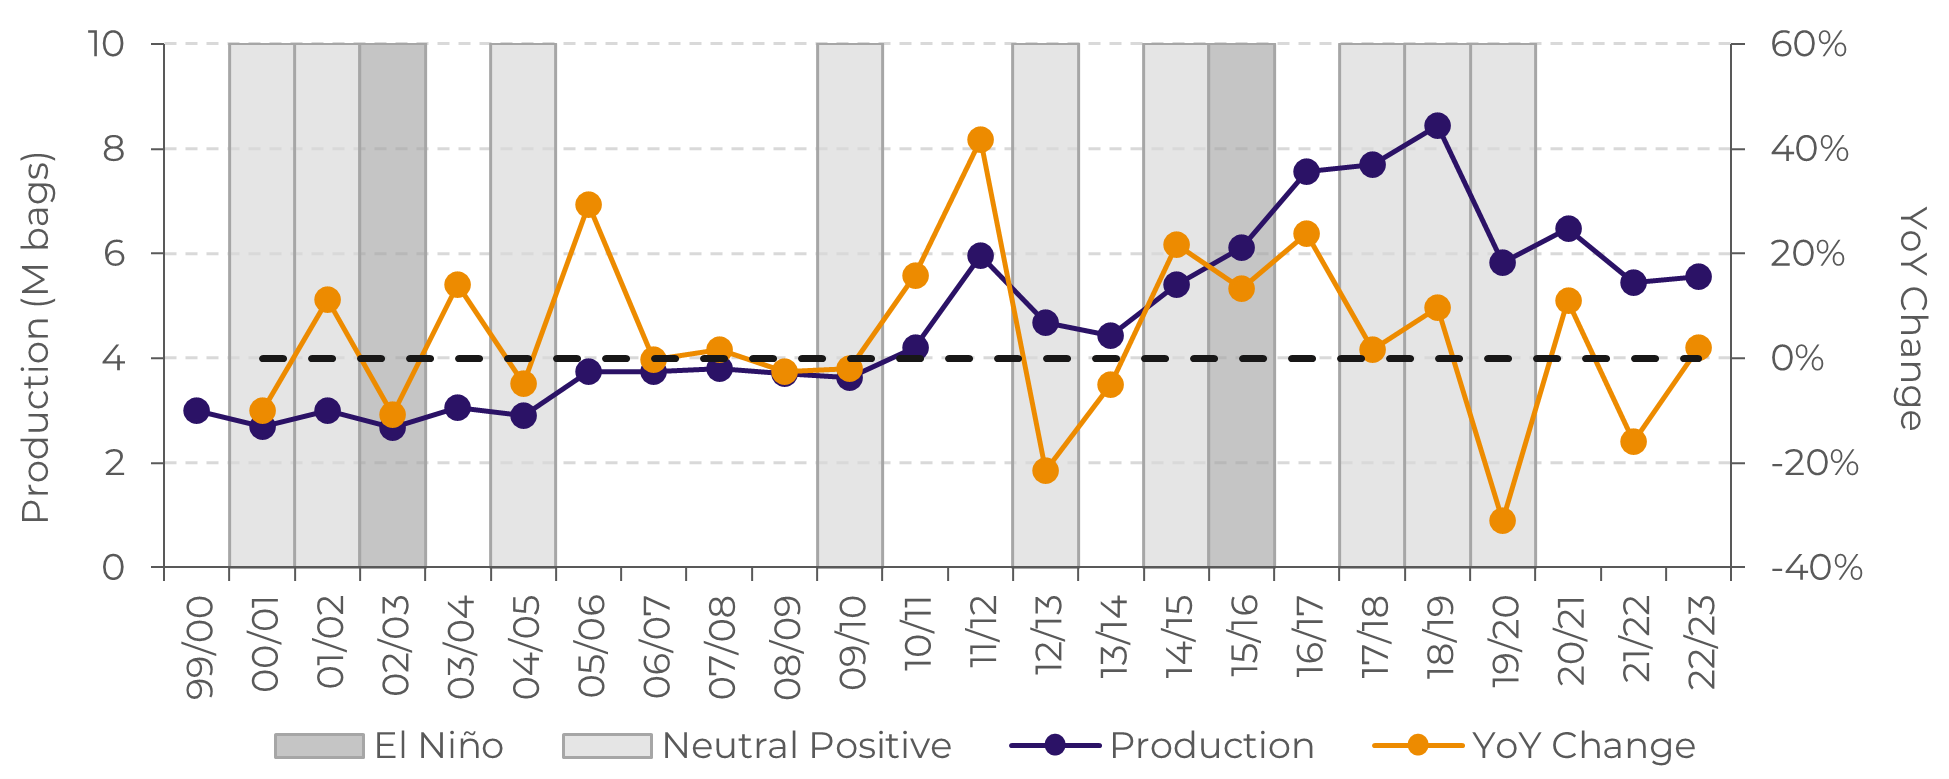
Robusta BR Production, % Growth, and El Niño/Neutral Positive Years
Source: hEDGEpoint Global Markets, BOM
As for conilon,
production fell by 10% during El Niño years, and by 3% during neutral positive
and El Niño years. Even though the past three crops were negatively affected by
the La Niña phenomenon, its counterpart is just as relevant.
The phenomenon also raises concerns for coffee production in Central America. Overall, temperatures tend to be higher than average through flowering and cherry development months, and precipitation tends to be below-average, especially in the June-August trimester. Taking Honduras as an example and comparing similar years that were either neutral-positive or actively affected by El Niño, rainfall levels in July and August tend to be worrisome.
Still using the main producer in Central America as a proxy, there were two cycles in which development was directly affected by an active El Niño: 02/03 and 15/16. In the former, production dropped by 11%; in the latter, it increased by 13%, but we highlight that the region was then recovering from coffee leaf rust, inflating the YoY growth rates from 13/14 through 16/17.
Source:
Honduras Production, YoY Growth, and El Niño/Neutral Positive Years
Source: BOM, hEDGEpoint Global Markets
Nonetheless, the region
has also had its key development stages affected by a neutral-positive status –
when there is an El Niño “watch” or “alert”, that the phenomenon will likely
become active. On average, considering all crop years affected by El Niño or
neutral-positive status, production in the country fell by 3%.
The risk lies mostly in
flowering happening as expected, and rains not following through during the
cherry filling stage. This could lead to smaller cherries, and consequently,
lower yields.
To simulate the possible impact that El Niño might have in the next cycle, we consider the phenomenon’s average historical impact, using Honduras as a Central America proxy. That could mean an impact of -833K bags in the 23/24 cycle.
Source:
Soybeans and Corn
After several years with
an active La Niña on the market’s radar the tides have turned and now, we are
presented with an El Niño year. Throughout this report we have been analyzing
how El Niño affects the weather in regions of interest across the globe. When
it comes to soybeans and corn these regions include the US, South America, and
the Black Sea.
Starting with the US, El
Niño effects are felt more strongly during winter months. This is because it
affects the position of Polar and Pacific Jet Streams over the country,
influencing weather as a result. During summer months, the Polar Jet Stream is
already further North minimizing effects to US’ Midwest. While significant to
cultures such as winter wheat, this is not a relevant window for corn and
soybeans. However, saying effects are smaller during summer is not the same as
to say that they are non-existent.
In years when it was
active, the US’ Midwest registered cooler temperatures during summer,
higher-than-normal precipitation in Western corn belt and some dry spots
towards the East. The correlation with precipitation, however, is smaller.
Among the top ten producing states correlations are not too high anywhere, meaning effects, although existent, are small. The good news is: they were mostly positive. The only states where a more consistent negative effect is felt are Ohio and Indiana, where the dry spots were located in the past. In these years, corn was more susceptible than soybeans.
Correlation between US’ yield deviation from trend and El Niño Intensity in Jun-Aug
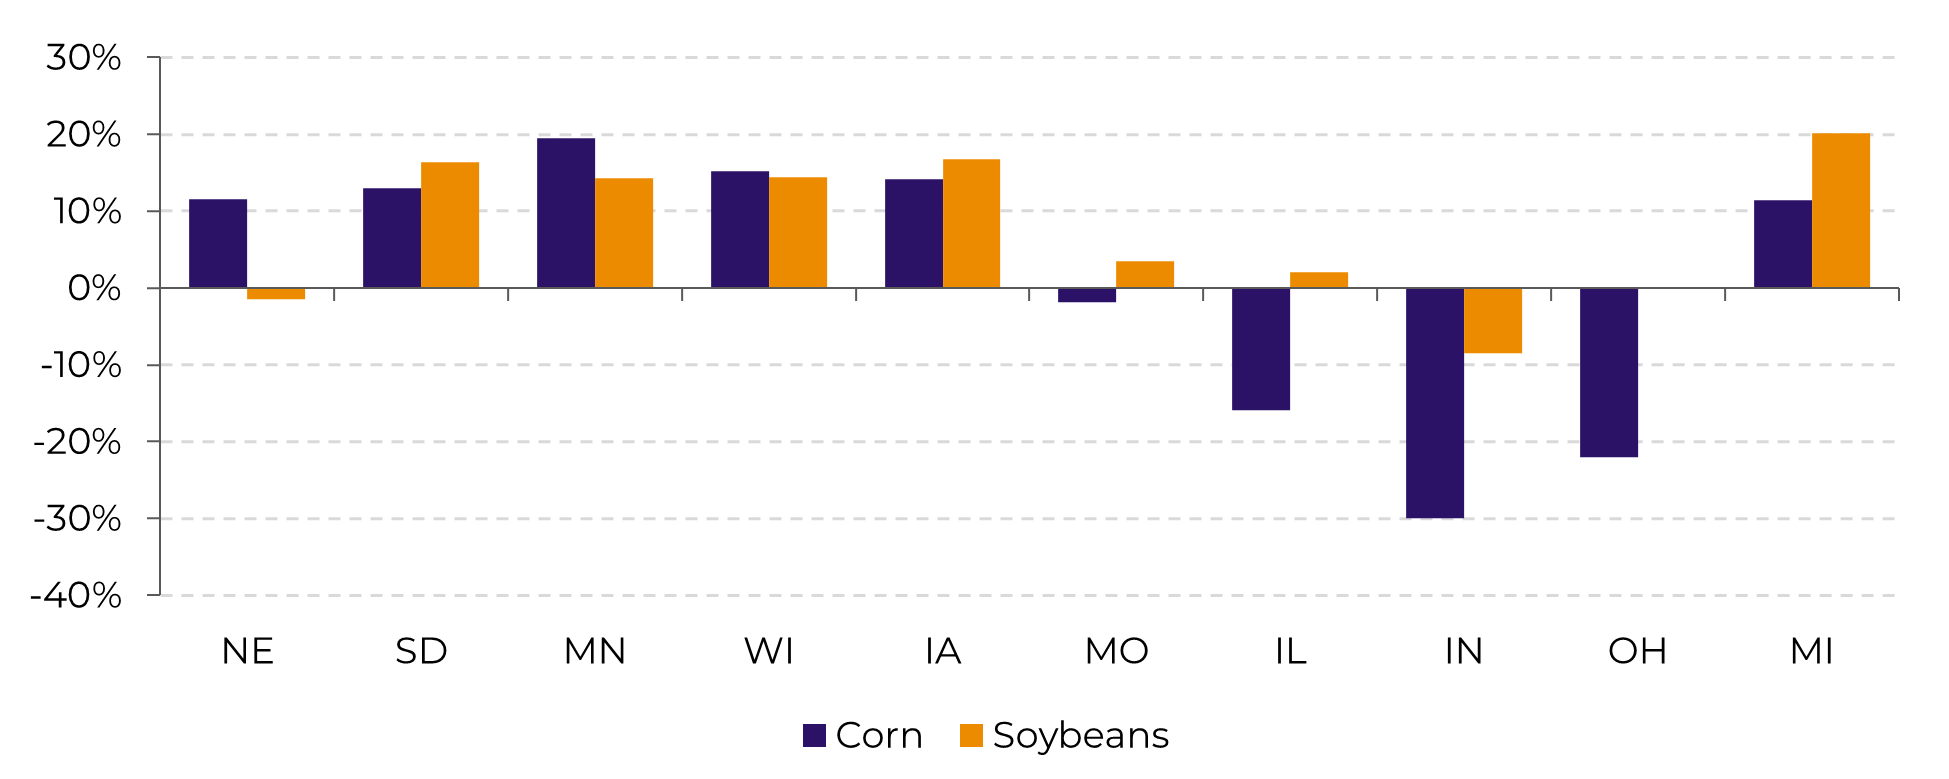
Source: hEDGEpoint Global Markets
Particularly for corn,
the US has been targeting the 180+ bu/ac mark at the national level and, for a
few seasons in a row, poor weather has cut these expectations short. At least
at first, seems like we may have the right conditions for that to happen this
year. Planting has started early and climatic conditions in past El Niño years
have proven beneficial to crops.
Moving on to South America. Two windows are relevant to analyze here: Autumn/early Winter – when we have winter corn developing in Brazil – and Spring/early Summer – when we have soybeans in Brazil and both soybeans and corn in Argentina.
First, in the
Autumn/Winter in Brazil (March-August), El Niño is associated with warmer
temperatures in Brazil, as cited for other commodities. The overall rationale
is similar as well: frost risk is smaller, and growth is favored (provided
temps are not excessively high), but evapotranspiration also increases, meaning
crops need more water to maintain yields.
The problem is, El Niño is not as highly correlated with precipitation in this window as it is with temperatures. Between March and May, when most of the development is taking place, there are not really any meaningfully correlated regions. In the June-August window there are some spots where El Niño has led to above-average precipitation, including Western portions of Paraná and Mato Grosso do Sul. Still, even in these regions, the correlation was not too high.
Source:
Correlation between Brazil’s yield deviation from trend and El Niño Intensityg
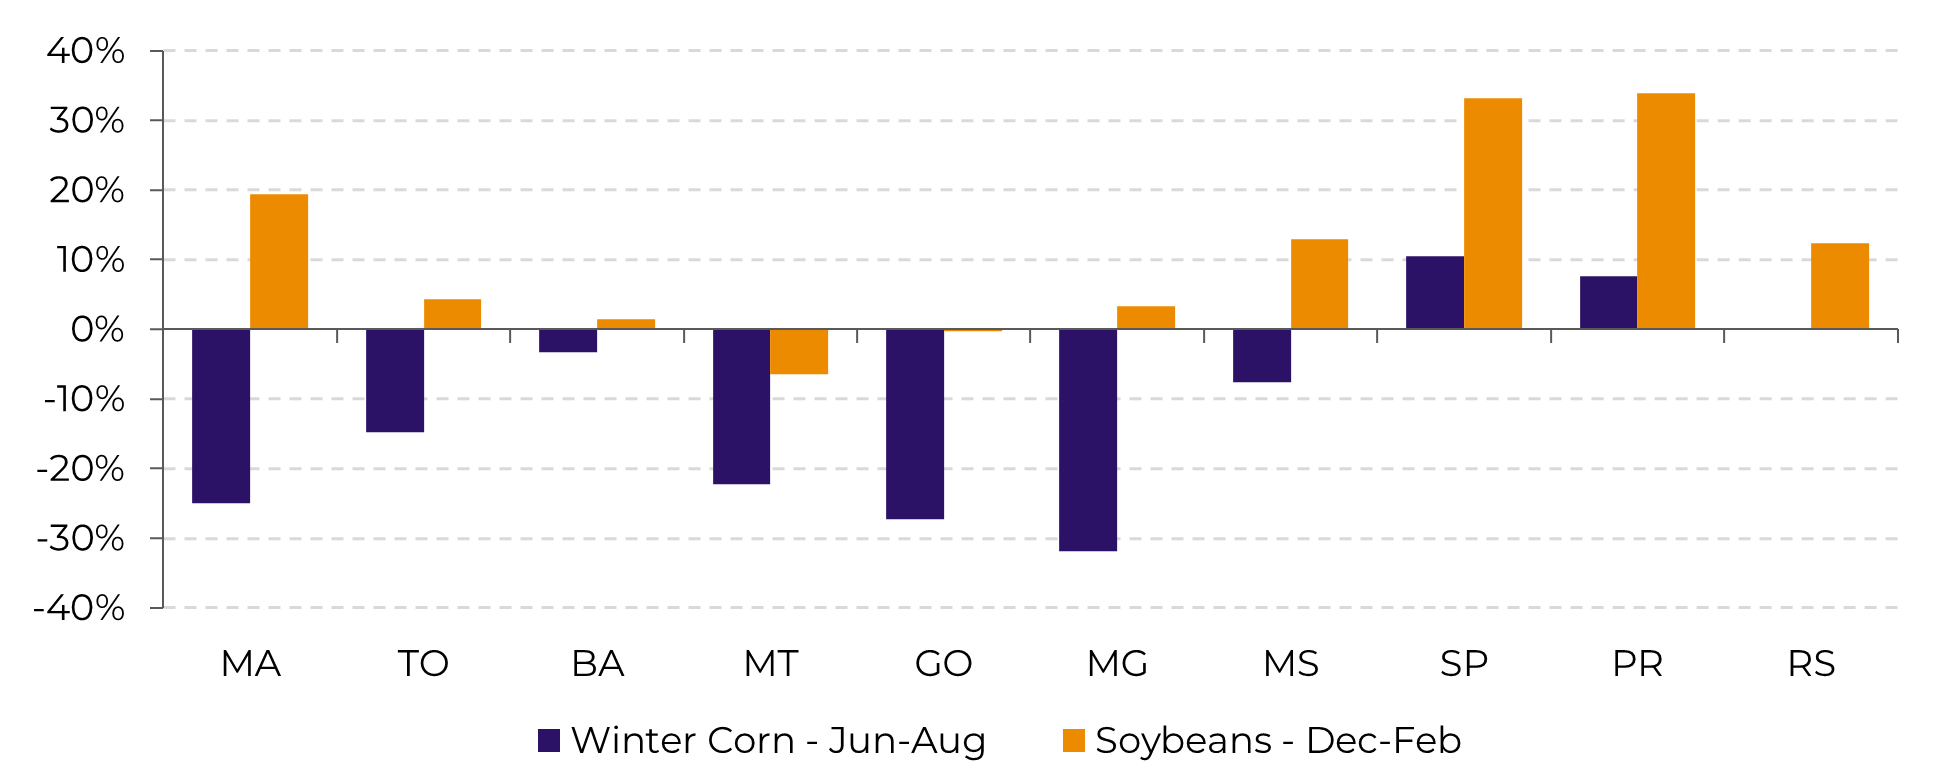
Source: hEDGEpoint Global Markets
As such, in years when
precipitation is good, winter corn yields also tend to be higher. However, when
it falters, the high temperatures can lead to losses. The issue is that Winter
is already the driest season in Brazil and, this cycle, several states planted
corn outside of the ideal window, which puts more pressure on crops. 22/23 is
still very likely to be a good crop, but the not-so-good news are starting to
pile up and they might stop Brazil from reaching the higher end of
expectations.
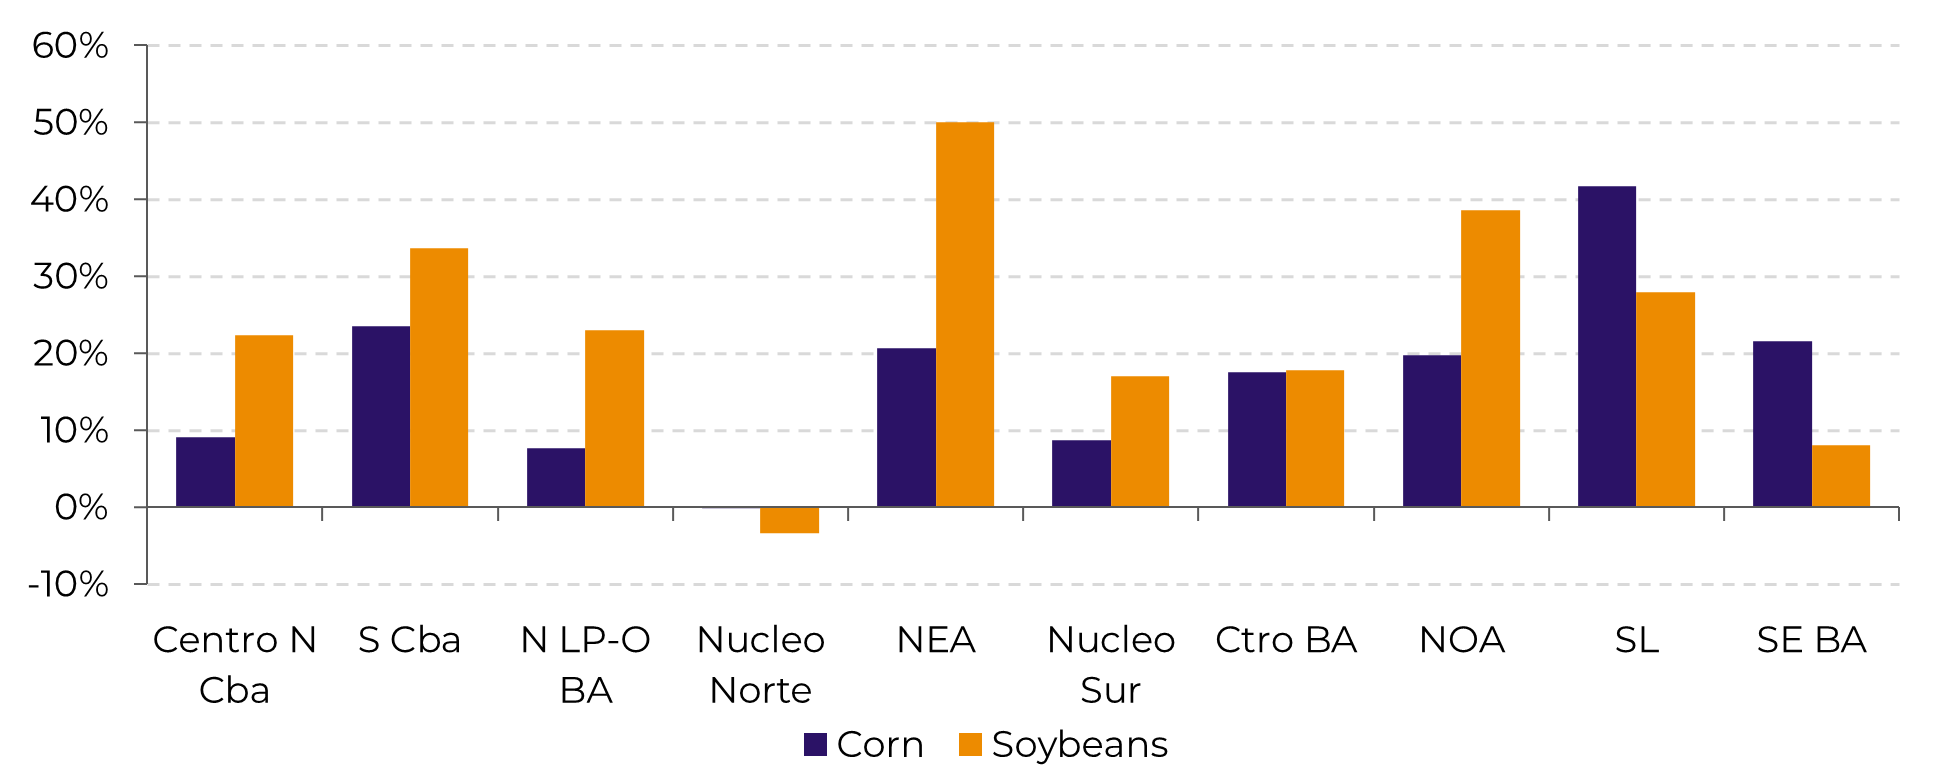
When it comes to the Spring/Summer (Sep-Feb), El Niño continues to bring warmth to most of Brazil and, interestingly, some coolness to Argentina. The event is also associated with higher-than-average precipitation in parts of the agricultural belt of Argentina and Southern Brazil. Although not highly correlated with the phenomenon, precipitation in the rest of Brazil was below normal in years when it was active.
Source:
Correlation between Argentina’s yield deviation from trend and El Niño Intensity
Source: hEDGEpoint Global Markets
Given this background, there’s a very clear divide between yields in Southern Brazil plus Argentina and the rest of Brazil. El Niño has had a positive influence in the first group and neutral in the second. However, we once again fall back to the same nuance: because El Niño is not as highly correlated with precipitation in the Center-West, it can lean either way. As such, this becomes a deciding factor that can pull the crop up or down. Of course, with hot weather being likely in the region, the impact of hydric stress over yields is increased.
Moving to the Black Sea, Ukraine may experience warmer temperatures and drier conditions during an El Niño event, which can lead to drought and decreased crop yields. The first official estimates for the 23/24 season already point to a crop that is almost half the size pre-war levels (42.1M mt in 21/22 vs 21.7M mt in 23/24) and stocks in the country are returning to pre-war levels, which means that any impact to yields from the El Niño can lead to a very tight situation in Ukraine.
Even though estimates are already working with lower yields due to war difficulties, the 6 mt/ha projection remains above yields witnessed in other El Niño years like 2009 and 2015, showing that there’s still room for deterioration. The situation just isn’t more alarming because the EU – a relevant importer of Ukrainian corn – will likely recover from last year’s crop failure, and the meteorological phenomenon brings a positive precipitation anomaly for most EU countries, so they will be less dependent on Ukrainian supplies.
Source:
Wheat
As wheat has a more
diversified production – regionally speaking – the El Niño phenomenon can have
significant impacts on wheat crops in the world's major producing and exporting
countries. Before we talk about the specific impact in each region, it’s
important to mention that La Niña was no longer active in March as the Niño 3.4
Region Index quickly changed into the ENSO neutral category and most key ENSO
drivers point toward very slow Pacific warming from this point forward, with
ENSO neutral positive conditions active in the June-August window.
In other words, El Niño will likely bring its weather anomalies from June onwards, which means it ought to have a minor influence in Northern Hemisphere’s winter crop. Consequently, countries like Canada, Russia, and the United States are major producers and exporters of wheat affected by the weather phenomenon, as spring wheat plays a relevant role in these countries’ supply. During an El Niño event, these countries can experience irregular rainfall patterns that can lead to droughts or increased precipitation in different regions, thus affecting wheat growth and quality.
Top
wheat exporters most affected by El Niño
5-year production average (M mt)
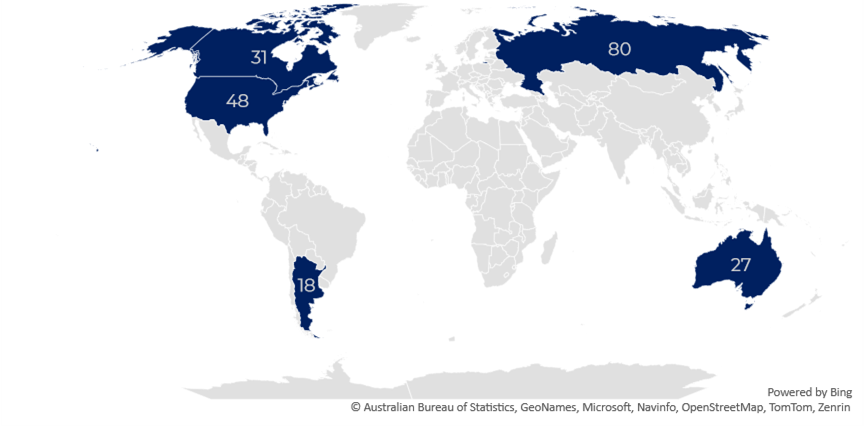
Source: USDA (23/24 is the current worst-case scenario estimate)
Canada, a leading wheat producer, can experience warm and dry weather in the southern prairies during El Niño years, leading to reduced wheat yields and quality. Conversely, in the northern parts of the country, increased rainfall and colder temperatures may also affect wheat crops negatively. As a result, Canadian farmers may face challenges in maintaining consistent wheat production and quality during El Niño years.
For this year, Canada can be the most impacted producer in the northern hemisphere, as spring wheat accounts for ~92% of the country’s output. Spring wheat there is sown between May and June and harvested in August – thus being much more exposed to this year’s El Niño than regular winter crops in the Northern Hemisphere.
In Russia, the top exporter of wheat in the world, El Niño brings cold and dry weather that is usually harmful for wheat yields. However, spring wheat accounts for ~26% of the country’s production and winter wheat is harvested in July – which means the Russian crop is less impacted by the phenomenon. Additionally, prospects for the winter crop are positive, and the carryover stocks are historically high as Russia comes from a record crop in 2022/23.
In the United States, El Niño’s impacts will likely be neutral to positive. Winter wheat will be nearing the harvest period, while the top spring wheat producing states – like Montana, North Dakota and Minnesota, that account for around 82% of the spring wheat output – usually receive above average precipitation and colder than usual temperatures. Even though spring wheat only accounts for 32% of US’ wheat production, higher yields generated by El Niño can partially offset the poor conditions witnessed in top producing states of winter wheat, such as Kansas. Given the record planted area expected for the 23/24 crop, the US is set to have a large wheat production in the season.
In the Southern Hemisphere, Argentina and Australia are the major wheat producers and exporters to be watched. For Argentina, the critical period for wheat development (Aug-Oct) is usually colder and wetter than usual, which should be positive for the country’s production. After facing the worst crop failure since 15/16, with the lowest yields since 08/09, El Niño will likely boost the recovery expected in 23/24. As the impact is quite the same for the Brazilian crop – the largest importer of Argentinian wheat – wheat prices in South America could witness a relevant bearish pressure during the marketing year.
On the other hand, Australia can experience reduced rainfall, increased temperatures, and longer dry spells during El Niño events, leading to lower crop yields and quality. In 2015-2016, Australia experienced one of the worst El Niño events on record, leading to a significant reduction in wheat production and exports.
Early estimates point that, in a worst-case scenario, the Australian crop can be 20M mt lower than the record crop of 39M mt seen in 22/23. This smaller crop in Australia, in addition to bring a very bullish pressure for wheat markets, can also cause relevant changes in the global trade flow. With the recent bumper crops, Australia has been the largest exporter of wheat to China, so a smaller crop will lead to more Chinese demand for Canadian and American wheat.
Source:
Australia Wheat Production and Yield (M mt, mt/ha)
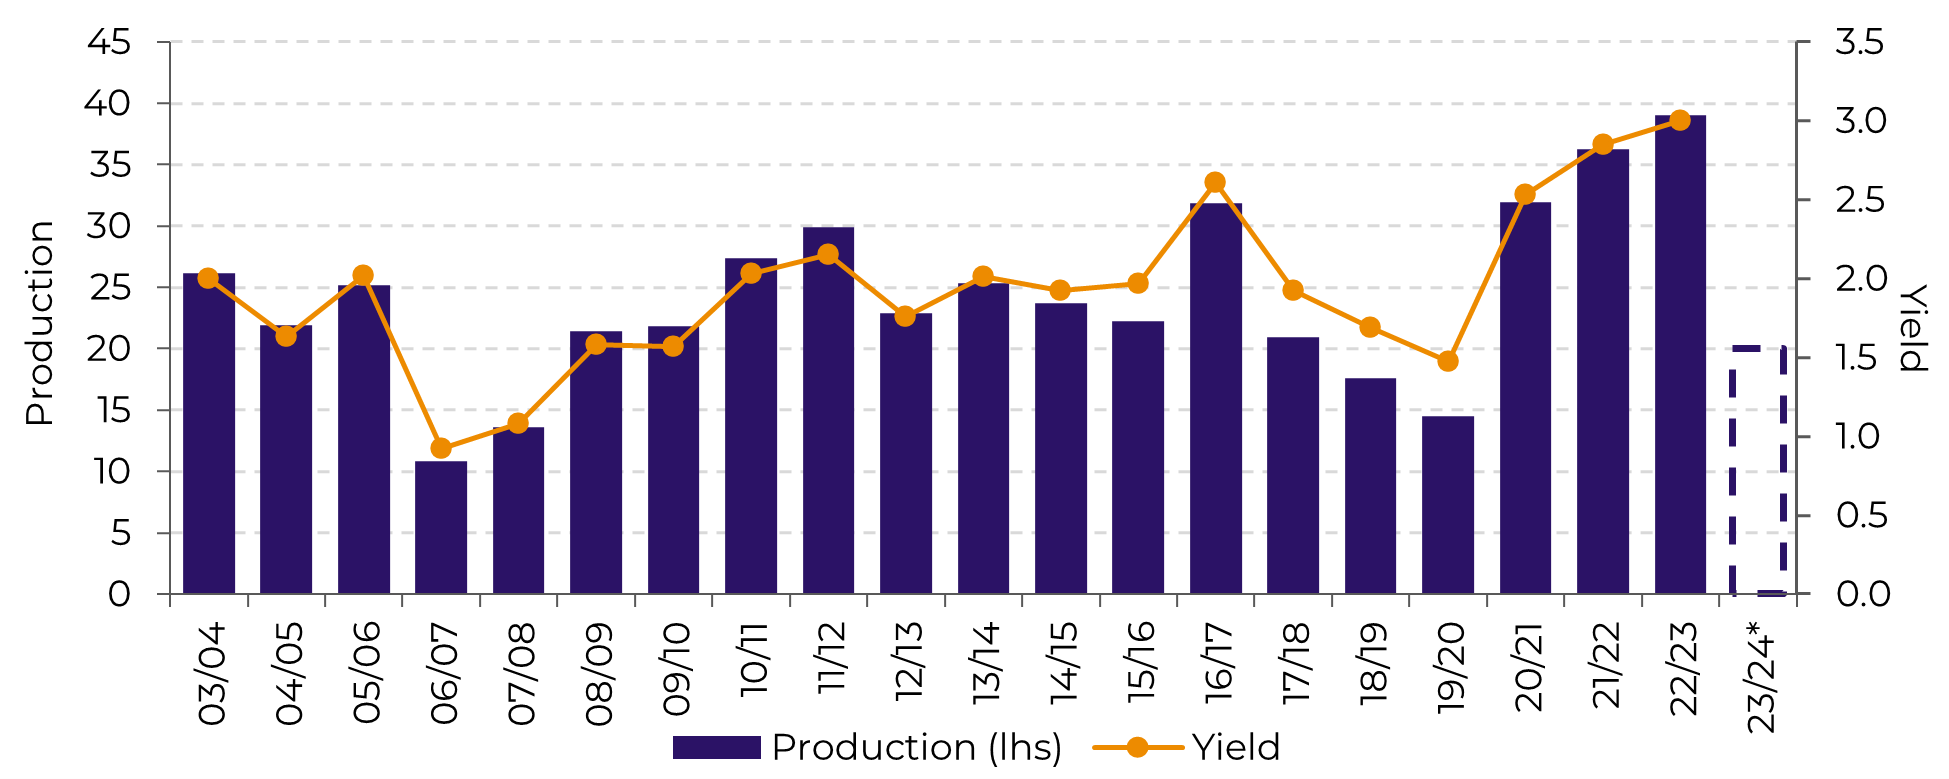
Source: USDA (23/24 is the current worst-case scenario estimate)
Source:
In Summary
Weekly Report — Multi-commodities
alef.dias@hedgepointglobal.com
livea.coda@hedgepointglobal.com
natalia.gandolphi@hedgepointglobal.com
pedro.schicchi@hedgepointglobal.com
thais.itailiani@hedgepointglobal.com

