
Remapping global sugar demand: what has changed?
- Global sugar demand growth is becoming increasingly structural, driven by demographic trends and income growth rather than cyclical dynamics.
- Emerging economies – particularly in Asia and Africa - are expected to account for the bulk of future consumption gains, according to FAO.
- Developed markets are likely to see slower growth amid rising health concerns and regulatory pressures.
- Sugar-sweetened beverage (SSB) taxes curb local beverage consumption, but their impact on aggregate sugar demand remains uncertain and uneven across countries.
- Overall, population and income growth continue to outweigh policy and lifestyle headwinds as the dominant long‑term demand drivers.
Remapping global sugar demand: what has changed?
Global sugar consumption dynamics are undergoing a gradual yet structural transformation, increasingly shaped by long‑term demographic trends, income growth, and evolving policy frameworks rather than short‑term cyclical forces. While global demand continues to expand, growth is becoming increasingly concentrated in emerging economies, where population growth and rising living standards still create room for further consumption gains. In contrast, mature markets face structurally weaker demand, reflecting demographic stagnation, shifting consumer preferences, and intensifying health‑related policy interventions.
In this report, we assess the key drivers behind sugar consumption
growth and examine the long-term trends reshaping global demand. For instance, the FAO projects global sugar consumption to grow at
around 1.2% per year, reaching approximately 202 Mt by 2034. According to the
agency, this expansion is primarily driven by demographic trends and income growth
rather than cyclical factors. From a pricing perspective, this demand
trajectory provides underlying support - particularly in scenarios where supply
growth falls short of expectations.
Demand growth is expected to be concentrated in low- and middle-income
regions, mainly across Asia and Africa, which together are projected to account
for roughly 93% of net global consumption gains. Rapid population growth,
accelerating urbanization, and income-driven dietary shifts are the key drivers
behind this trend. Given the still low per capita consumption levels in many of
these countries, sugar demand growth remains far from saturation, according to
the agency.
Conversely, high‑income economies are expected to exhibit structurally weak demand growth, acting as a bearish counterweight – though not a dominant one. In developed markets, slower population growth and evolving consumer preferences, reinforced by health concerns and public policy measures, are likely to keep sugar consumption broadly flat or on a mild downward trajectory. This trend is largely anticipated by the market and, therefore, has already been priced in, limiting its downside impact on prices.
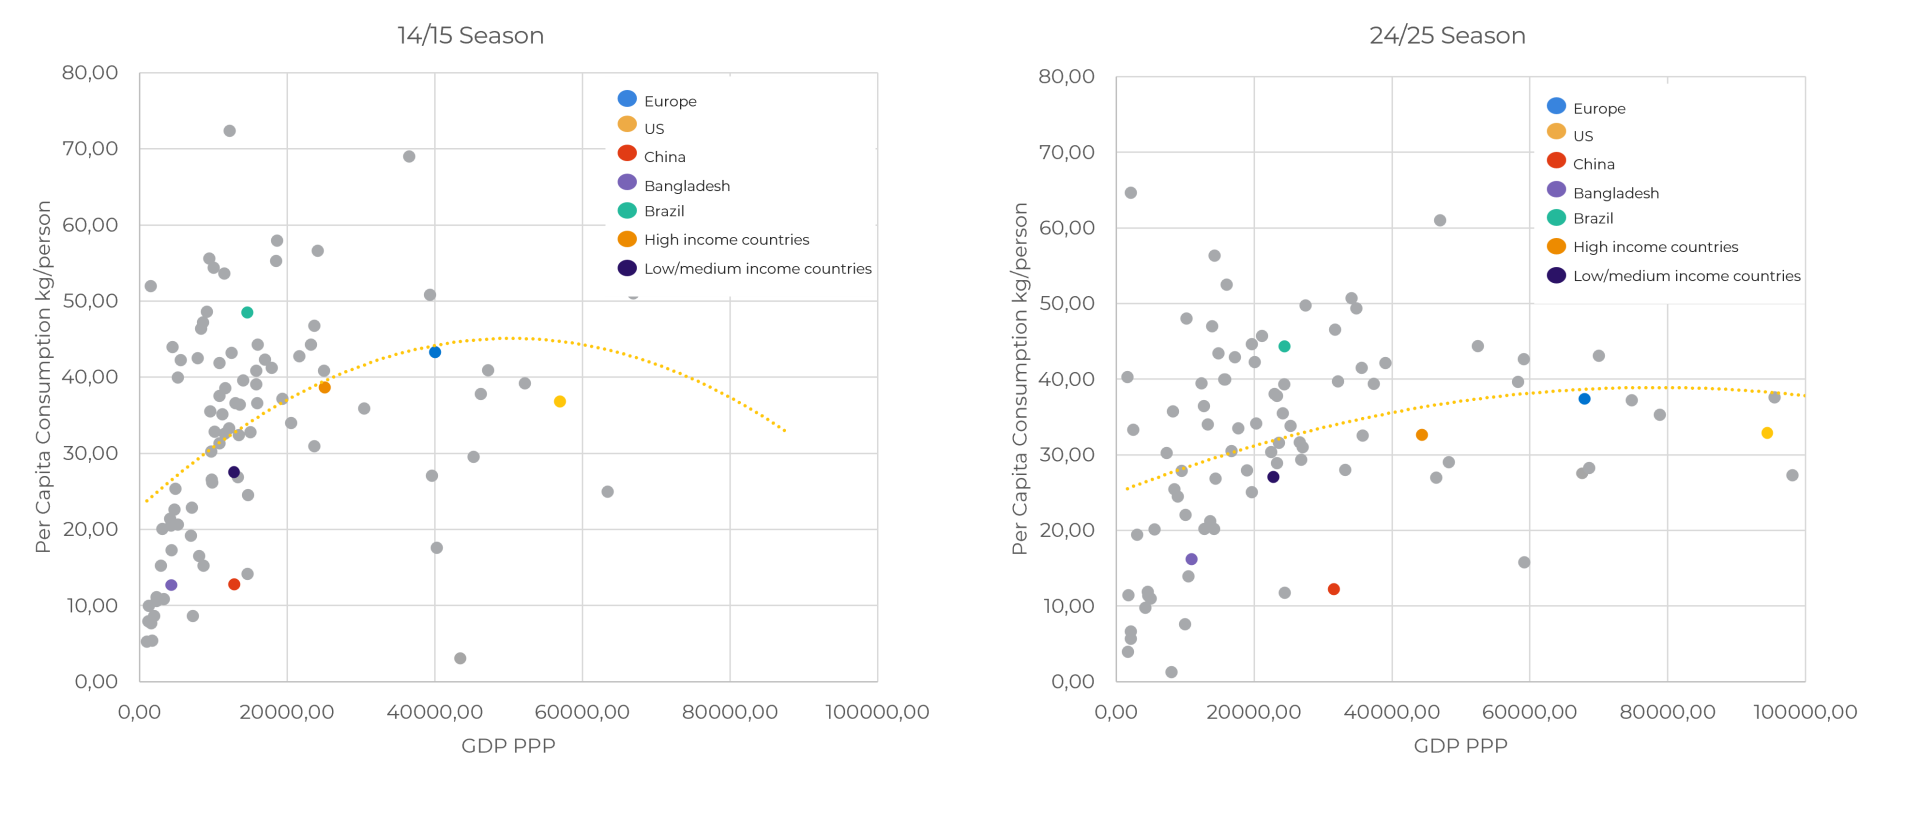
Consumption dynamics are thus closely tied to
income and population growth. As illustrated by the GDP (Purchasing Power
Parity) versus per capita consumption relationship, sugar intake increases rapidly
at lower income levels but gradually flattens as countries reach higher GDP
thresholds, where demand becomes increasingly inelastic to further income
gains. This saturation effect is evident in developed economies, where
consumption trends remain broadly stable despite higher income levels, while
emerging economies continue to exhibit significant catch‑up potential.
10-year Consumption: Per Capita Sugar Consumption versus GDP (PPP)
Source: IMF, Green Pool, Hedgepoint
However, inflationary pressures have already weighed on demand in some key markets - most notably India, which is expected to record a second consecutive year of consumption contraction. In addition, countries facing stagnant or declining populations continue to exert downward pressure on global consumption growth.
As a result, global sugar demand growth is estimated at just 0.4% in 2025/26 (Oct–Sep), diverging from the FAO’s projections. Looking ahead, demand growth is expected to recover only modestly, averaging around 0.77% in both the 2026/27 and 2027/28 seasons.
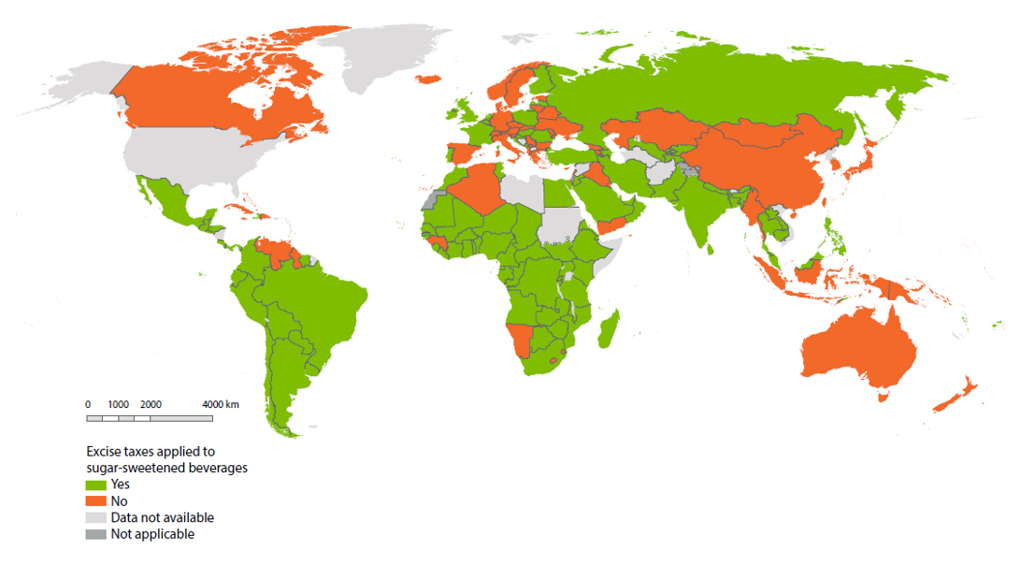
Another factor contributing to the deceleration in sugar consumption, in our analysis, stems from government-led tax and regulatory measures. While their effects are difficult to quantify precisely, most countries that have introduced restrictions have relied on mandatory product labelling and, more commonly, taxes on sugar sweetened beverages (SSBs). These policies are driven by the well-documented links between SSB consumption and major health concerns, such as obesity and related diseases, which raise public healthcare costs, as well as growing concerns over the addictive nature of these products.
The World Bank tracks the global implementation of SSB taxes and currently reports 119 national level taxes across 117 countries, covering roughly 57% of the world’s population. There is robust empirical evidence indicating that SSB taxation leads to lower consumption of these beverages. Mexico offers a clear example: as the first country in the Americas to adopt an SSB tax in 2014, empirical studies indicate a 6.3% decline in observed SSB purchases relative to expected levels, with a more pronounced reduction among low income households - reflecting their higher price elasticity (Colchero et al., 2017).
National-level excise taxes on sugar-sweetened beverages (July 2024)
Source: World Health Organization, 2025
While no study explicitly quantifies the direct pass-through from reduced
SSB consumption to aggregate national sugar intake, the relationship is
intuitive: the higher the levy, the stronger the impact on consumption. Direct
taxes on sugar itself do exist but remain extremely rare. Finland and Norway are
among the few examples, having implemented product‑based taxes – most notably
Norway, which taxes categories such as sugar, chocolate, confectionery, and
sweets.
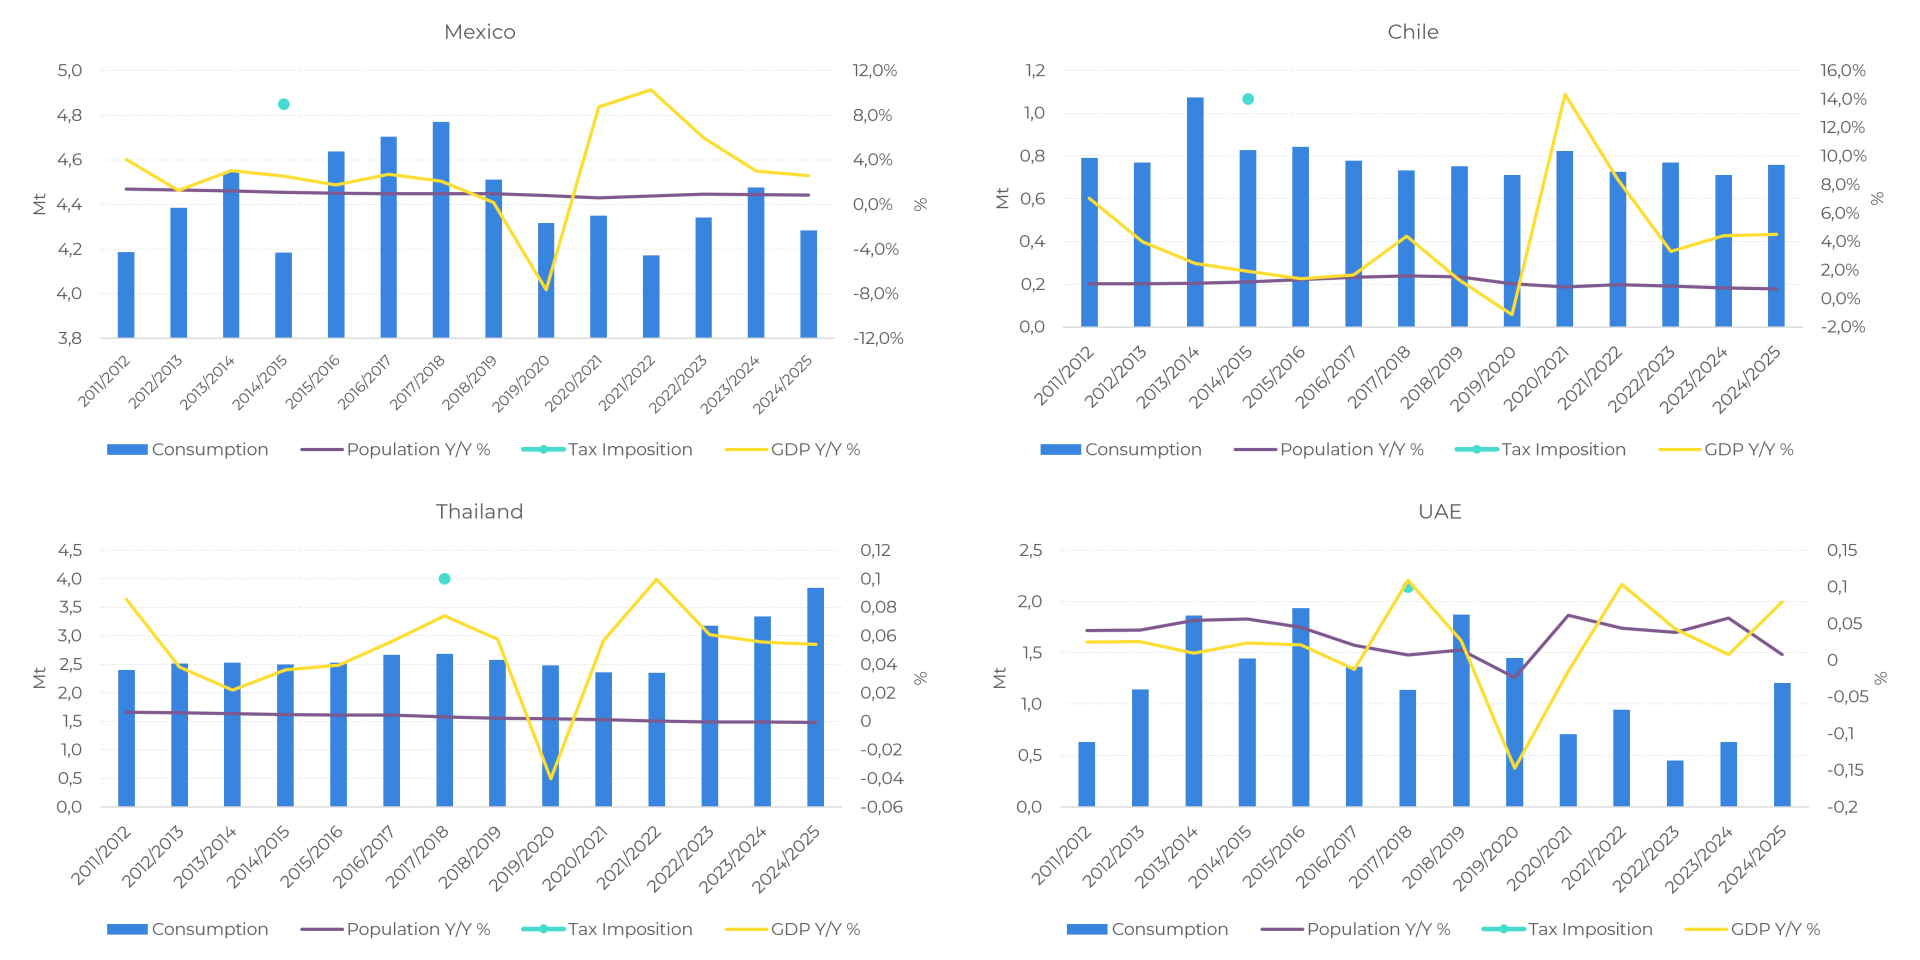
Nevertheless, when assessing the impact of SSB taxes on overall sugar
consumption at the country level, no clear or consistent pattern emerges. In
some cases, such as Mexico and Chile, an immediate deceleration in sugar consumption
is observed following the introduction of the tax. In others, however -
including Thailand and the UAE - similar effects are not easily identifiable,
suggesting that the transmission from beverage taxes to aggregate sugar demand
remains heterogeneous and context-dependent.
Tax imposition versus Consumption, Population Growth and GDP Growth
Source: IMF, USDA, Hedgepoint
While differences in tax design, coverage and enforcement undoubtedly matter, the lack of a consistent consumption response across countries suggests that the impact of SSB taxes on aggregate sugar demand is far from straightforward. This dispersion indicates that other structural forces exert a stronger influence on consumption trends. For instance, USDA data show that sugar consumption in Thailand has risen sharply in recent years – development that appears more closely linked to GDP growth and rising incomes than to the introduction of SSB taxation.
Weekly Report — Sugar
Reviewed by Thaís Italiani
thais.italiani@hedgepointglobal.com
Disclaimer
This document has been prepared by Hedgepoint Schweiz AG and its affiliates (“Hedgepoint”) solely for informational and instructional purposes, without intending to create obligations or commitments to third parties. It is not intended to promote or solicit an offer for the sale or purchase of any securities, commodities interests, or investment products.