
Sugar's Weather Rally: The Tightness Is Real, but It Is Concentrated
- A very strong El Niño and heavy Brazilian rain tightened short-term supply. Crops were hit in the EU, Thailand, India, Mexico, and Central America, while wet weather slowed the Center-South harvest.
- Macro amplified the rally but did not cause it. An oil-driven inflation scare sent funds into commodities, and they flipped sugar from net short to net long.
- October peaked above 18.5 c/lb but expired at 17.63 c/lb, while March 2027 trades above 20.5 c/lb. The tightness sits in the months before the next Brazilian crop.
- Demand has not confirmed the scarcity story: Chinese and Indonesian imports are softer, and Santos FOB premiums are discounted.
- Brazil's 2027/28 crop (43.8 Mt of sugar, up 5.3 Mt) is the natural release valve, unless the stress cases play out.
Sugar's Weather Rally: The Tightness Is Real, but It Is Concentrated
Think of 2026 as a weather story with a macro megaphone. Hot, dry weather cut production across the Northern Hemisphere, wet weather slowed the harvest in Brazil's Center-South, and money flowing into commodities made every headline louder. The result is a market that feels tight in the short term. Our global balance shows clearly: a 3.8 Mt surplus in 2025/26 turns into a 1.0 Mt deficit in 2026/27F.
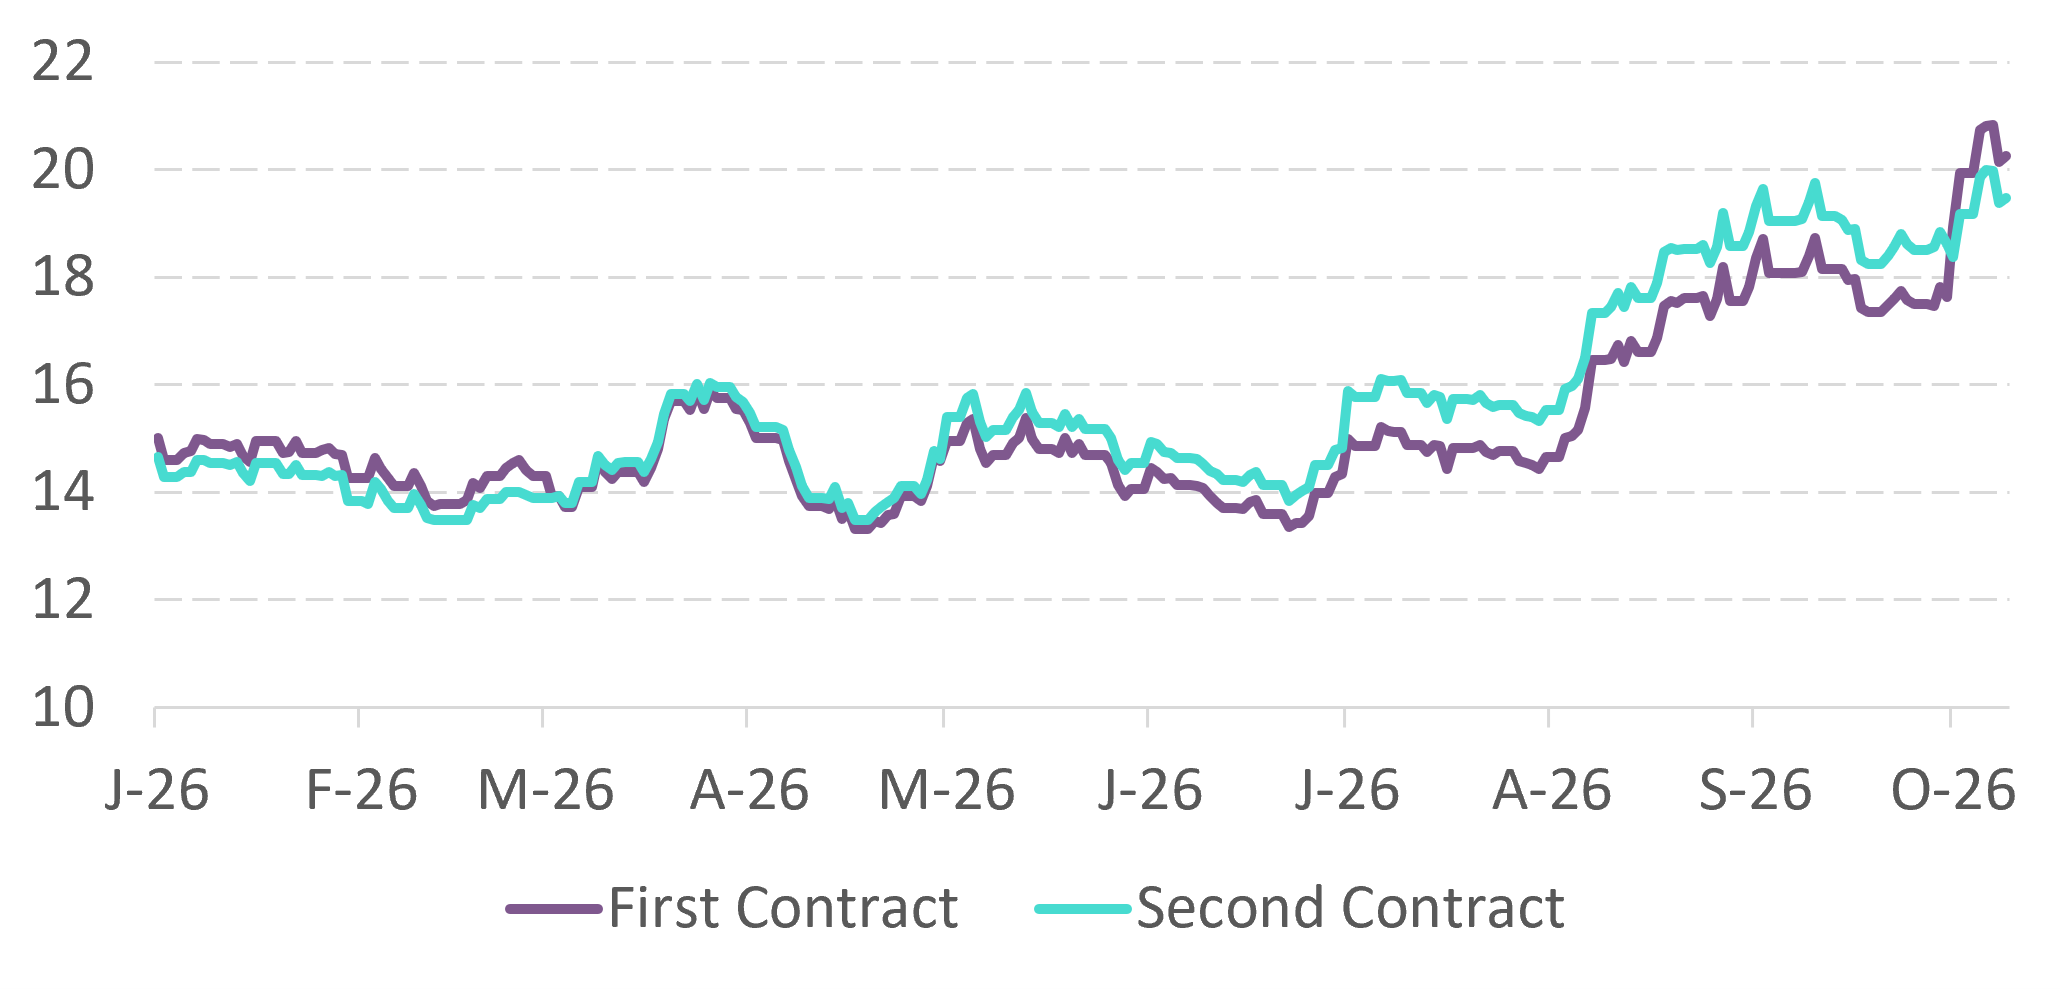
Prices tell the same two-speed story. October futures rallied above 18.5 c/lb driven by funds while Santos FOB premium remained subdued, then expired at 17.63 c/lb with neutral delivery as weak demand signals cooled the market. March 2027 traded above 20.5 c/lb, almost 3 c/lb higher than the October expiry. That gap could be perceived as the market paying up for sugar in the months before Brazil's next harvest, as the Q4-26 and Q1-27 are expected to be the tighter ones. In this report, we follow the chain from macro to each country, and ask one question every time: does this support prices now, or only until the next Brazilian crop?
Figure 1 – Raw sugar front contract: March jump
Source: Hedgepoint
1. Macro: the megaphone, not the cause
Starting with oil. As the Iran–US conflict escalated, oil prices surged, and US headline inflation climbed to 4.2% in May 2026, while core inflation stayed comparatively contained. When inflation runs hot, cash and bonds lose purchasing power, so funds rotate into hard assets. Commodities are a classic inflation hedge, and sugar was part of the buying: funds flipped from net short to net long as inflation worries grew and the fundamentals turned.
That flow was layered on top of the weather story and helped push October prices above 18 c/lb. Then the tone changed. The Fed held rates through the first half of 2026, then hiked 25 bp in September to 3.75–4.00%, its first hike in more than three years, judging that inflation had been too high for too long. Recession and demand-destruction worries returned, volatility rose with geopolitics and central-bank moves, and attention went back to exports, premiums and consumption. In short, macro helped start the rally, but it is no longer the main driver. From here, prices need physical sugar to back them up. Although the story was switching from comfort to tightness, October contract was never at risk of deficit as physical market remained subdue with discounts in key origins such as Brazil. But why is supply a concern?
2. The weather engine: a textbook El Niño year
3. Country by country: from weather and macro to price
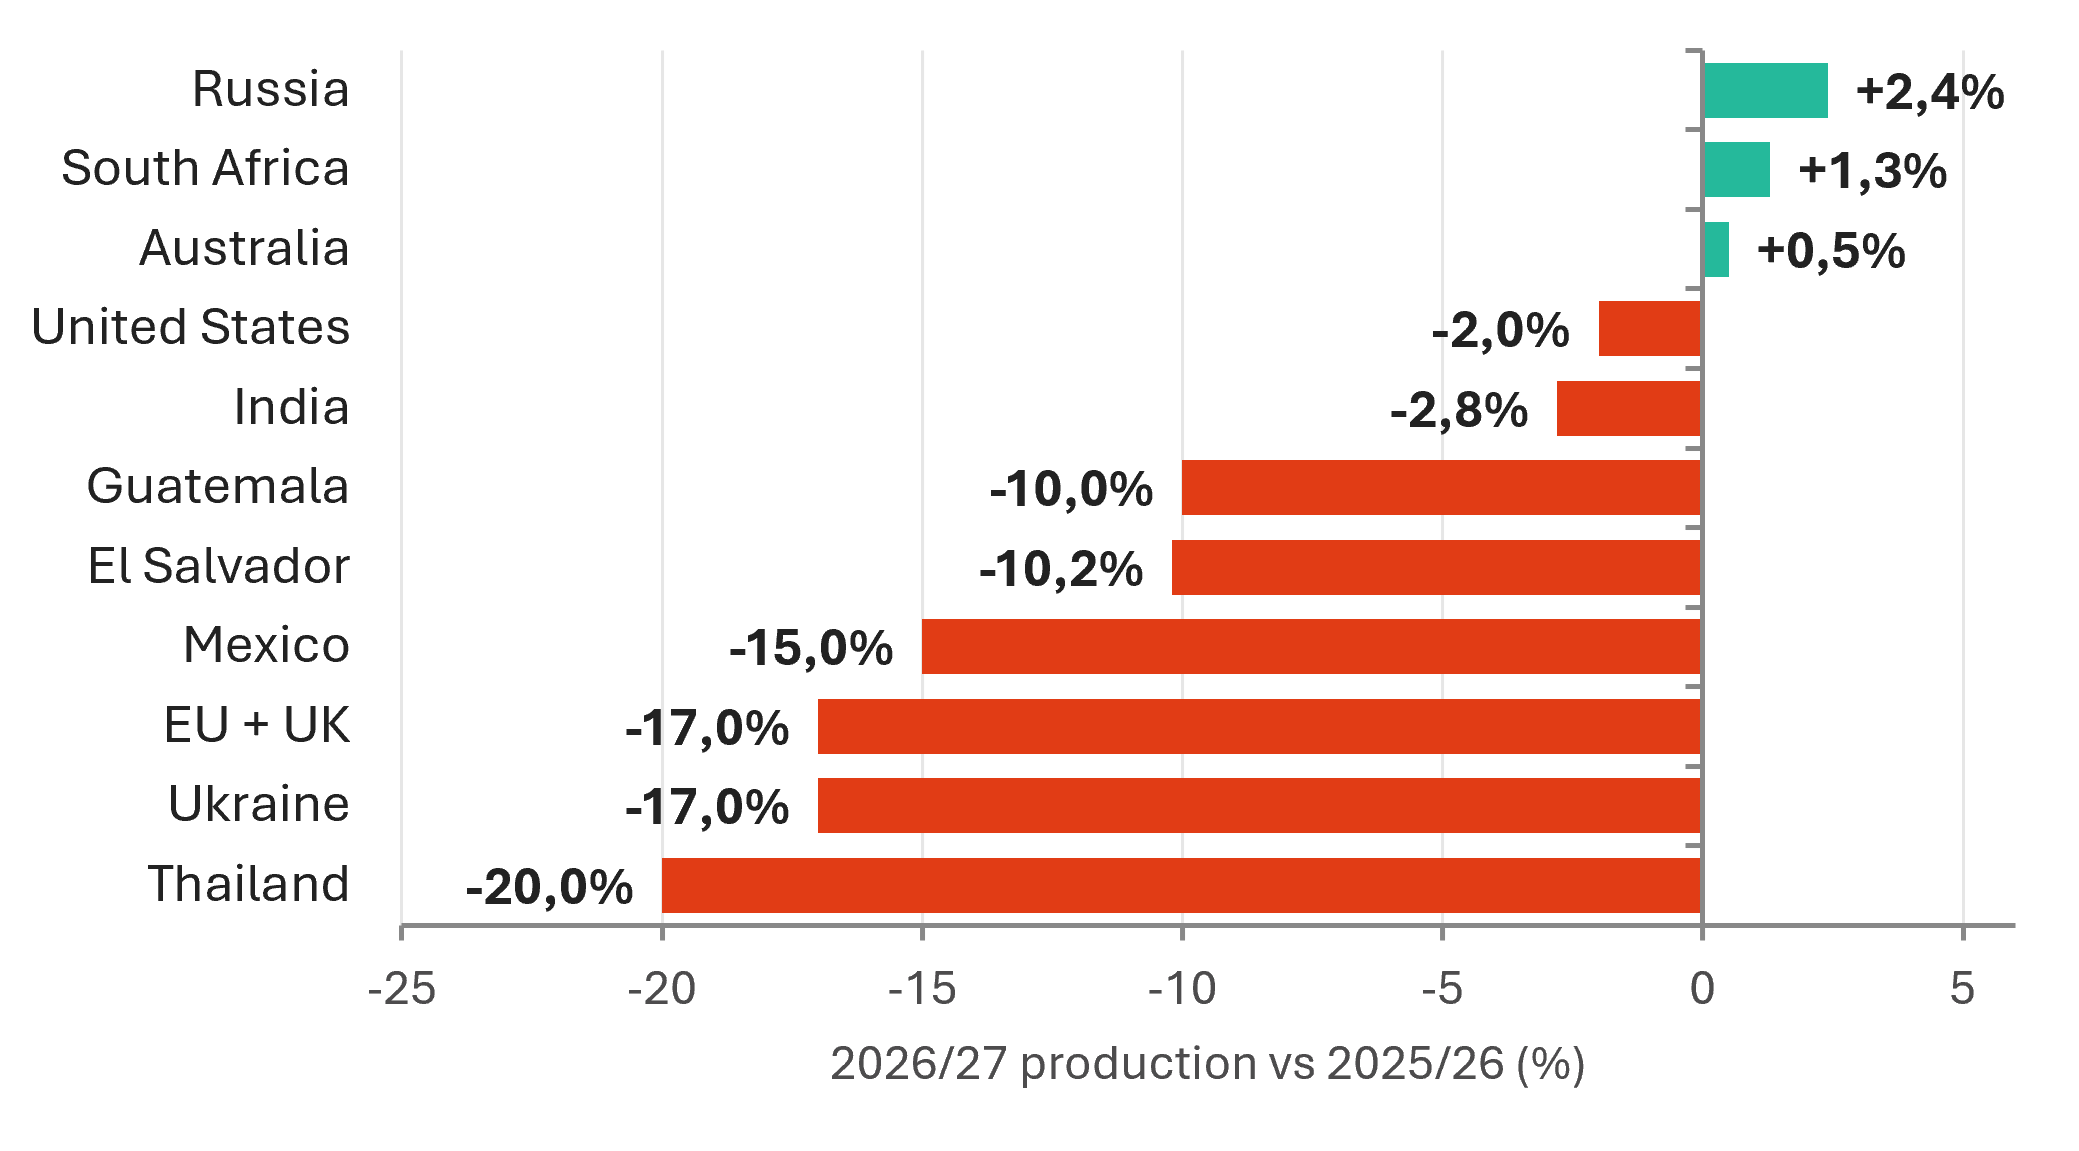
Figure 2 – 2026/27 production change versus 2025/26 (%)
Source: Hedgepoint
EU + UK: the heat bill. Back-to-back heatwaves and dry conditions in France, Germany and Poland squeezed beet yields. The European Commission cut its 2026/27 EU production estimate from 14.1 Mt to 13.4 Mt, and our own figure is lower still at 13.1 Mt (considering the UK and already net from ethanol). Area is projected to be down 9% compared to the previous season, while yield should be corrected by at least 8%. In our balance (white value), output falls 17% from 15.8 Mt to 13.1 Mt between seasons, imports rise from 1.6 Mt to 2.5 Mt, exports drop from 1.7 Mt to 0.6 Mt, and ending stocks shrink from 3.0 Mt to 2.1 Mt. Europe will also need more high-quality white grades.
Our projections for EU+UK are, therefore, supportive for prices, especially white sugar, as the region is an important player of this quality. Another discussion worth mentioning and monitoring is the possible slow recovery from area loss. Beet is known for having lost farmers’ interest over the past years and, therefore, it is fair to expect that the region will remain with a reduced production capacity going forward.
Thailand: the biggest cut to exports. Rainfall was below average in June and August, with only a brief reprieve in September. October looks drier, and rain is forecast for November, just when crushing could start. We now see 88 Mt of cane, about 9.5 Mt of sugar (down 20%), and exports of about 6.2 Mt, down 30% from 8.7 Mt projected for 2025/26. Lower availability from the country into the international market should also act as a supportive factor. Since the biggest bulk of exports usually happens from February until June, the country’s reduction is specially supportive for March and May 2027 contracts.
India: where macro, weather and policy meet. Production is seen slipping from 28.4 Mt to 27.6 Mt against consumption of about 28.2 Mt, which squeezes stocks. The government is moving first to protect supply, with limits on dealer stocks and ethanol diversion of 3 Mt or less, both aimed at keeping imports down. About 500 kt of imports are expected to have been imported during 2025/26. These measures already resulted in the domestic prices returning to more usual levels. However, what could happen if India produces even less? An extremely dry August–September could push India to import another 500 kt or more in 2026/27 (to March). That would tighten trade flows, support prices, and could push Brazil to make more sugar. Of course, one might argue that at current international prices it could be difficult to see import movements from the country, but if the crop pace disappoints, stocks are pressured, and domestic prices might respond.
As a result, India is the swing factor. Policy curbs work against more imports, and a worse crop would possibly force them, adding to the current market tightness and supporting nearby contracts.
Mexico and Central America: highest El Niño exposure. Mexico is estimated at 4.6 Mt (down 15%), Guatemala at 2.5 Mt (down 10%), and El Salvador at 0.7 Mt (down 10.2%). Forecasts remain unfavorable, even if irrigation helps. These results add more weight during the peak of the Northern Hemisphere season, usually reflected in the March and May contracts, coincident with Center-South’s intercrop.
The rest of the world: mixed, tilted to the downside. Ukraine’s sugar production is expected to fall 17% to 1.4 Mt because of EU quota cuts, reduced area, and adverse weather. Russia could rise by 2.4% to 6.5 Mt in 2026/27, but frost and moisture deficits limited gains despite good crop conditions. The United States is at 8.1 Mt (down 2%), South Africa at 2.1 Mt (up 1.3%), and Australia at 4.0 Mt (up 0.5%). The small gains are not enough to offset the losses elsewhere, making the rest of the world supply story constructive for prices.
4. Brazil: this year's rain, next year's crop
Brazil is the one big origin where the problem is being too wet, not too dry. In the first half of September, about 30.1 Mt of cane were crushed, well below the pace of recent seasons. MAPA data show a weak pace in line with an estimated seven days of operational disruptions. Quality is weak too: TRS was 149.6 kg/t, around 7 kg/t below the five-year average of 156.3 kg/t, and the sugar mix was about 49.3% against 53.5% last season. This matters because sugar still has a clear pricing edge over ethanol. Mills want to make sugar, but the weather is holding them back.
5. Demand: the missing confirmation
- China: production is forecast at 13.0 Mt in 2025/26 and 12.9 Mt in 2026/27, helped by higher cane yields (61.6 to 67 t/ha). The Chinese Ministry of Agriculture sees imports easing to 4.8 Mt in 2026/27, and we are more conservative at 4.0 Mt.
- Indonesia: raw sugar imports are now expected to be noticeably lower than projected at the start of the year. USDA attributes this to policy and to adequate domestic white sugar after a strong prior season. Poor rain during the 2026/27 development could raise import needs later.
- Europe (whites): the opposite case. The region will need more imports in 2026/27, especially high-quality grades, after its crop failure.
- West Africa and others: Ghana and Ivory Coast are expected to import less white sugar, which is a macro story, not a fundamental one. Angola's lower oil output has pressured the kwanza and its purchasing power, and other destinations may be affected by the Iran–US conflict.
6. The global balance: tight in the short term, not forever
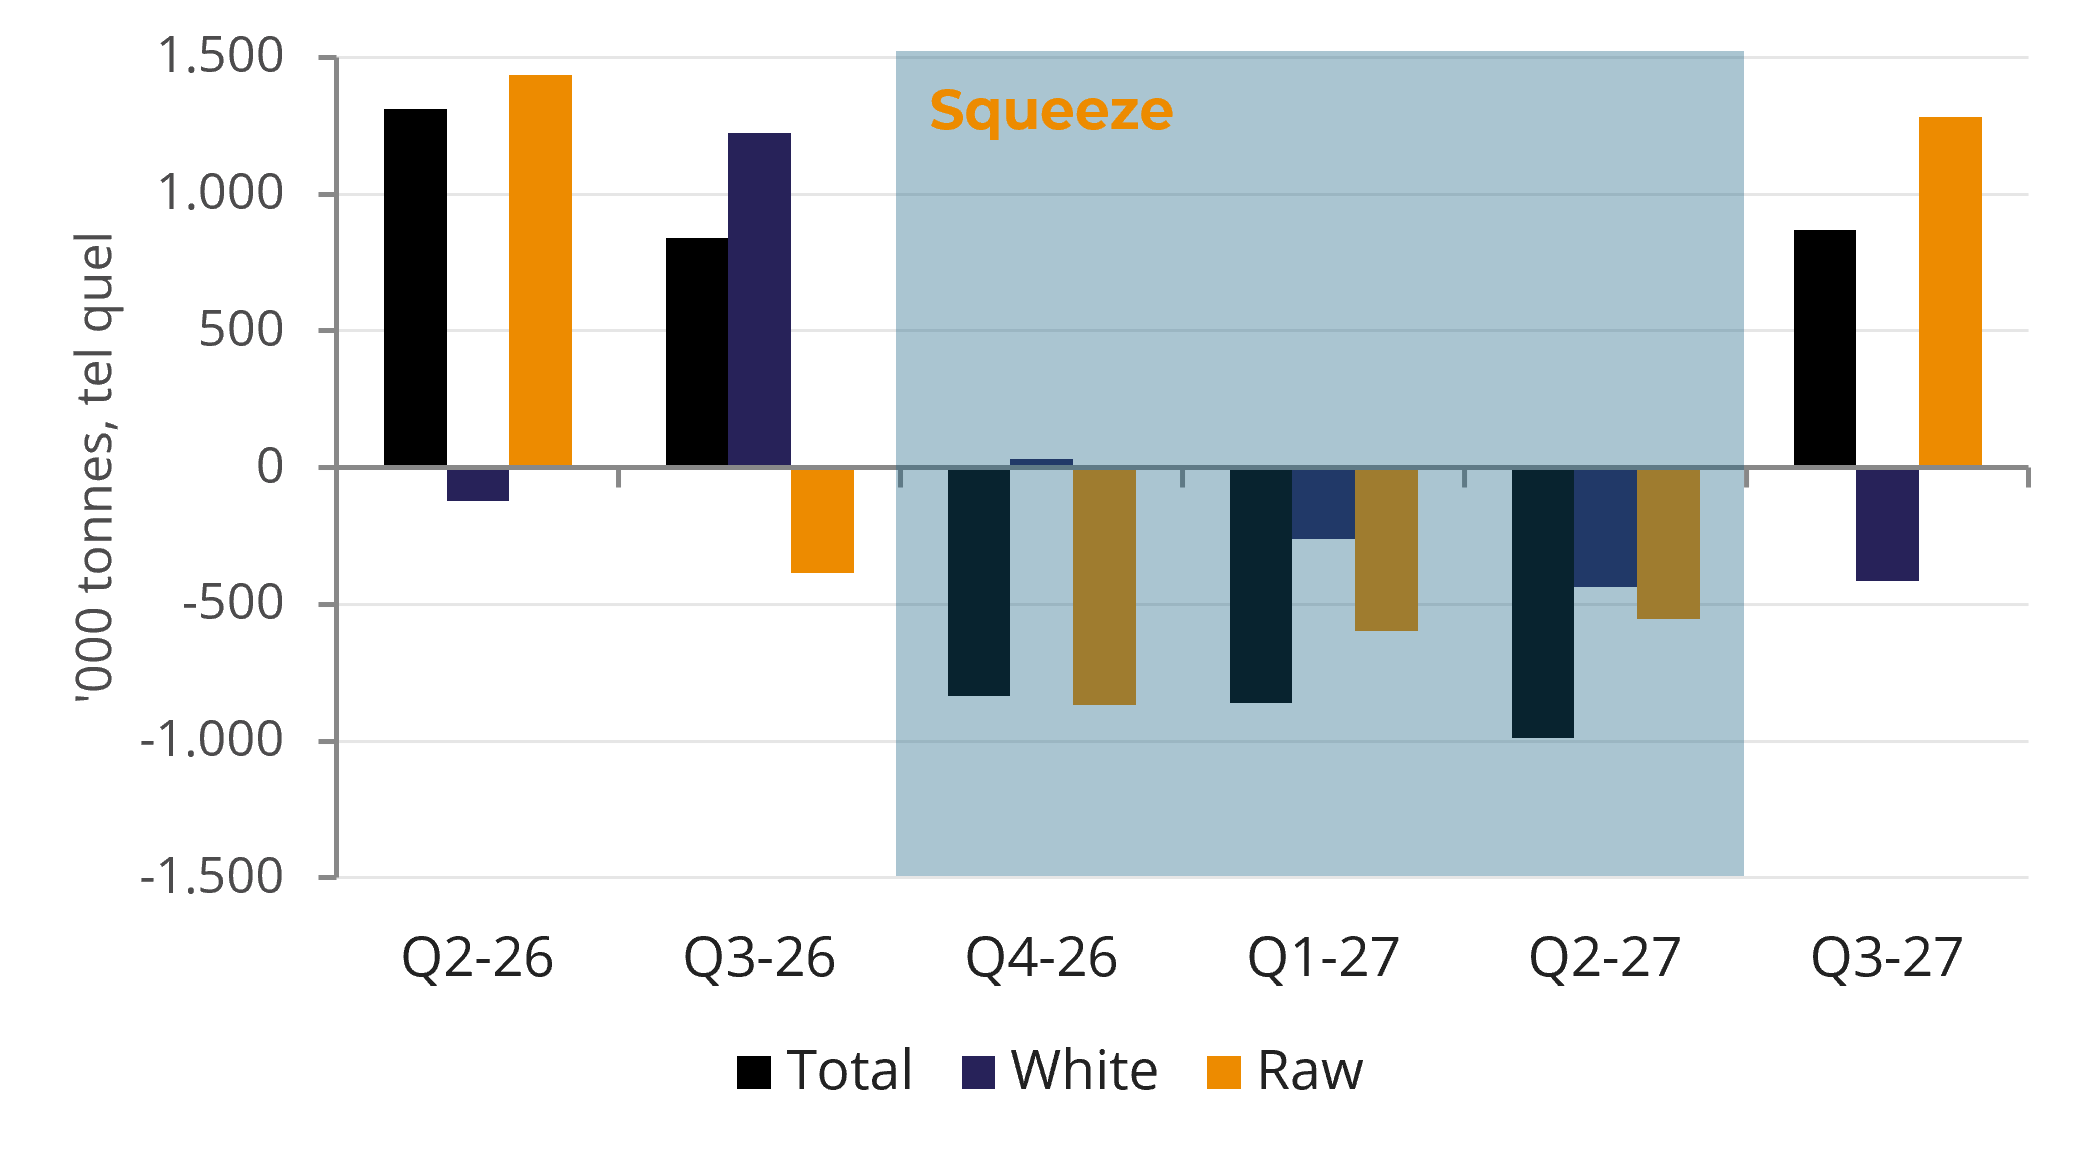
Figure 3 – Quarterly net trade flows ('000 tonnes, tel quel)
Source: GreenPool, Hedgepoint
The split between raws and whites matters. Lower Brazilian availability hits raws first and whites later, while Northern Hemisphere losses hit whites directly. That is why whites stay negative in every quarter from Q1-27 and why the white market remains the tighter of the two for now. Across the full window from Q2-26 to Q3-27, the net result is +330 kt, so the market is more balanced, not in outright shortage.
7. Stress tests: what would extend the rally
- Stress 1 – Brazil crushes less. Using 2015/16 as a weather proxy, crushing slips from 635.5 Mt to 627.6 Mt and sugar falls from 38.5 Mt to 37.8 Mt. Some cane carries over, lifting 2027/28 to 663.0 Mt of cane and 44.1 Mt of sugar. Even so, trade flows lose about 424 kt versus base and move to a deficit of about 100 kt, mostly in raws.
- Stress 2 – TRS also fails to recover. If TRS drops to 133.0 kg/t, following the 2015/16 trend, sugar falls to 37.2 Mt and trade flows reach −800 kt, again mostly raws. This is the bigger real risk because quality, not just volume, erodes the balance.
- Stress 3 – India imports more too. An extra 500 kt, split across Q4-26 and Q1-27, widens the deficit to 1.3 Mt. It would push the March 2027 contract, keep bullish momentum alive for longer, and likely push Brazil's sugar mix higher than currently modeled.
Figure 4 – Global trade-flow balance by scenario ('000 tonnes)
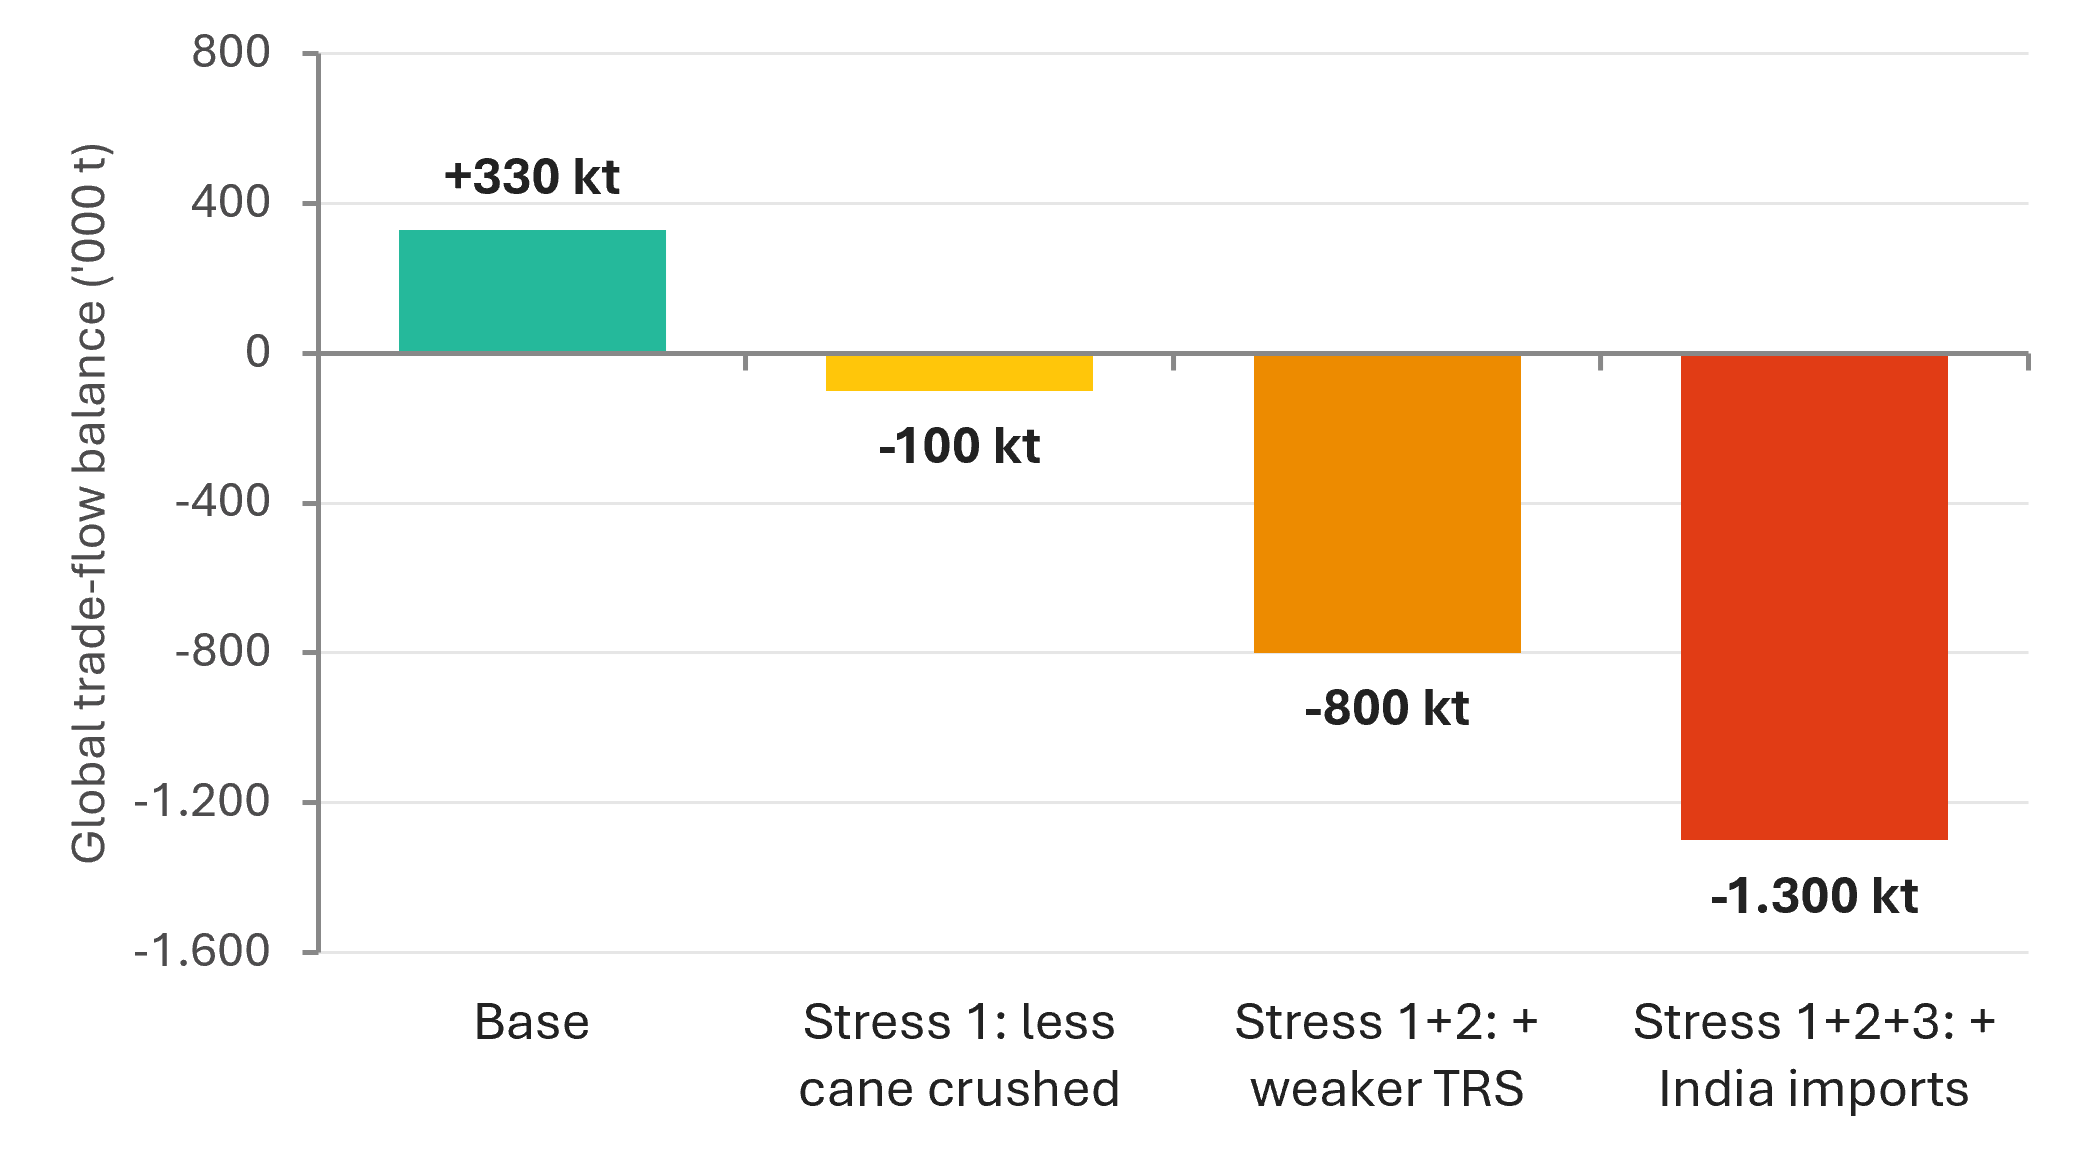
Source: GreenPool, Hedgepoint. Base is the Q2-26 to Q3-27 total; stress results from our stress-case analysis.
Figure 5 – Summary
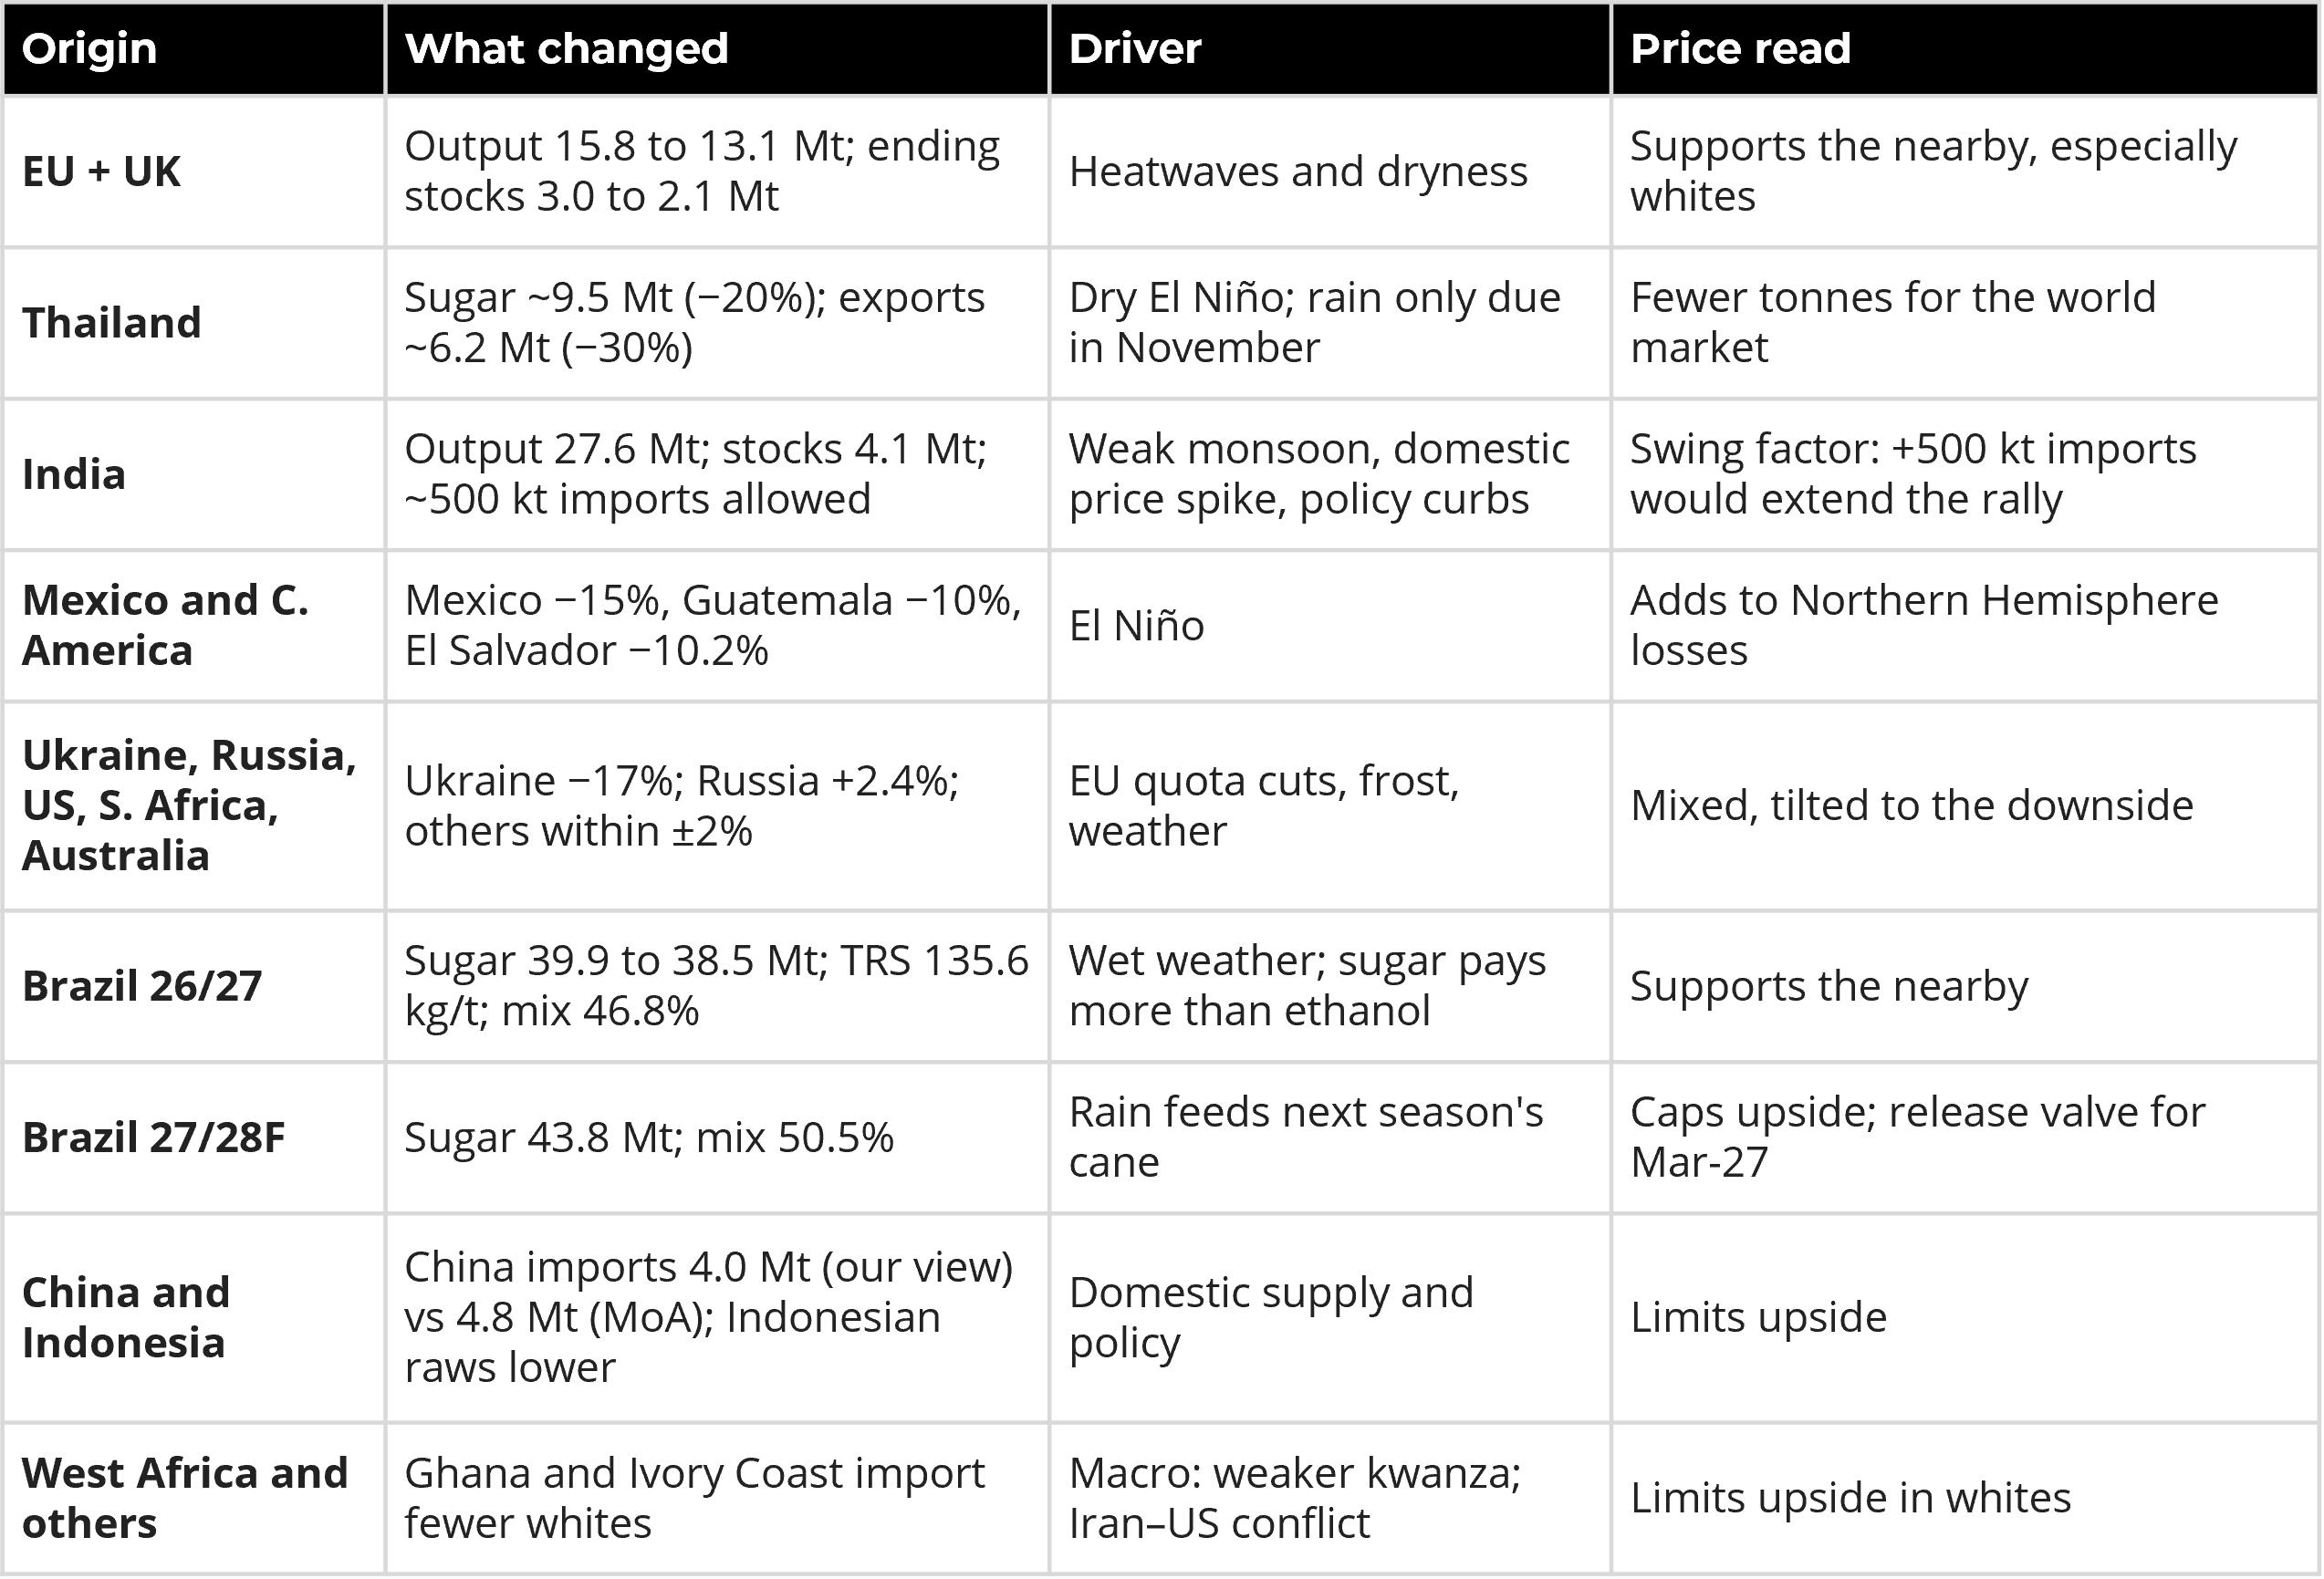
Source: Hedgepoint
Summary
Weekly Report — Sugar
Reviewed by Laleska Moda
laleska.moda@hedgepointglobal.com
Disclaimer
This document has been prepared by Hedgepoint Schweiz AG and its affiliates (“Hedgepoint”) solely for informational and instructional purposes, without intending to create obligations or commitments to third parties. It is not intended to promote or solicit an offer for the sale or purchase of any securities, commodities interests, or investment products.
Hedgepoint and its associates expressly disclaim any liability for the use of the information contained herein that directly or indirectly results in any kind of damages. Information is obtained from sources which we believe to be reliable, but we do not warrant or guarantee the timeliness or accuracy of this information.
The trading of commodities interests, such as futures, options, and swaps, involves substantial risk of loss and may not be suitable for all investors. You should carefully consider wither such trading is suitable for you in light of your financial condition. Past performance is not necessarily indicative of future results. Customers should rely on their own independent judgment and/or consult advisors before entering into any transactions.
Hedgepoint does not provide legal, tax or accounting advice and you are responsible for seeking any such advice separately.
Hedgepoint Schweiz AG is organized, incorporated, and existing under the laws of Switzerland, and a member of ARIF. ARIF (Association Romande des Intermédiaires Financiers) is a self-regulatory organization approved by the Swiss Financial Market Supervisory Authority (FINMA) for the supervision of financial intermediaries covered under Article 2, paragraph 3, of the Swiss Federal Act on Combating Money Laundering and Terrorist Financing in the Financial Sector (AMLA). Hedgepoint Commodities LLC is organized, incorporated, and existing under the laws of the USA, and is authorized and regulated by the Commodity Futures Trading Commission (CFTC) and a member of the National Futures Association (NFA) to act as an Introducing Broker and Commodity Trading Advisor. Hedgepoint Global Markets Limited is Regulated by the Dubai Financial Services Authority. The content is directed at Professional Clients and not Retail Clients. Hedgepoint Global Markets PTE. Ltd is organized, incorporated, and existing under the laws of Singapore and is classified as exempted from holding a capital markets services licence under paragraph 3A(1)(d) of the Second Schedule to the Securities and Futures (Licensing and Conduct of Business) Regulations (Rg 10). Hedgepoint Global Markets DTVM Ltda. is authorized and regulated in Brazil by the Central Bank of Brazil (BCB) and the Brazilian Securities Commission (CVM). Hedgepoint Serviços Ltda. is organized, incorporated, and existing under the laws of Brazil. Hedgepoint Global Markets S.A. is organized, incorporated, and existing under the laws of Uruguay.
In case of questions not resolved by the first instance of customer contact (client.services@Hedgepointglobal.com), please contact internal ombudsman channel (ombudsman@hedgepointglobal.com – global or ouvidoria@hedgepointglobal.com – Brazil only) or call 0800-8788408 (Brazil only).
Integrity, ethics, and transparency are values that guide our culture. To further strengthen our practices, Hedgepoint has a whistleblower channel for employees and third-parties by e-mail ethicline@hedgepointglobal.com.
“Hedgepoint” and the “Hedgepoint” logo are marks for the exclusive use of Hedgepoint and/or its affiliates. Use or reproduction is prohibited, unless expressly authorized by Hedgepoint.
Furthermore, the use of any other marks in this document has been authorized for identification purposes only. It does not, therefore, imply any rights of Hedgepoint in these marks or imply endorsement, association or seal by the owners of these marks with Hedgepoint or its affiliates.