Sep 5 / Lívea Coda

Sugar and Ethanol Monthly Report - 2023 09 05

  Back to main blog page
"The current spread structure reflects greater short-term availability (Brazil) and restricted participation from the Northern Hemisphere in early 2024, with a negative V23/H24 and an inverted curve from H24 onwards."

S&D and Trade Flow

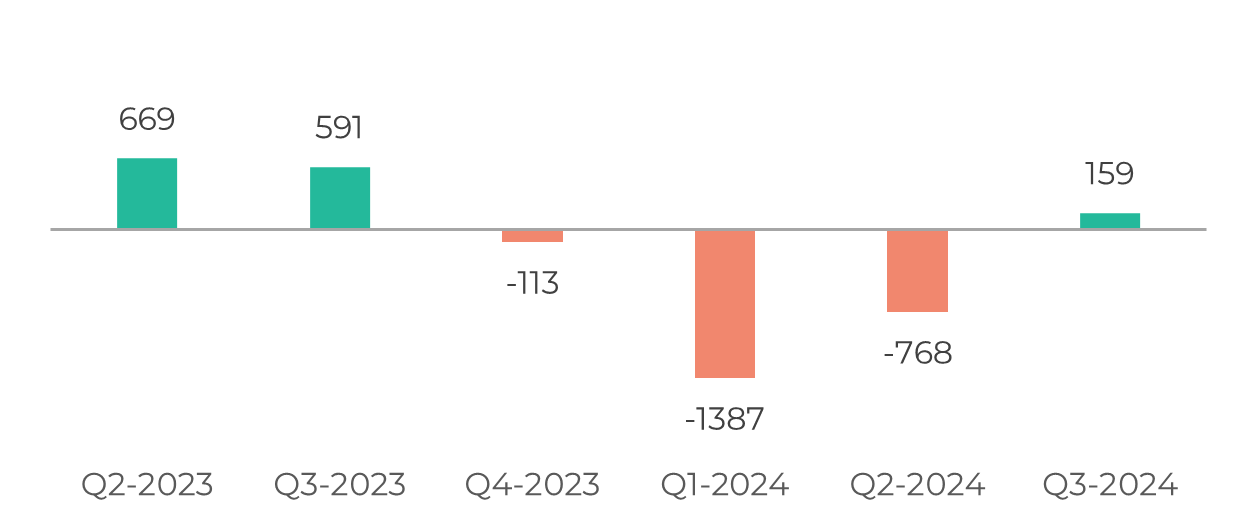
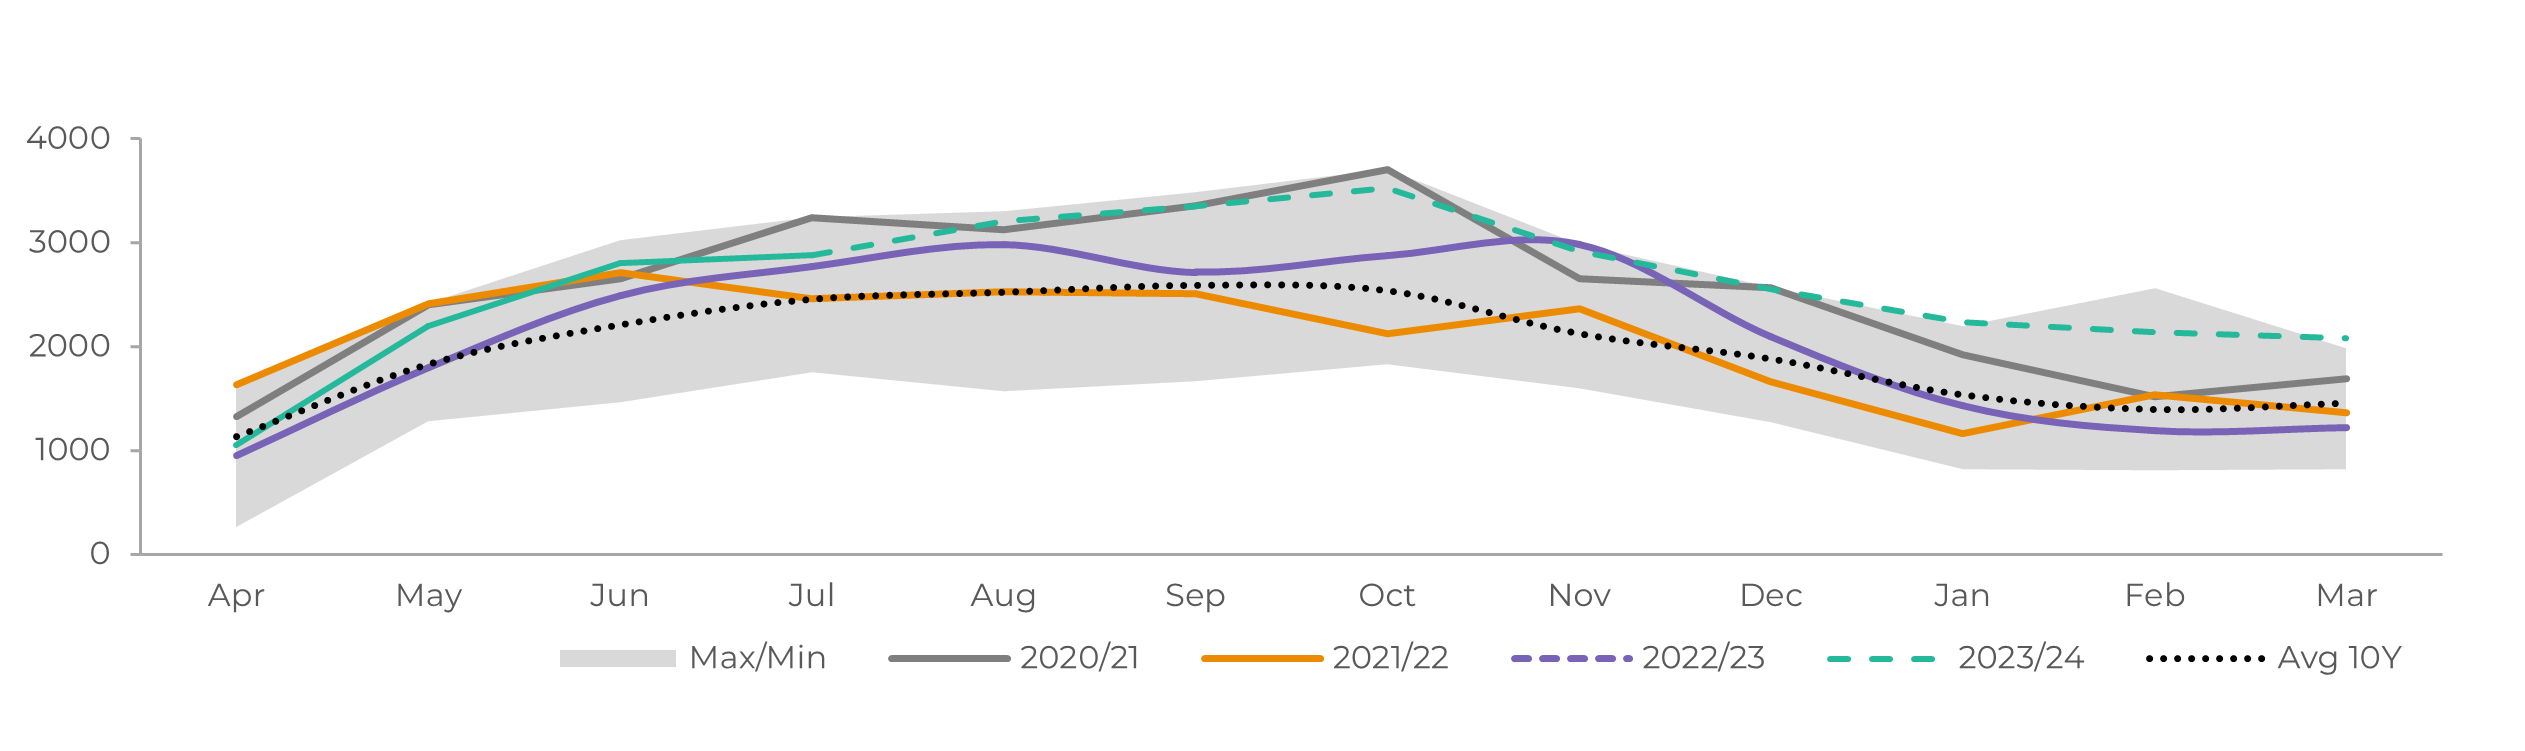
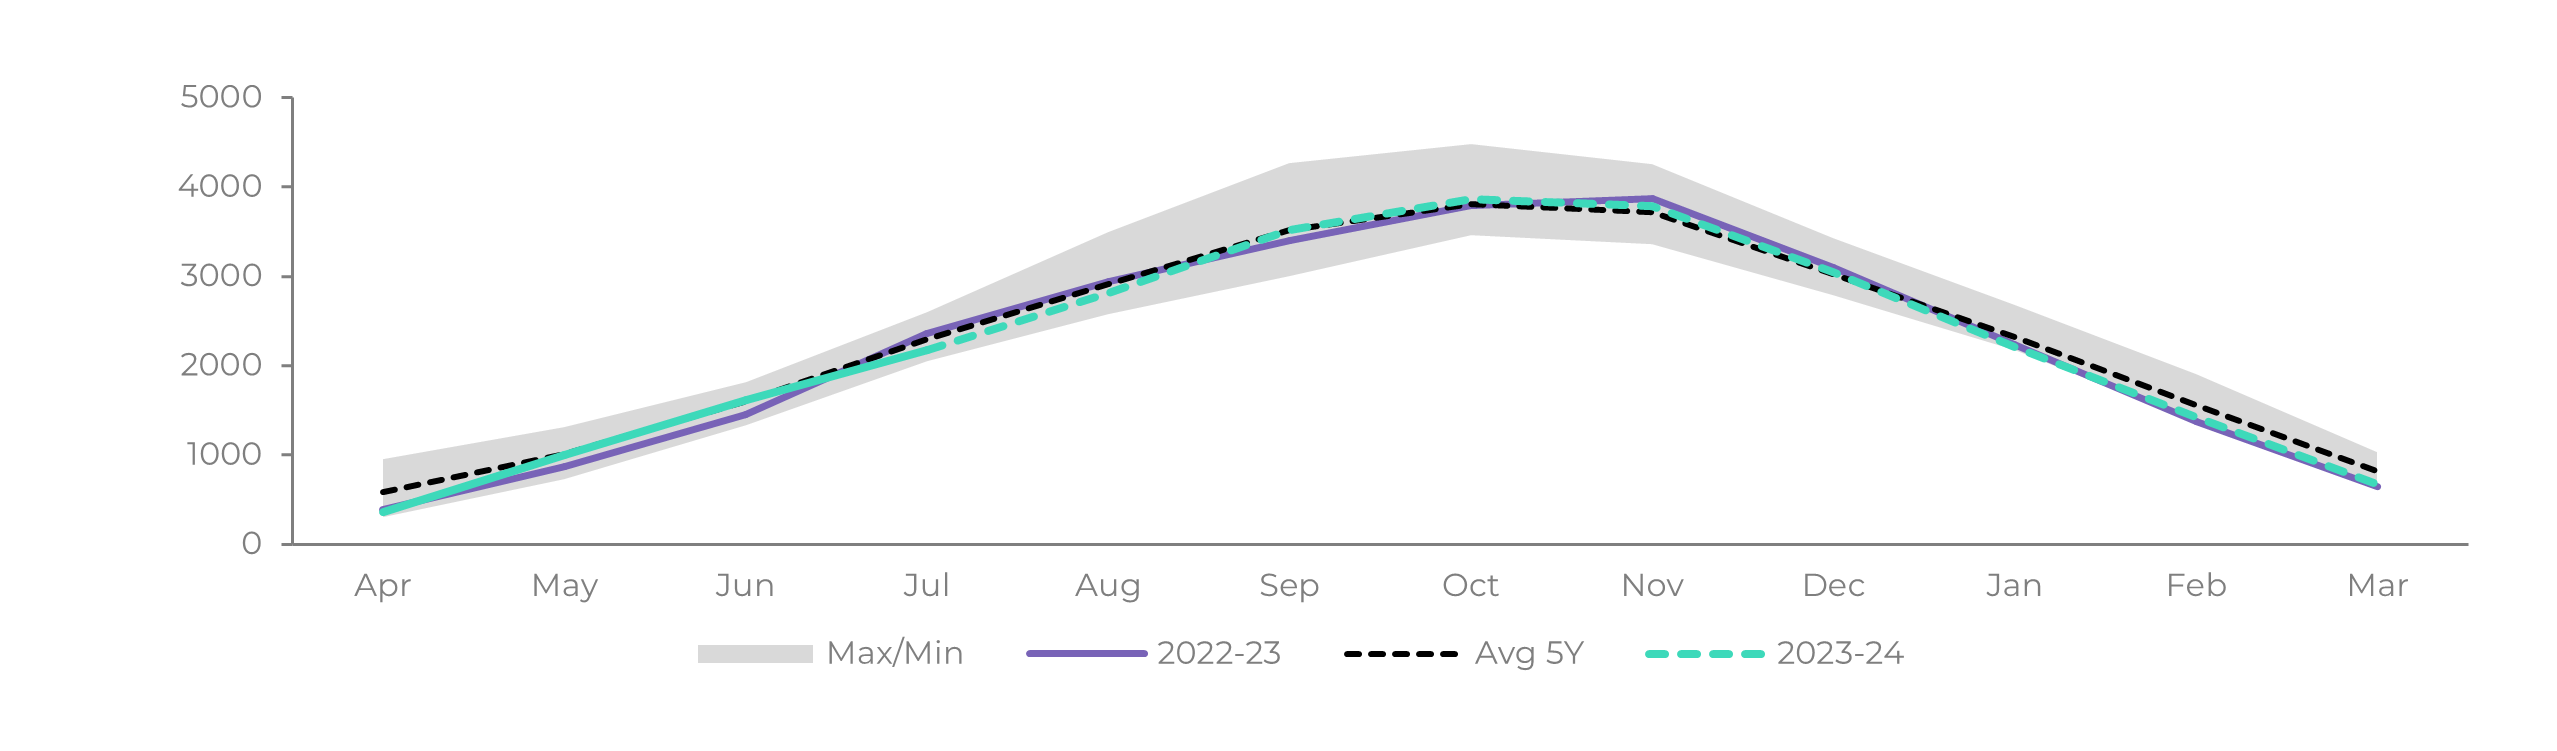
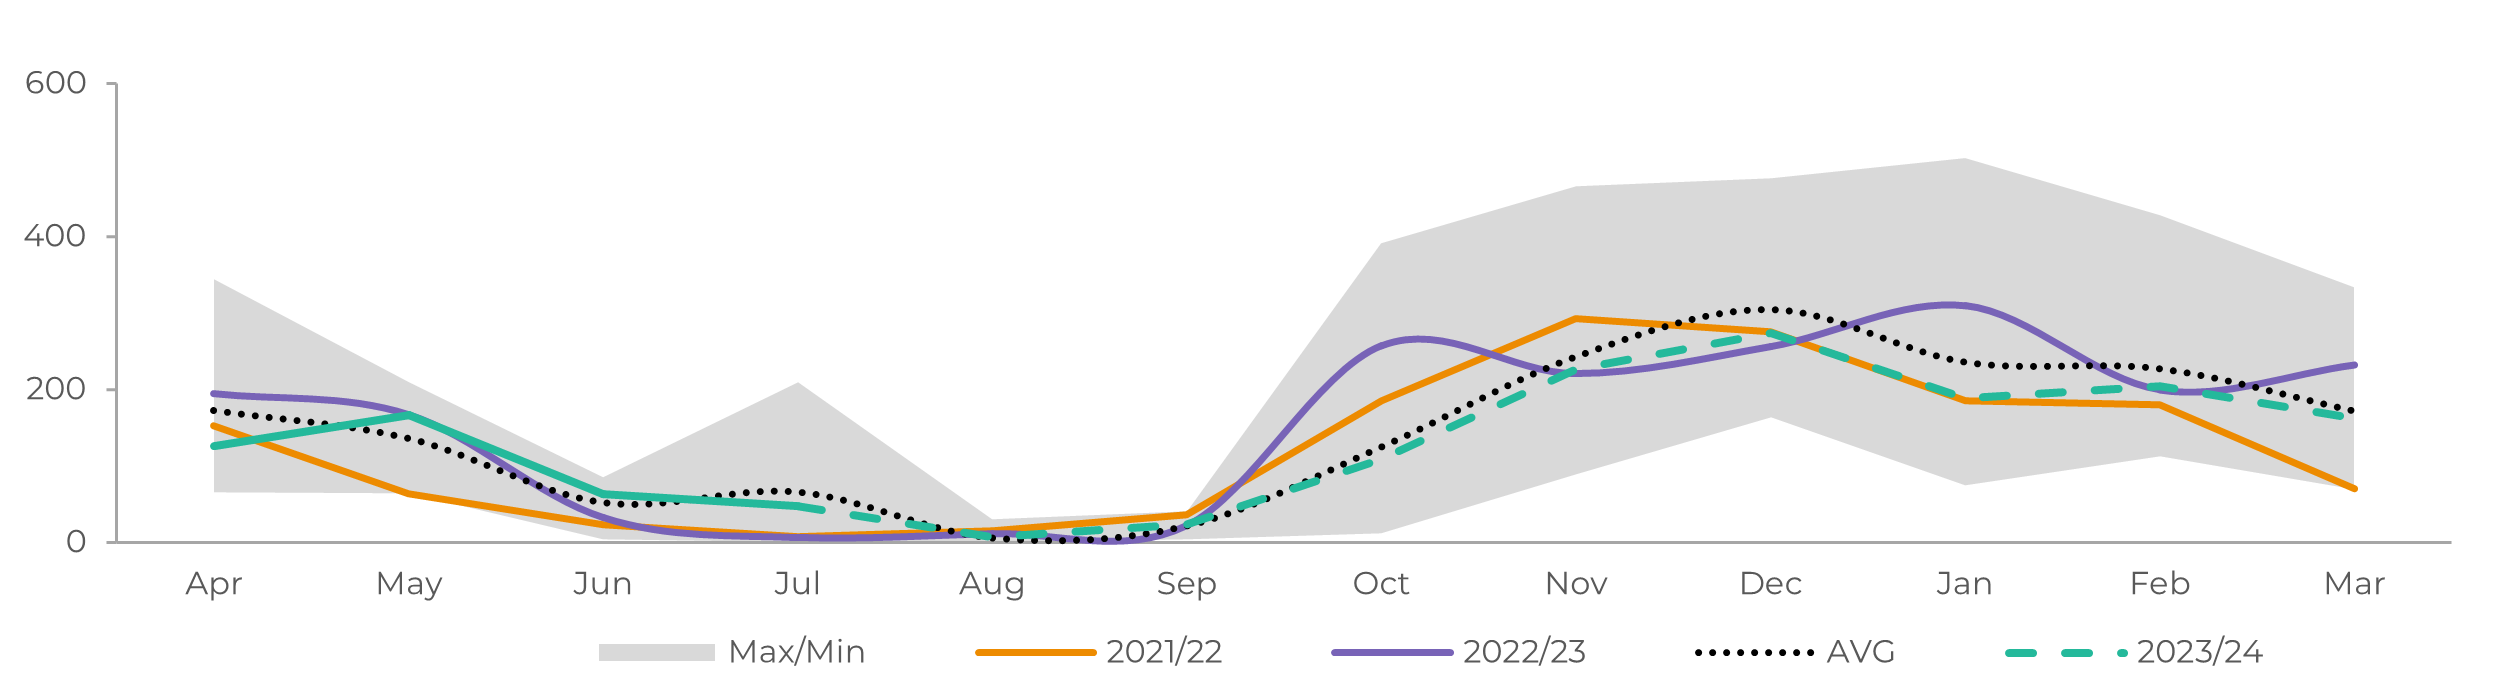
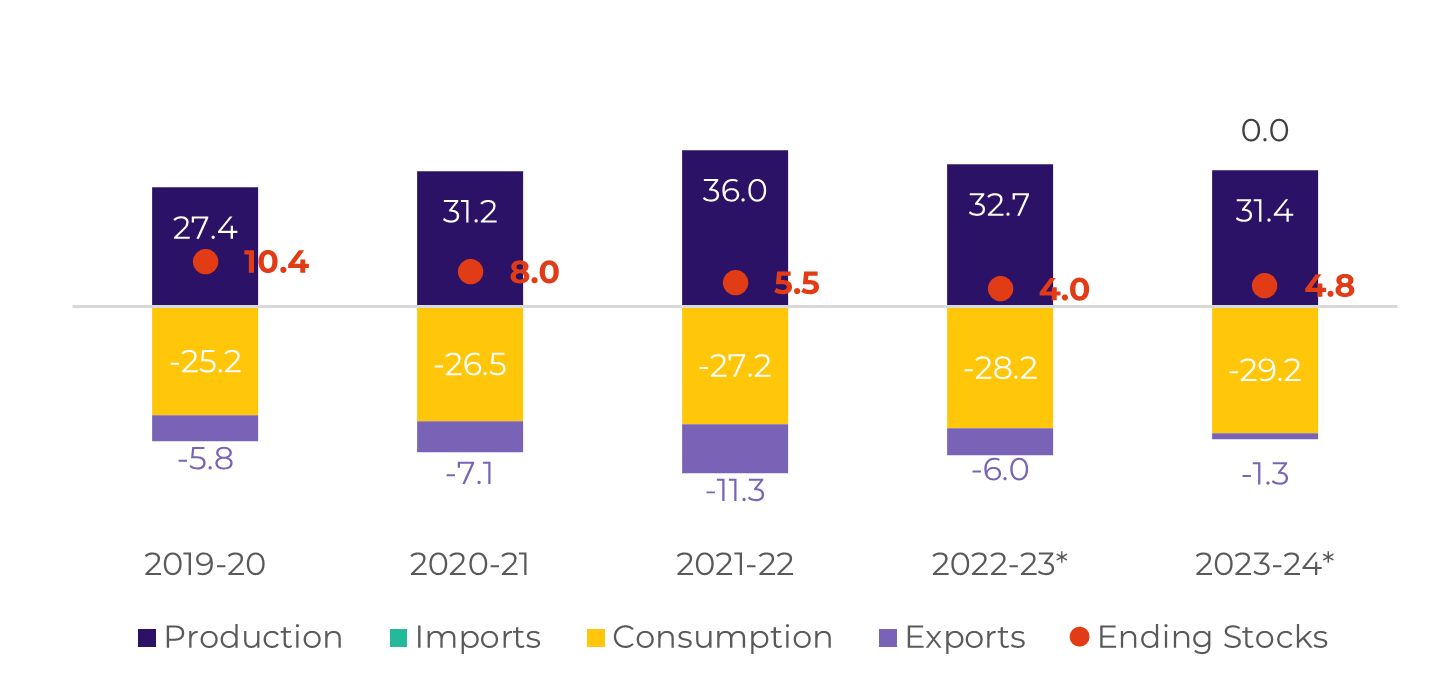
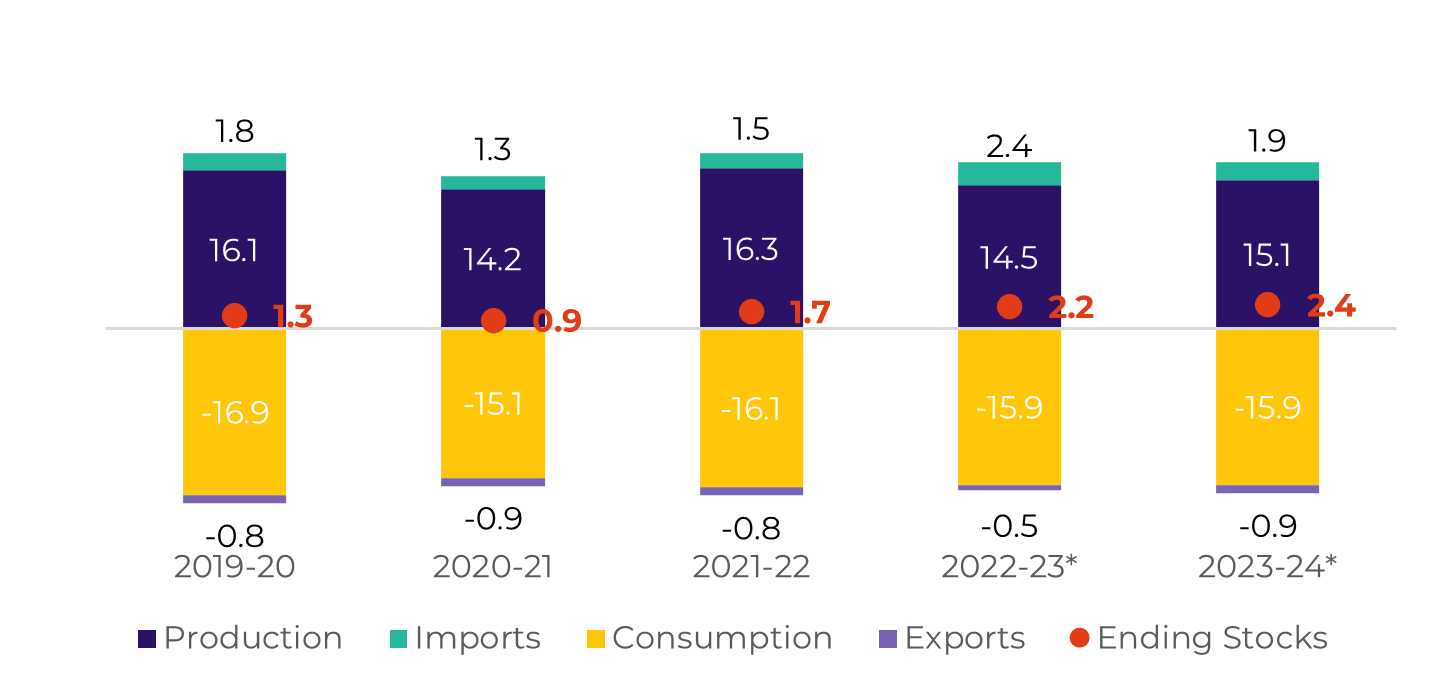
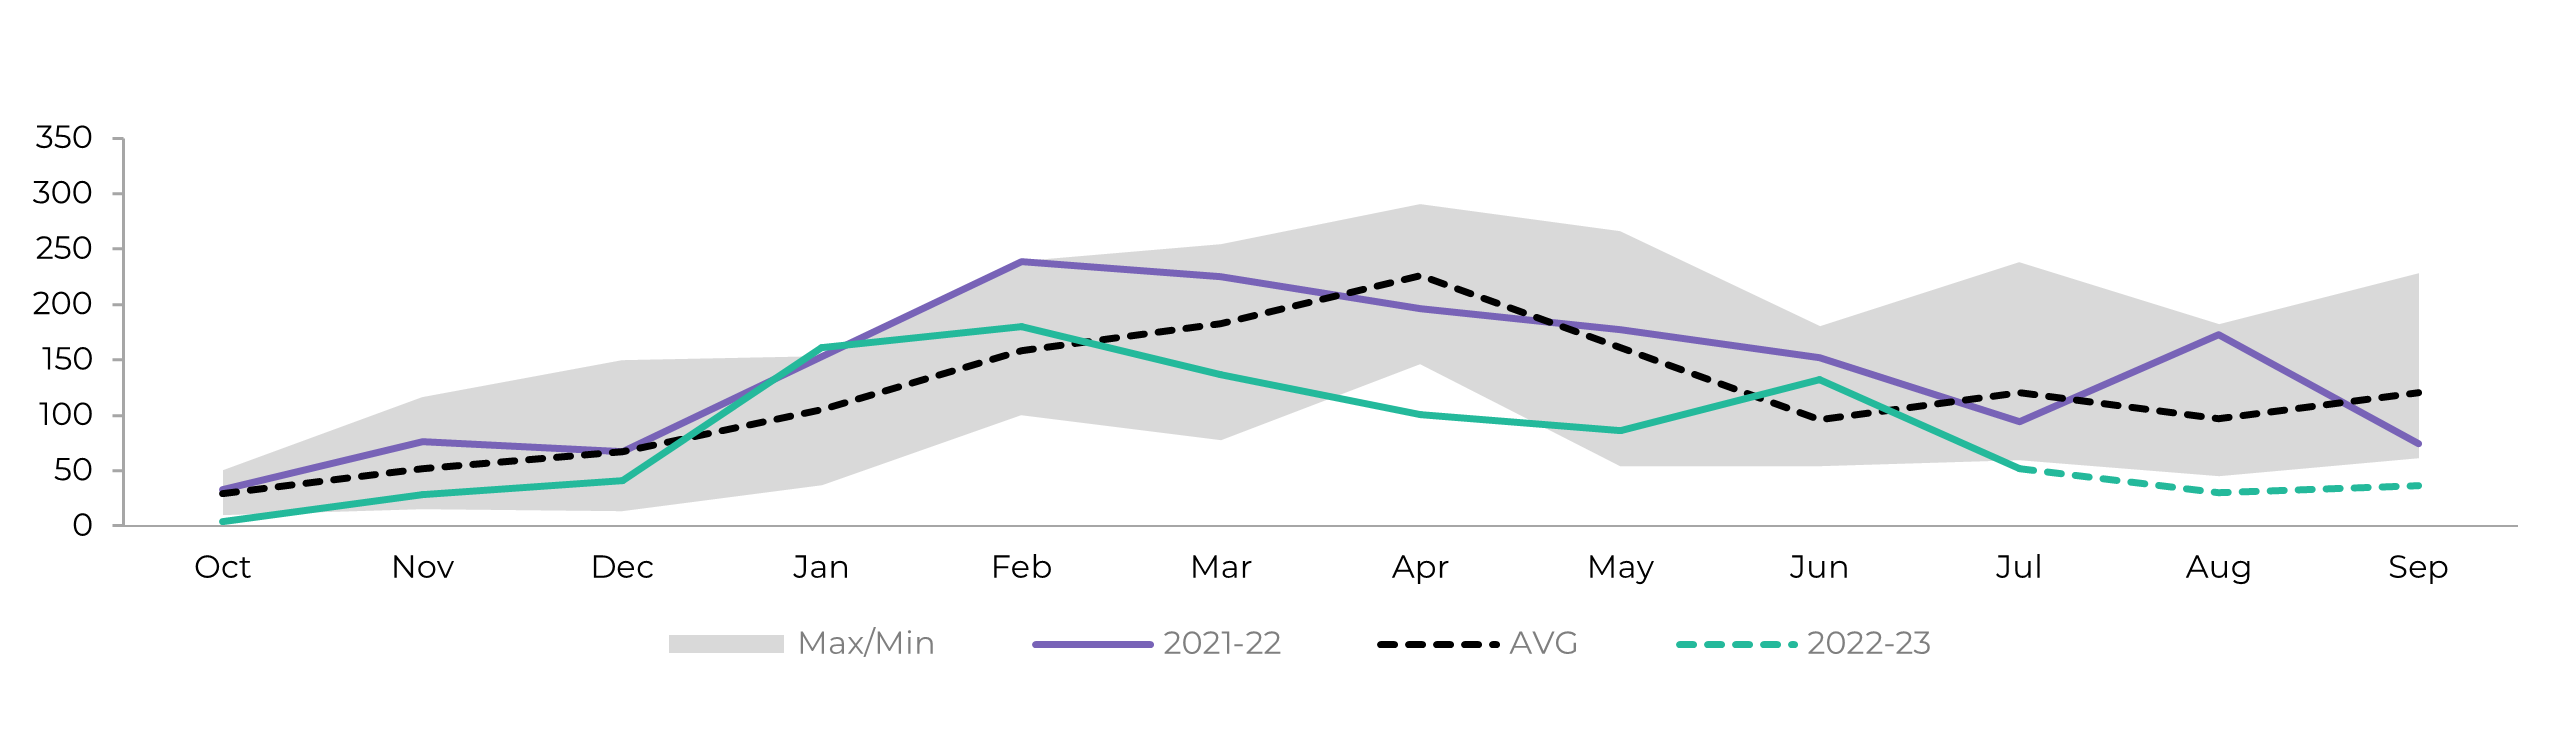
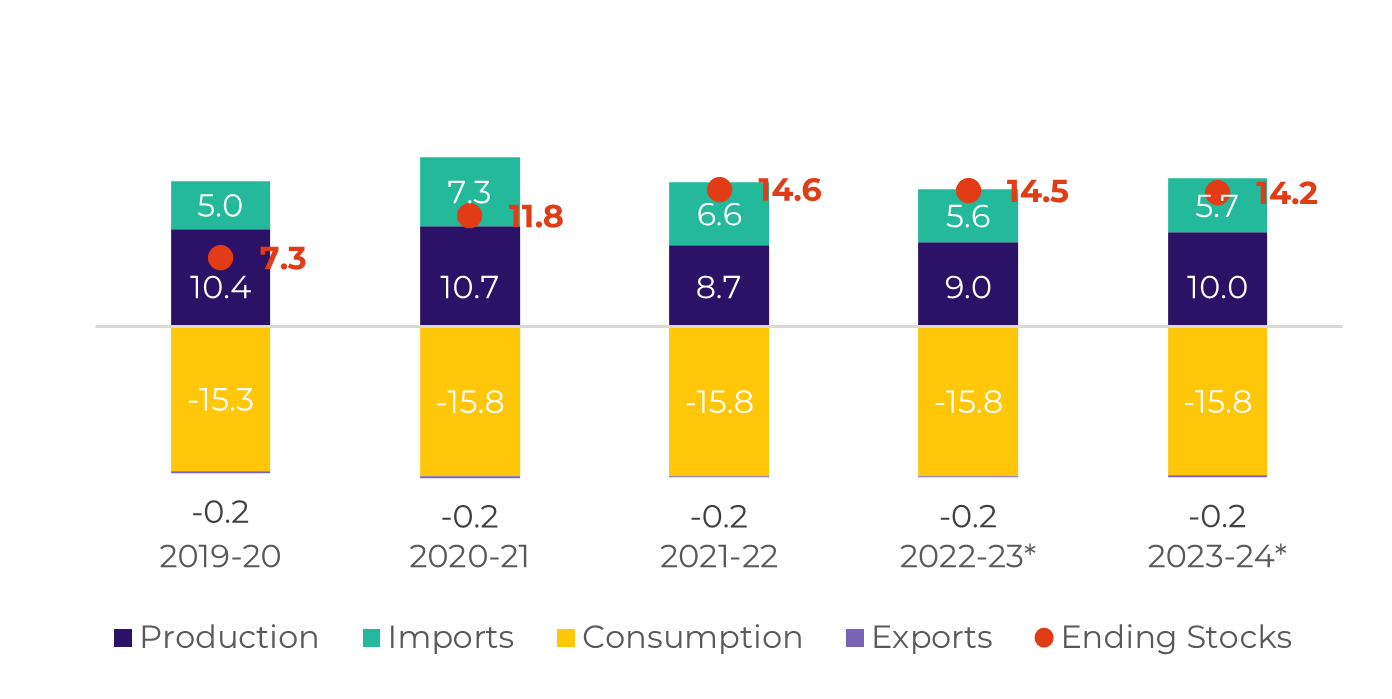
Our revision to the Brazilian Center-South total volume contributed positively to trade flow availability, at least until the end of 2023. Confirmations of other countries' production and exports reduced the Q3 surplus, especially India's fulfilling all of its approved quota yet in Q2.

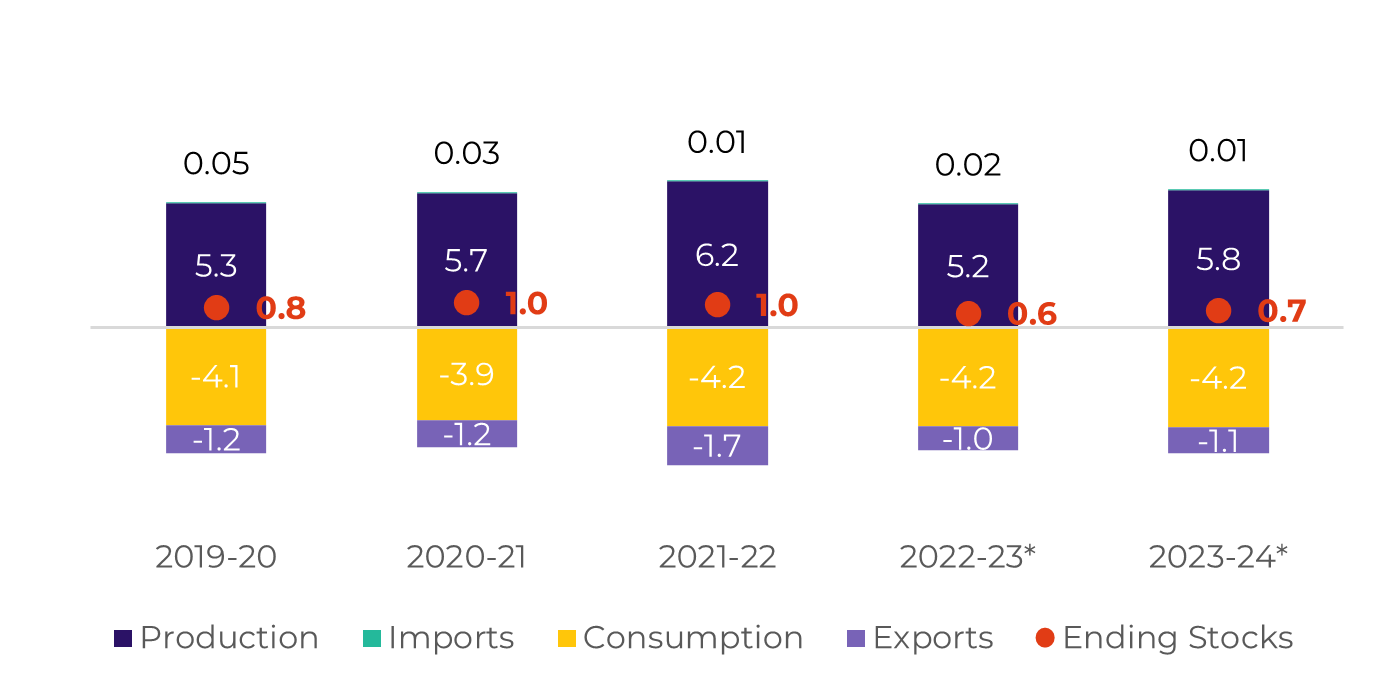
For the next year, 2024, the first and second quarters are still penalized by lower participation from the Northern Hemisphere. India has faced the worst August monsoon in many years, contributing to further availability disruptions, leading the market back to the null to 2.5Mt exports discussion.

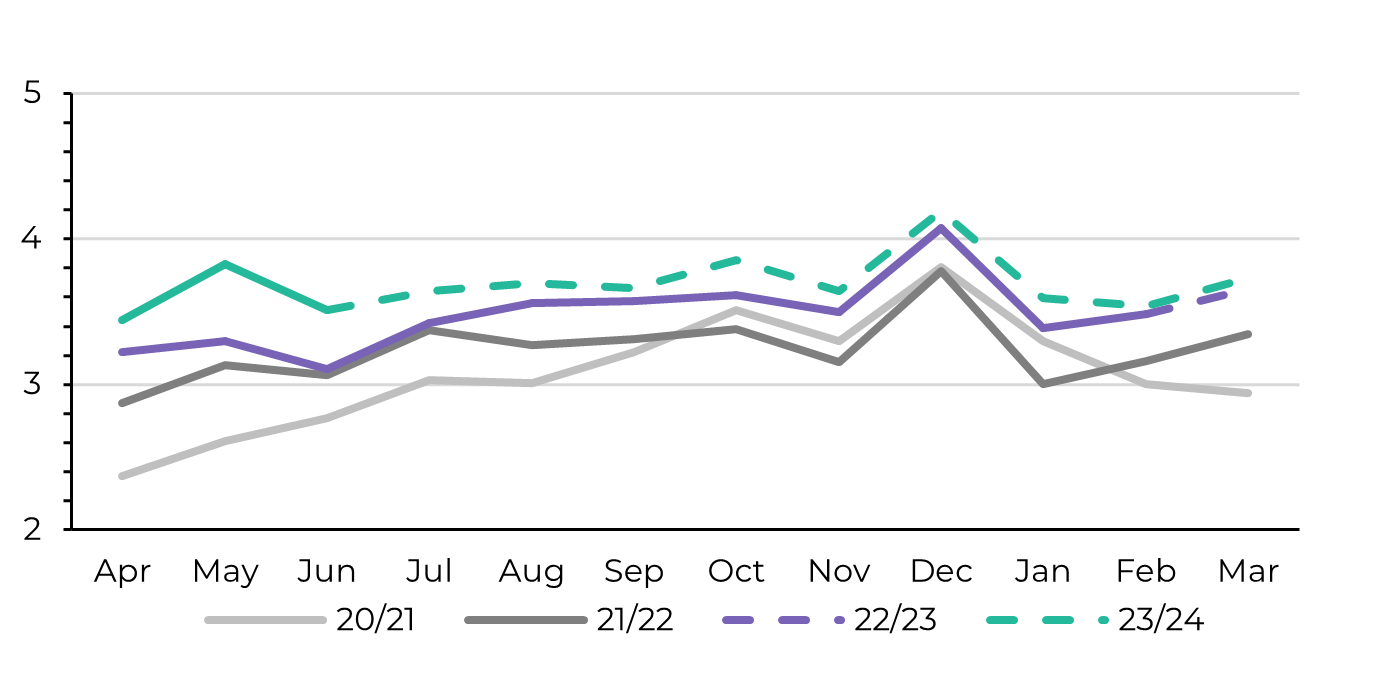
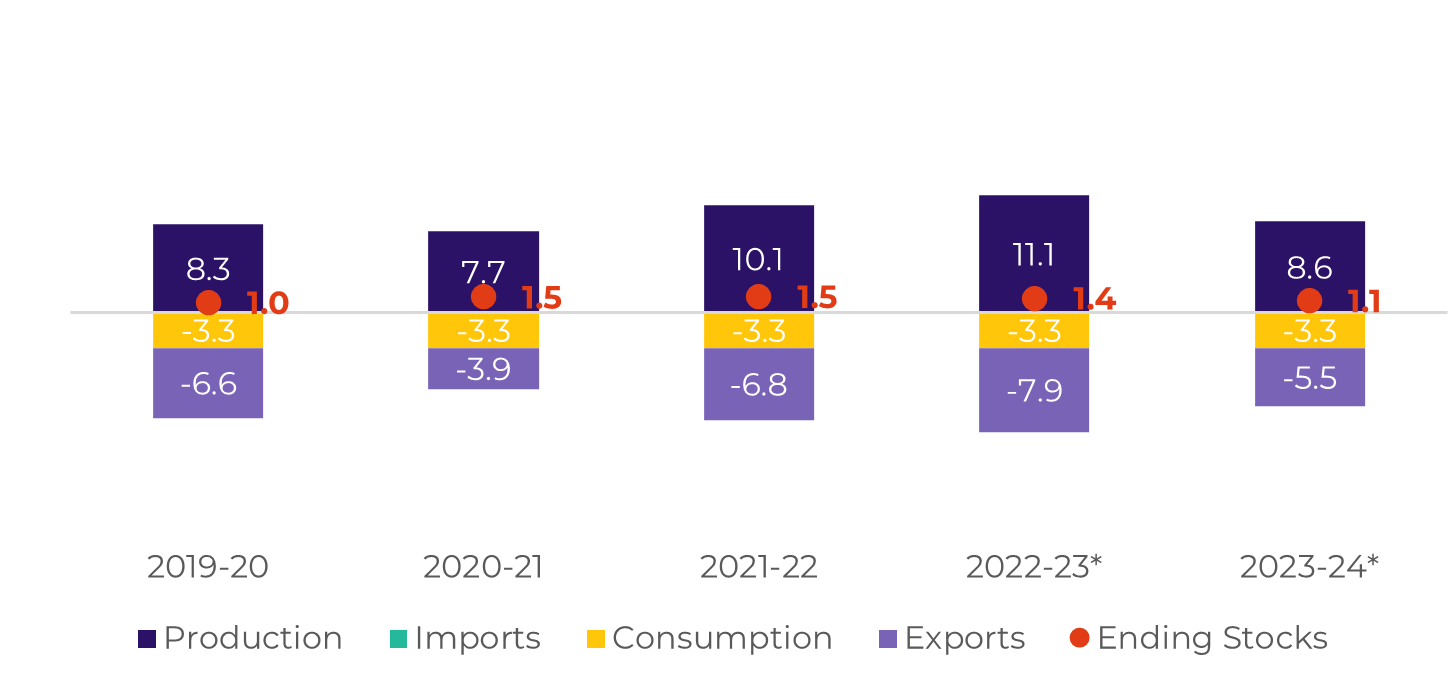
We revised our India's exports to 1.3Mt, starting later in the season due to possible delays in quotas allowances - lowering our Q1 and Q2 2024 trade flows further. Therefore, sugar remains facing a short-term bearishness coming from Brazilian CS higher availability, however, prices have found some extra support in 2024 tightness, breaching the 25c/lb resistance level.

Image 1: Total Trade Flow ('000t)

Source: hEDGEpoint

Image 2: Raw's Trade Flow ('000t)

Source: hEDGEpoint

Image 3: White's Trade Flow ('000t)

Source: hEDGEpoint

Image 4: Global Supply and Demand Balance (MT RV oct-sep)

Source: hEDGEpoint

Brazil CS

Image 5: Sugar Balance - Brazil CS (Apr-Mar Mt)

Source: Unica, MAPA, SECEX, hEDGEpoint

Considering 23/24’s numbers so far, our model points to 616.5Mt of crushing. Considering the expected weather improvement, the ATR could also be higher than previously forecast at 139.7 kg/t.

Adding up all the changes, our sugar production for 23/24 increased by 2Mt, from 37.6 to 39.7Mt.
The additional availability was diverted directly to exports, dramatically increasing sugar volume in Q3 2023 and Q4 2023 and smoothing out the absence of the Northern Hemisphere – which doesn't mean there can't be a deficit.

Image 6: Total Exports - Brazil CS ('000t)

Image 7: Total Stocks - Brazil CS ('000t)

Source: SECEX, Williams, hEDGEpoint

Source: Unica,MAPA, SECEX, Williams, hEDGEpoint

Brazil CS Ethanol

Image 8: Otto Cycle - Brazil CS (M m³)

Source: ANP, Bloomberg, hEDGEpoint


Although we have revised our Otto Cycle growth to 5.5%, the biofuel share remains low compared to previous years.

Hydrous sales are still below average and previous crop’s results, while anhydrous is benefiting from higher gasoline consumption.
Despite not inducing mix changes, ethanol has gained space in demand given the significant drop in pump parity since July 2023.

Image 9: Anhydrous Ending Stocks - Brazil CS ('000 m³)

Image 10: Hydrous Ending Stocks - Brazil CS ('000 m³)

Source: Unica, MAPA, ANP, SECEX, hEDGEpoint

Source: Unica, MAPA, ANP, SECEX, hEDGEpoint

Brazil NNE

Image 11: Sugar Balance - Brazil NNE (Apr-Mar Mt)

Source: MAPA, SECEX, hEDGEpoint

No changes from last report: Excellent summer rainfall during 2022 was the main reason for the good results in NNE's crop.
 
Considering either Apr-Mar or Jun-May windows, the crop improved by around 11% compared to the previous year. Around 61Mt of cane was crushed and 3.2Mt of sugar was produced.
Although El-Niño might affect cane development and induce a drop in total crushing, it might benefit TRS. Therefore, with 59Mt cane crushing, 127kg/t TRS and another max sugar at 46.4%, the region might increase to 3.3Mt.

Image 12: Total Exports - Brazil NNE ('000t)

Source: SECEX, hEDGEpoint

India

Image 13: Sugar Balance - India (Oct-Sep Mt)

Source: ISMA,AISTA, hEDGEpoint

India has been facing weather challenges that have affected its agricultural production and led to a rise in food inflation. The latter rose to 11.5% in July, against 4.7% in the previous month, with the price of vegetables showing the greatest growth.

Consequently, India's CPI rose to 7.4% YoY from 4.9% in June. Thus, it is expected that the government will take measures to control food inflation.
We revised our exports to 1,325Mt, starting later in the season due to possible delays in quotas allowances – the government must wait for the stock tightness to ease and prices to correct before making any decision.

Image 14: Total Domestic Exports - India ('000t w/o tolling)

Source: ISMA,AISTA, hEDGEpoint

Thailand

Image 15: Sugar Balance - Thailand (Dec-Nov Mt)

Source: Thai Sgar Millers, Sugarzone, hEDGEpoint

There is still some time left before 23/24 crop year starts, so we need to continue monitoring the weather.
So far, however, there have been no signs of improvement in cane development.

Therefore, we kept our estimates unchanged at 75Mt of cane and 8.7Mt of sugar. The exports availability is expected to drastically reduce, contributing to deficits in the first and second quarters of 2024.

Image 16: Total Exports - Thailand ('000t)

Source: Thai Sgar Millers, hEDGEpoint

EU 27+UK

Image 17: Sugar Balance - EU 27+UK (Oct-Sep Mt)

Source: EC, Greenpool, hEDGEpoint

MARS yield forecast remains at 2% above average, which can be perceived as positive compared to past year results. The agency states that weather has contributed to summer crops such as beet from July's second fortnight onwards in Germany, one of the biggest sugar producers in the bloc.
As discussed in our previous report, production is expected to improve compared to 22/23, but remain short from 21/22.

Mexico

Image 18: Sugar Balance - Mexico (Oct-Sep Mt)

Source: Conadesuca, Greenpool, hEDGEpoint

Although we remain optimistic considering a recovery for 23/24, weather has not been positive for most of the cane-producing regions. Jalisco and San Luis Potosi are the second and third main producers, and both have been facing lower-than-average precipitation.
There is still time for rains to alleviate drought effects, and USDA remains positive that the better use of fertilizers and other inputs might induce recoveries.

Image 19: Total Exports - Mexico ('000t)

Source: Conadesuca, Greenpool, hEDGEpoint

USA

Image 20: Sugar Balance - US (Oct-Sep Mt)

Source: USDA, hEDGEpoint

USDA's latest revision offered little change to 23/24 forecast. Overall, the agency points out better beet yields.

Although they remain pointing out 9.2Mt strv (8.3Mt), the agency alerts possible impact on yield given current weather patterns such as dry conditions in sugar beet fields (Michigan and North Dakota) and sugarcane key producing states (Louisiana and Texas).

Guatemala

Image 21: Sugar Balance - Guatemala (Oct-Sep Mt)

Source: Cengicaña, Sieca, Azucar.gt,Greenpool, hEDGEpoint

Guatemala's rainfall is lagging behind average. Most cane-producing regions (Guatemala's lowlands, central, and highlands) received lower-than-average precipitation. Weather forecasts show different outcomes, while GFS predicts more rains in key producing states, Canadian and European models still peg dryness to come.
It is fair to notice, however, that the country could still recover its production depending on farmers' irrigation choices. The country is well-known to have made major investments in the area.

Image 22: Total Exports - Guatemala ('000t)

Source: Sieca

El Salvador

Image 23: Sugar Balance - El Salvador (Oct-Sep Mt)

Source: Consaa, Sieca, Greenpool, hEDGEpoint

El Salvador has also suffered from dryness over the last couple of months. However, different from Guatemala, all weather forecast models (GFS, Canadian, and European) point out precipitation improvements for the coming days. Yet we should remain cautious and observe: there is still some dryness expected for September.
Still, the country has also made investments in irrigation, making stable production hard to discard.

Russia

Image 24:

Source: Ikar, Sugar.ru, Greenpool, hEDGEpoint

Russia's beet seems to have developed well. According to sugar.ru data, beet weight, and sugar content show improvements compared to 22/23 figures. By August 22, 47.9 thousand hectares of beet had been harvested, the yield being higher than last year.

Ikar (Institute of Agricultural Market Studies) changed its production expectation for 23/24 to 6.5Mt, against 6.2Mt in 22/23, with an improvement of 3.5% in area.

We kept our figures unchanged at 6.4Mt, but there is an upside.

China

Image 25: Sugar Balance - China (Oct-Sep Mt)

Source: GSMN, CSA, Refinitiv, Greenpool, hEDGEpoint

Obs: stocks also account for bonded warehouses volume and imports include syrup and smuggling estimates

Until the end of July, China imported 23% less sugar than in the previous crop, approximately 3Mt against 3.9Mt.

From May to July, China is known to have purchased 616kt of sugar from Brazil, so we still believe it is possible for the country to end the 22/23 season importing around 3.7Mt (exc. ​​syrup and smuggling).

There is a tendency for exports to return to the average 3.8Mt-4Mt, since the parity remains closed and there is no prospect of reopening. Image 26: Total Imports - China ('000t - w/o syrup and smuggling)

Image 27:

Source: GSMM, hEDGEpoint

Source: CSA, Refinitiv, Greenpool, hEDGEpoint

Weekly Report — Sugar and Ethanol

Written by Lívea Coda
livea.coda@hedgepointglobal.com
Reviewed by Natália Gandolphi
natalia.gandolphi@hedgepointglobal.com

Sugar and Ethanol Desk

Murilo Mello
murilo.mello@hedgepointglobal.com
Matheus Jacques
matheus.jacques@hedgepointglobal.com
Gabriel Oliveira
gabriel.oliveira@hedgepointglobal.com
www.hedgepointglobal.com

Disclaimer

This document has been prepared by hEDGEpoint Global Markets LLC and its affiliates ("HPGM") exclusively for informational and instructional purposes, without the purpose of creating obligations or commitments with third parties, and is not intended to promote an offer, or solicitation of an offer, to sell or buy any securities or investment products. HPGM and its associates expressly disclaim any use of the information contained herein that may result in direct or indirect damage of any kind. If you have any questions that are not resolved in the first instance of contact with the client (client.services@hedgepointglobal.com), please contact our internal ombudsman channel (ouvidoria@hedgepointglobal.com) or 0800-878-8408 (for clients in Brazil only).

To access this report, you need to be a subscriber.