Sugar and Ethanol Weekly Report - 2023 12 18
Are we moving back to parities?
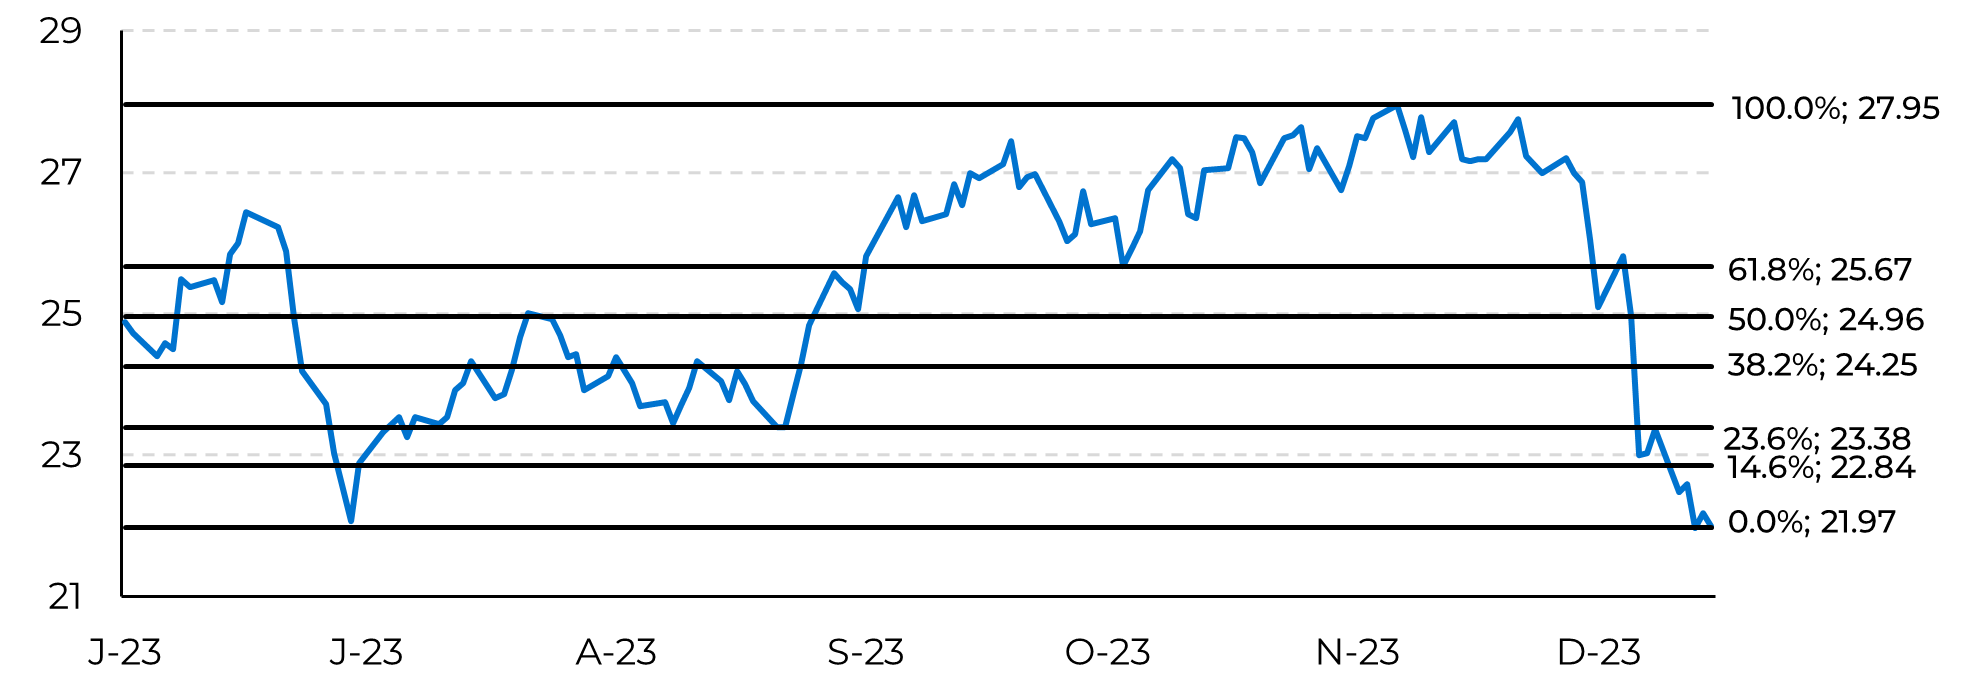
- This past week was all about technicals: traders eagerly watched Fibonacci retracement as sugar tested and failed to bounce back several times, closing the week at 21.99 c/lb.
- Despite potential technical indicators for a rebound to 24c/lb, fundamental factors, such as Brazil's offset in trade flows and higher Indian sugar production, contribute to a bearish outlook.
- sugar prices are still bound to some support during the Brazilian intercrop, but its extension and intensity are highly linked to the demand side.
- If demand starts to heat up in January, prices might be comfortable between 22 and 24c/lb. However, as we approach Center-South’s 24/25 crop start, prices might correct once more, driving market back monitoring key-parties. India’s export parity is out of the table, at 19.5 - 20 c/lb currently, but Chinese import parity is not, estimated between 18.8 and 19.3 c/lb.
This past week was all about technicals: traders eagerly watched Fibonacci retracement as sugar tested and failed to bounce back several times. Stuck in a tight range, between 21.5 and 23.5 c/lb, it is safe to say that a resistance was found as soon as a support, and guessing where prices might go from here got extremely difficult. While many might argue that a bounce back to the 24c/lb level is rather possible thinking strictly on the technical side, fundamentals don’t seem to be on the same page.
Image 1: Fibonacci Retracement – Raw Sugar Front Contract in c/lb

Source: Refinitiv, hEDGEpoint
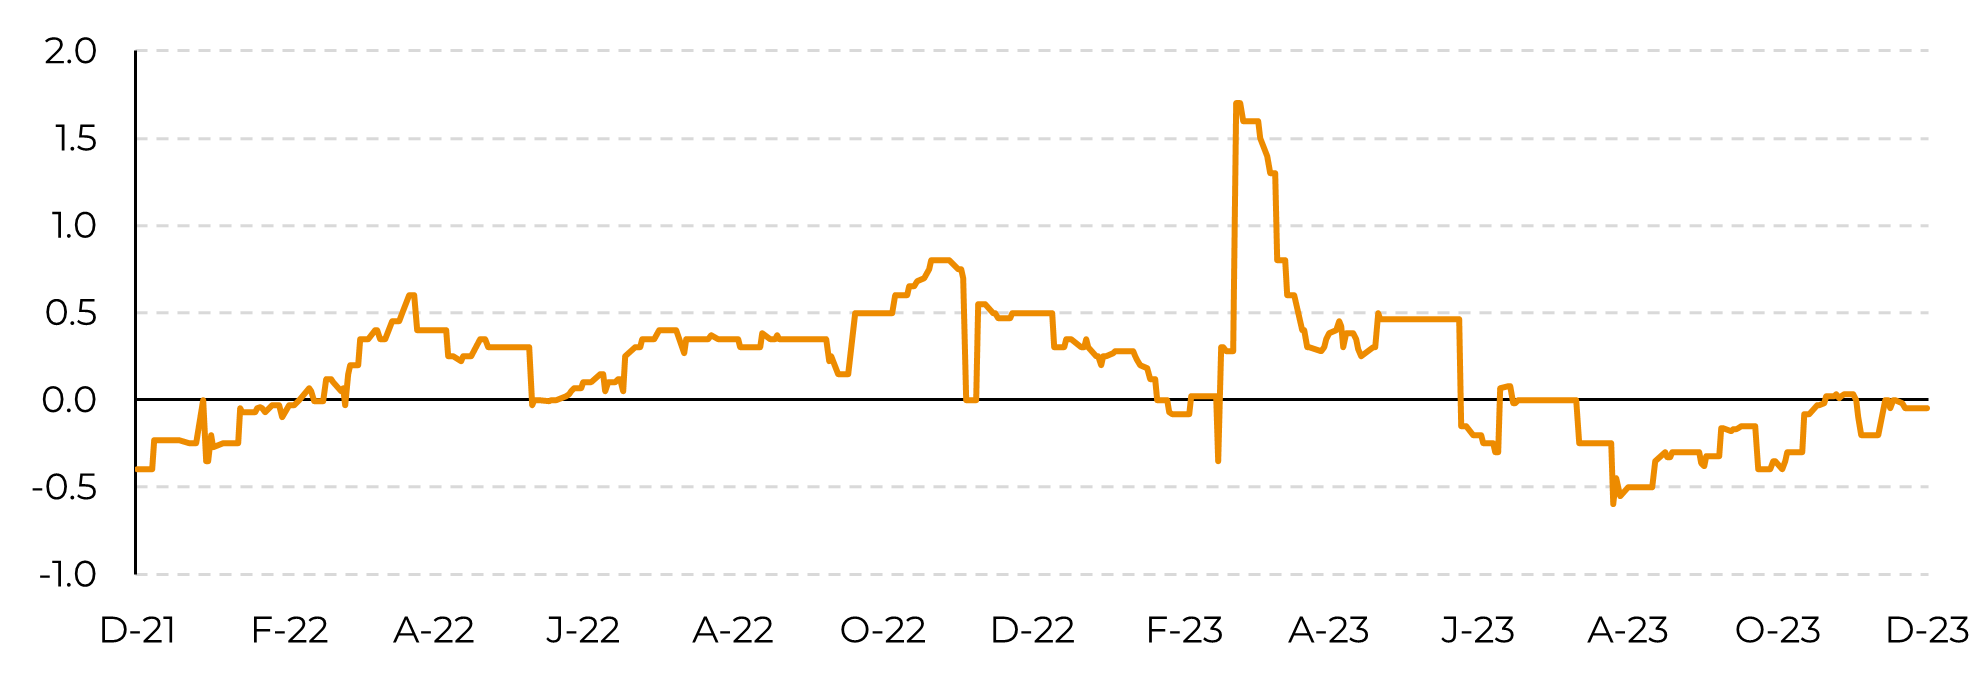
A good measure of market action is cash premiums. Since Brazil is currently the main supplier, one could expect its values to be at the higher end of observations, especially given the market’s deficit expectations, but they are not. As a matter of fact, they are close to average. According to Refinitiv, December’s cash value is being traded at -5pts/flat, while January is moving from +5pts to +10pts – still below 2022 levels when a deficit year was also being priced. Are we really at a deficit? Maybe it just isn't big enough.
Image 2: Raw Sugar Cash Premium – Santos FOB in c/lb

Source: Refinitiv, hEDGEpoint
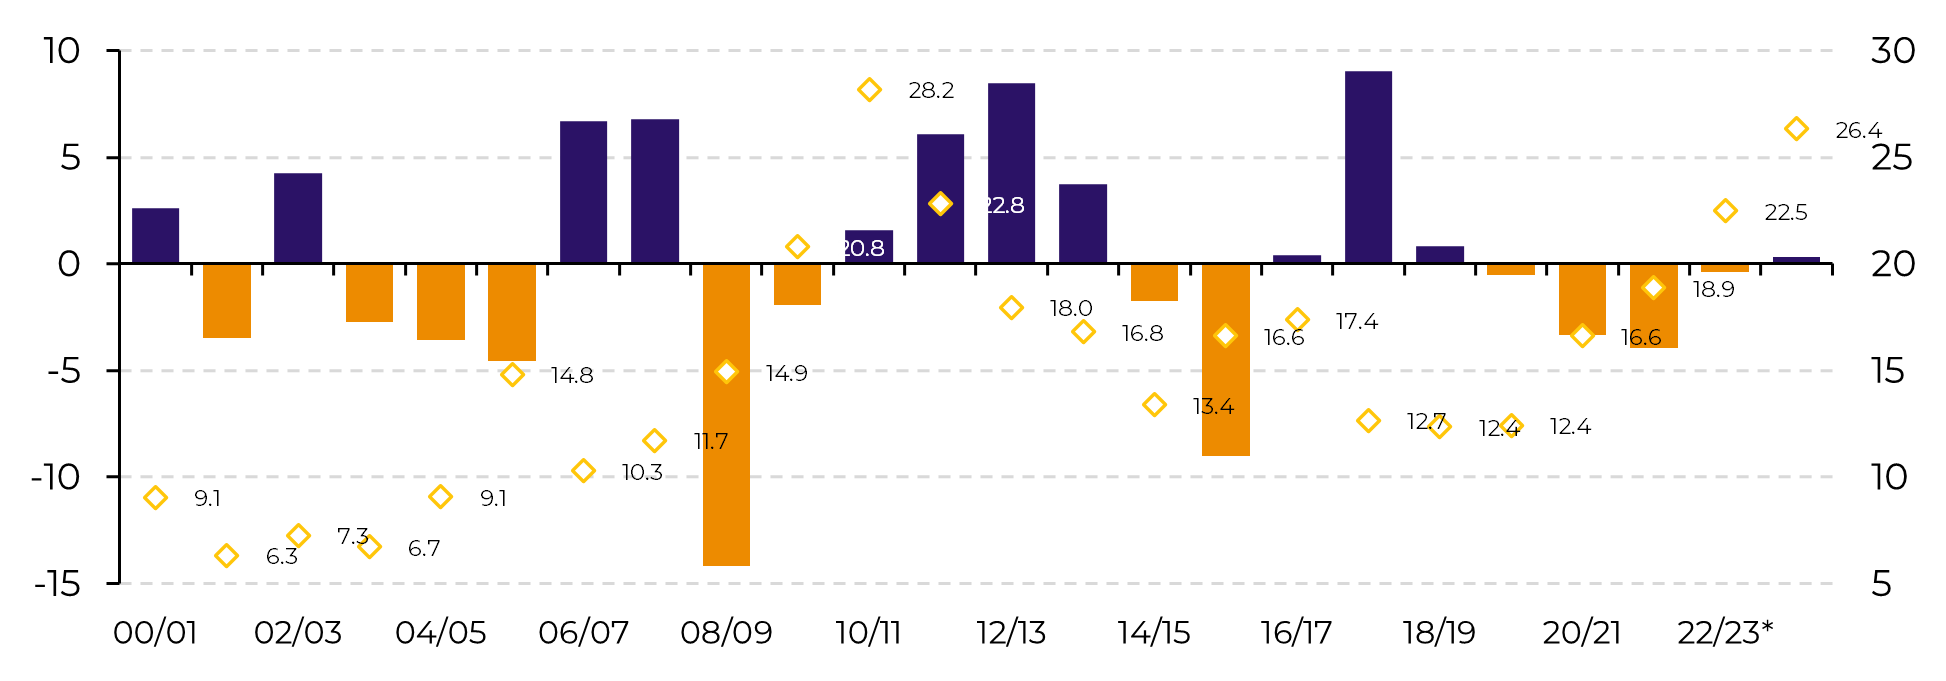
Monitoring demand and its eagerness has become a must, but we cannot separate it from the supply side. Market might be wondering if the general idea of a structural deficit, which states that demand growth will eventually thrive over production capacity, is indeed where the sugar market is headed. Brazil, for instance, has proven that higher prices induce investments in both production capacity and logistics, reaching a record and leading us to expect another excellent year for 24/25. On the demand side, although many emerging countries still present a positive yearly growth, developed ones might be on the verge of a downturn, which, combined with shrinking populations and sugar taxation, adds to the bear side of the equation.
Image 3: Estimated Historical Sugar Global Balance (Mt) versus Average Raw Prices (c/lb)

Source: USDA, Green Pool, Refinitiv, hEDGEpoint
As discussed in our previous report, this adds strength to the bearish tale as it indicates a return to average precipitation during the Northern Hemisphere’s 24/25 crop development period. Coupled with market’s optimism regarding Brazil’s production, it means that the bullish last breath could be Q1/24 – if demand allows it
Image 5: Raw Sugar Key Parities in c/lb

Source: Refinitiv, Bloomberg, hEDGEpoint
In Summary
From a technical market to understanding the fundamentals behind prices melt down: there is much to be monitored to grasp where prices are heading. Brazil has proven that paying enough leads to major investments and capacity expansion, while demand might be more cautious than in previous years. Weather has continuously been a source of volatility and should remain so, as are political decisions. All in all, market seems to be converging to previous support levels and parities
Weekly Report — Sugar
livea.coda@hedgepointglobal.com
natalia.gandolphi@hedgepointglobal.com
Disclaimer
Contact us
Check our general terms and important notices.
We have updated our Terms & Conditions to reflect improvements to our platform, data handling practices, and the overall experience we provide to our clients.

