Sugar and Ethanol Weekly Report - 2024 03 18
"Even with reduced cane figures, the sugar mix supports robust production in the Center-South, but this doesn't guarantee a return to higher trading prices. Short-term market sentiment is restrained due to improving prospects surrounding the Northern Hemisphere's performance and the anticipation of the next crop recovery. Additionally, there's heightened competition from other soft commodities like cocoa, which offer potentially higher gains."
Brazilian weather is not cooperating... What if?
- Sugar prices are supported by ongoing production challenges in the Center-South region, exacerbated by adverse weather conditions in February and early March, prompting a reevaluation of volume projections.
- Despite concerns about declining yields, with an estimated 30% of cane production receiving average rainfall, it's premature to forecast a cane volume below 600 Mt.
- Adjusted cane production figures, ranging from 595 Mt to 615 Mt, significantly impact the global balance, with implications for trade flows and market dynamics. We will explore some scenarios throughout this report.
- Even with reduced cane figures, the sugar mix supports robust production in the Center-South, but this doesn't guarantee a return to higher trading prices. Short-term market sentiment is restrained due to improving prospects surrounding the Northern Hemisphere's performance and the anticipation of the next crop recovery. Additionally, there's heightened competition from other soft commodities like cocoa, which offer potentially higher gains.
The key supportive reason for sugar prices remains the continuous lower bias that the Center-South region’s production faces. February's precipitation, coupled with unfavorable weather in the first half of March, has dampened optimism and prompted a reevaluation of our cane volume projections. In this report, we will explore various scenarios and assess their impact on global supply and demand as well as trade patterns.
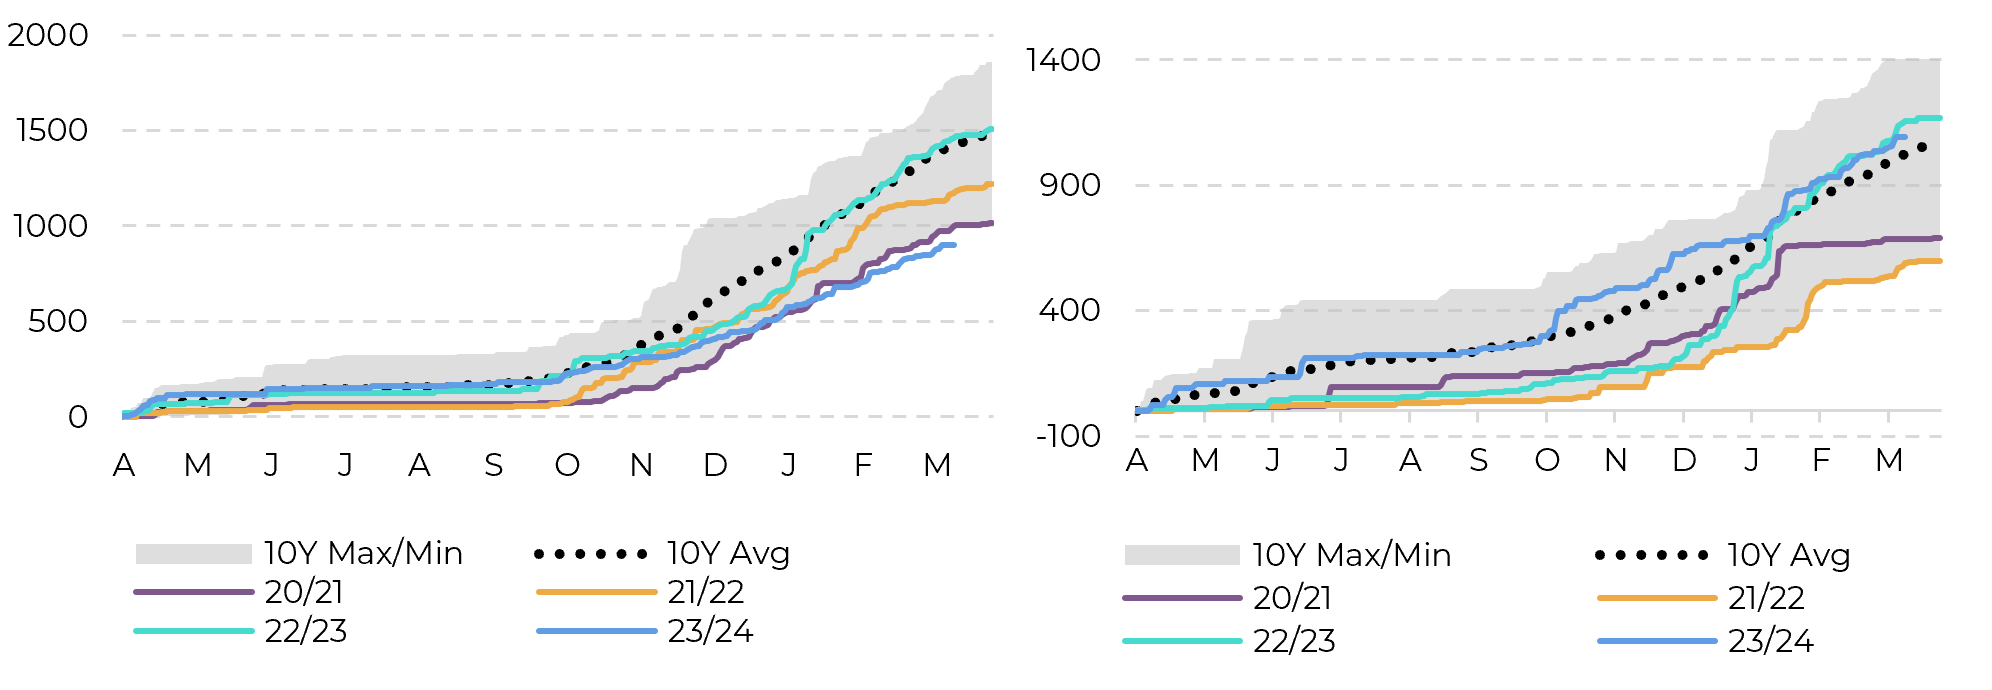
Image 1: Cummulative precipitation Ribeirão Preto vs Bauru (mm)

Source: Bloomberg, Somar, hEDGEpoint
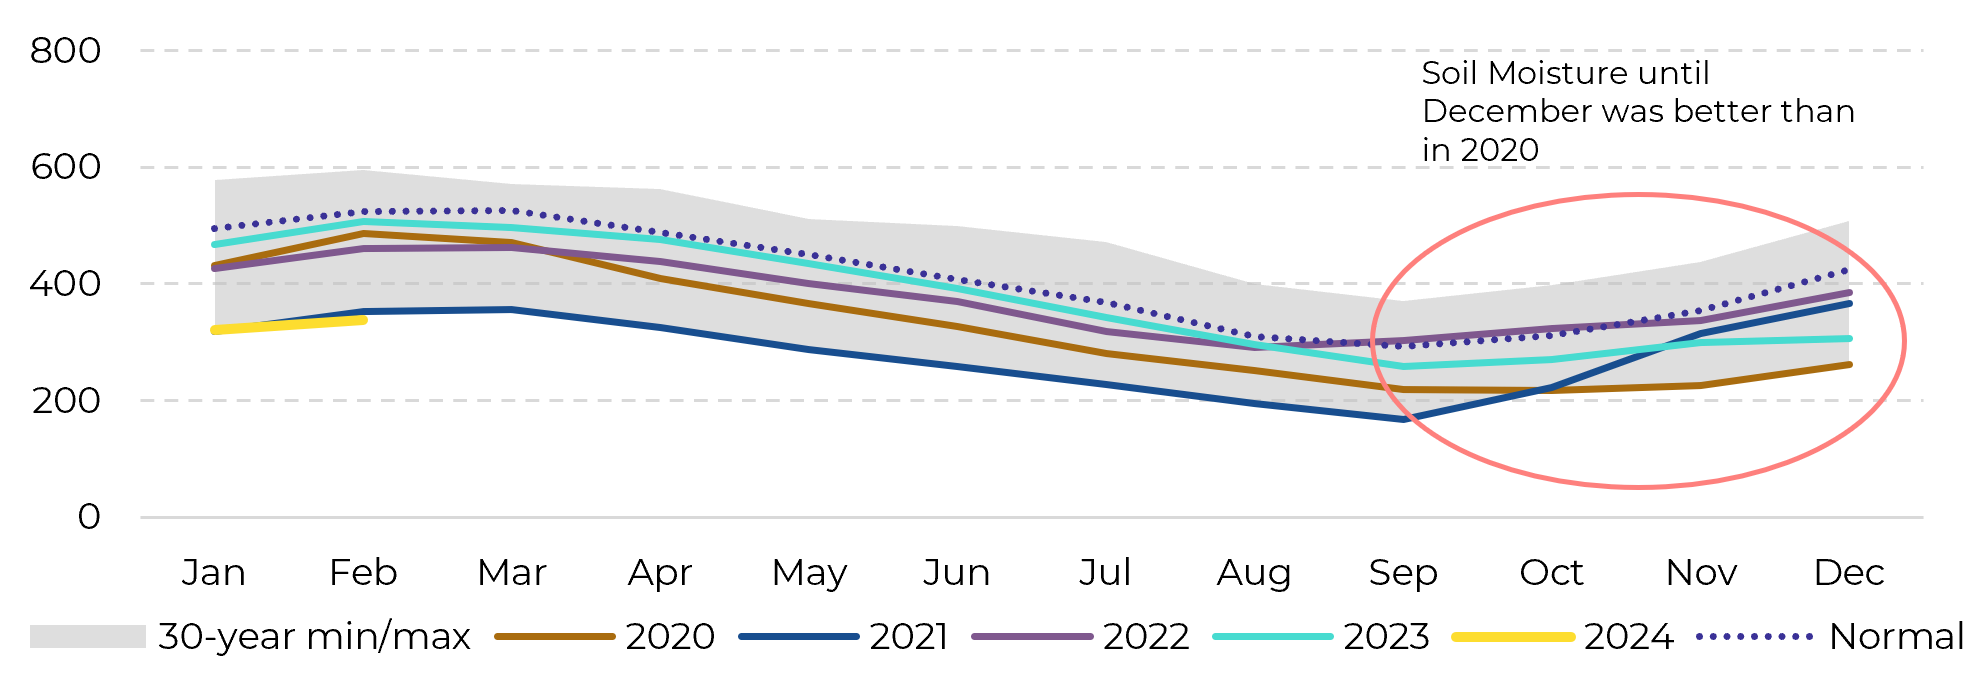
But first, it's important to note that while soil moisture and cumulative precipitation indicate a potential sharper decline in yields compared to our current estimates, the effects of drought were not uniform across the Center-South region. The northern part was significantly more affected than the southern portion. Additionally, from October to December, rainfall and soil moisture levels remained higher than in 2020 before the 21/22 crop failure. Therefore, we believe that it is still premature to forecast a cane volume below 600 Mt. Despite reverting to more typical yields, the 24/25 season is unlikely to represent a major failure, remaining within the higher range of cane and sugar production observed in previous years.
Image 2: Center-South - soil moisture in the cane areas (mm in top 0-1.6m soil)

Source: Refinitiv, hEDGEpoint
Although the cane is aging slightly due to disruptions in 18-month planting caused by rains, we anticipate an increase in area of at least 1.25%. This expansion may offset some of the impacts of aging cane, ensuring a sufficient raw material supply. The average age of the cane is expected to increase from 3.2 to around 3.4 years, slightly lower than the 3.5-year average observed between 20/21 and 21/22 seasons.
By analyzing proxy regions considering rainfall patterns, we estimate that approximately 30% of the Center-South's cane production received average rainfall, while 23% experienced below-average levels and roughly 47% recorded minimal levels. Although our statistical model, which accounts for lost days and average soil moisture from December to February, suggests a milder impact, it's essential to consider historical data trends and market forecasts. Taking all factors into consideration, the Center-South region could see an 8.4% decrease in yield, reverting to a more typical TCH of nearly 79 t/ha and around 605.8Mt of cane.
What is the global impact? For the purpose of this exercise, we will examine three possible cane production figures: our previous estimate of 615 Mt, our revised estimate of 605 Mt, and a worst-case scenario of 595 Mt. It becomes evident that the outcome depends significantly on the sugar mix. With mills investing heavily in crystallization capacity, the index could increase from 51% to 52.5%.
Market indications suggest that the mix should be closer to 52%. With our adjusted cane production figures, this would entail a shift from nearly 42 Mt of sugar to 41.7 Mt (from scenario A to scenario B). In scenario B, total trade flow deficit between Q1/24 and Q1/25, considering simple calculations, would increase from -119 kt to -346 kt, therefore, the market would remain relatively balanced. In terms of global supply and demand, the primary impact would be a deepening of the forecasted deficit for 24/25 (Oct-Sep) from 2.3 Mt to 2.7 Mt. However, it's important to note that providing a reliable estimate for 24/25 is rather difficult, as weather conditions in the Northern Hemisphere could improve if the La Niña effect is less severe.
Image 3: Sugar Production Depending on Cane and Mix (Mt)

Source: hEDGEpoint
Image 4: Global Trade Flows (Q1/24-Q1/25) Depending on Cane and Mix (Mt)

Source: hEDGEpoint
Image 5: Sugar Global Balance (605Mt and 52% Sugar Mix – Oct/Sep Mt rv)

Source: Green Pool, hEDGEpoint
Funds would not have a short-term interest in participating in the market, as other soft commodities offer potentially higher gains with greater volatility, such as cocoa. Therefore, while we await further developments in the weather, short-term fundamentals appear to be fairly priced in, and we could see more trading within the 20-22 c/lb range, with potential upside to 23 c/lb depending on how the market interprets the start of the Brazilian Center-South 24/25 crop.
In Summary
Weekly Report — Sugar
livea.coda@hedgepointglobal.com
laleska.moda@hedgepointglobal.com

