Sugar and Ethanol Weekly Report - 2024 03 25
"The price downturn experienced in December created favorable conditions for nonproducing regions, leading to significant buying activity and higher-than-expected imports from China in January and February, despite prior high import volumes. This behavior underscores the importance of considering regional price disparities rather than solely relying on ZCE parity."
China’s impact on the sugar market
- Recent data indicates positive developments in the Chinese economy, with signs of exiting deflationary trends and ambitious fiscal targets set for 2024.
- Despite challenges, cautious optimism is warranted for sustainable economic growth in China, with market sentiment suggesting an optimistic outlook for the country through 2024, potentially supporting sugar prices.
- China's influence in the market has been notable, establishing a price floor at 20.5 c/lb
- The price downturn experienced in December created favorable conditions for nonproducing regions, leading to significant buying activity and higher-than-expected imports from China in January and February, despite prior high import volumes. This behavior underscores the importance of considering regional price disparities rather than solely relying on ZCE parity.
Recent data indicates a brighter outlook for the Chinese economy, with signs of exiting deflationary trends, at least temporarily. The government has outlined ambitious fiscal targets for 2024, and initial trade figures for 2024 show positive results. However, significant challenges persist, underscoring the need for cautious optimism. Effective management of the fiscal deficit and restoring confidence in the private sector are crucial for sustainable economic growth in China. Nevertheless, we do not aim to discuss Chinese economic trends further in this report, it is enough to understand that the market is pricing a rather optimistic picture for the Asian Giant through 2024, and this can add support to sugar. (For more information regarding the country’s framework, check our macro report released March 21.)
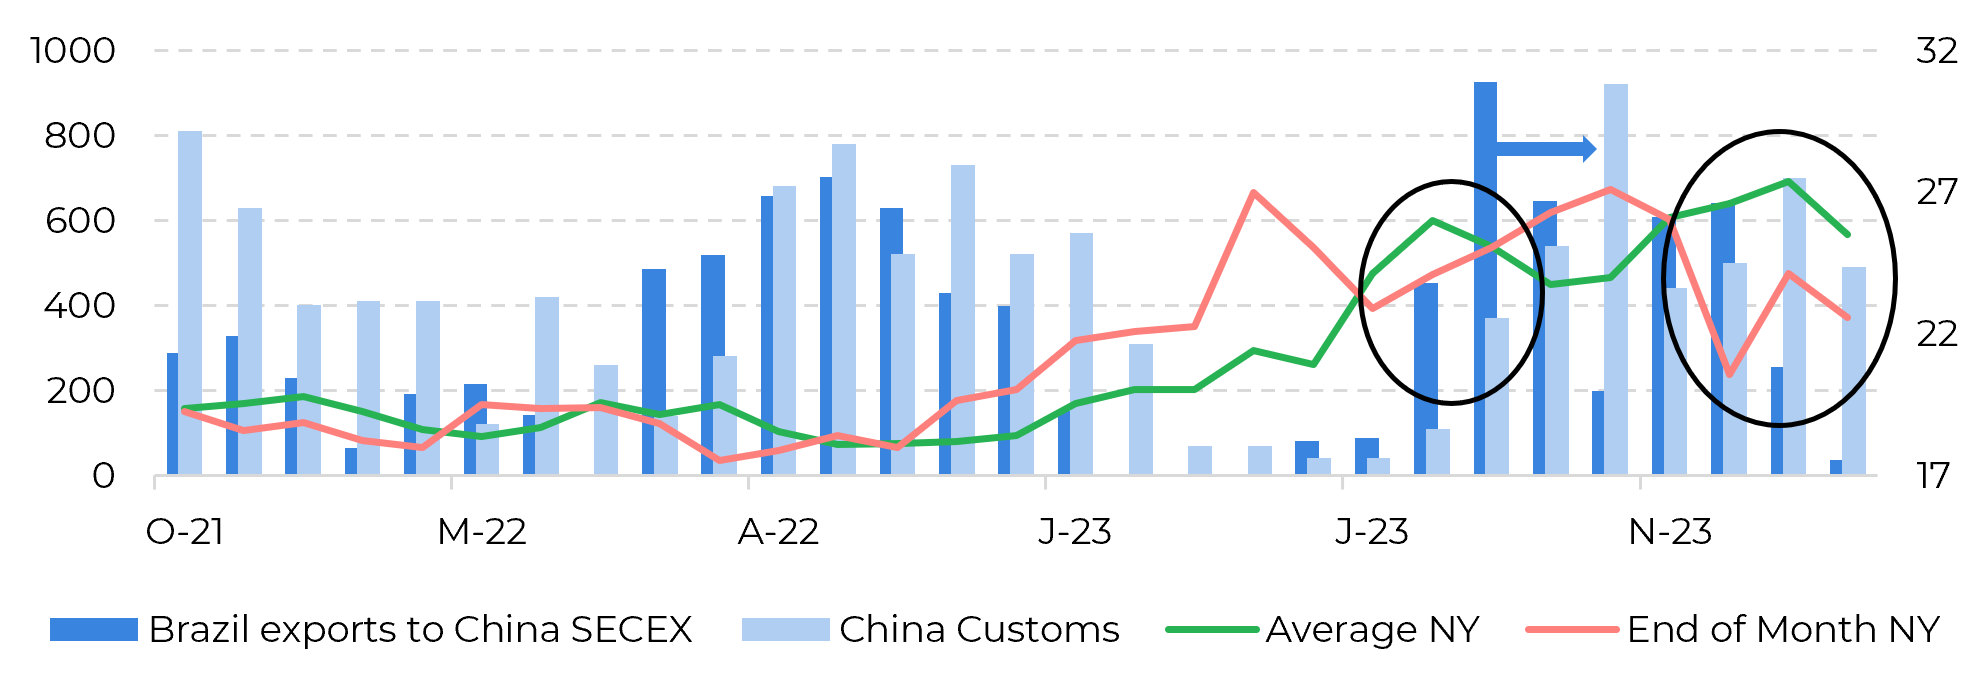
Going back to our sweet market, China has indeed played an important role lately. The country has been responsible for the recently found price floor at 20.5c/lb. And why is that? Let’s start from the beginning. First, looking at price trends and Brazil and Chinese customs, it becomes clear that lower prices trigger more immediate Brazilian exports, which take an average 30-45 days to reach the Asian country and be registered in their customs – if that volume is nationalized, that is another topic.
Image 1: Brazilian exports (‘000t) to China, China imports (total ‘000t) and raw prices (c/lb)

Source: SECEX, GSMN, Refinitiv, hEDGEpoint
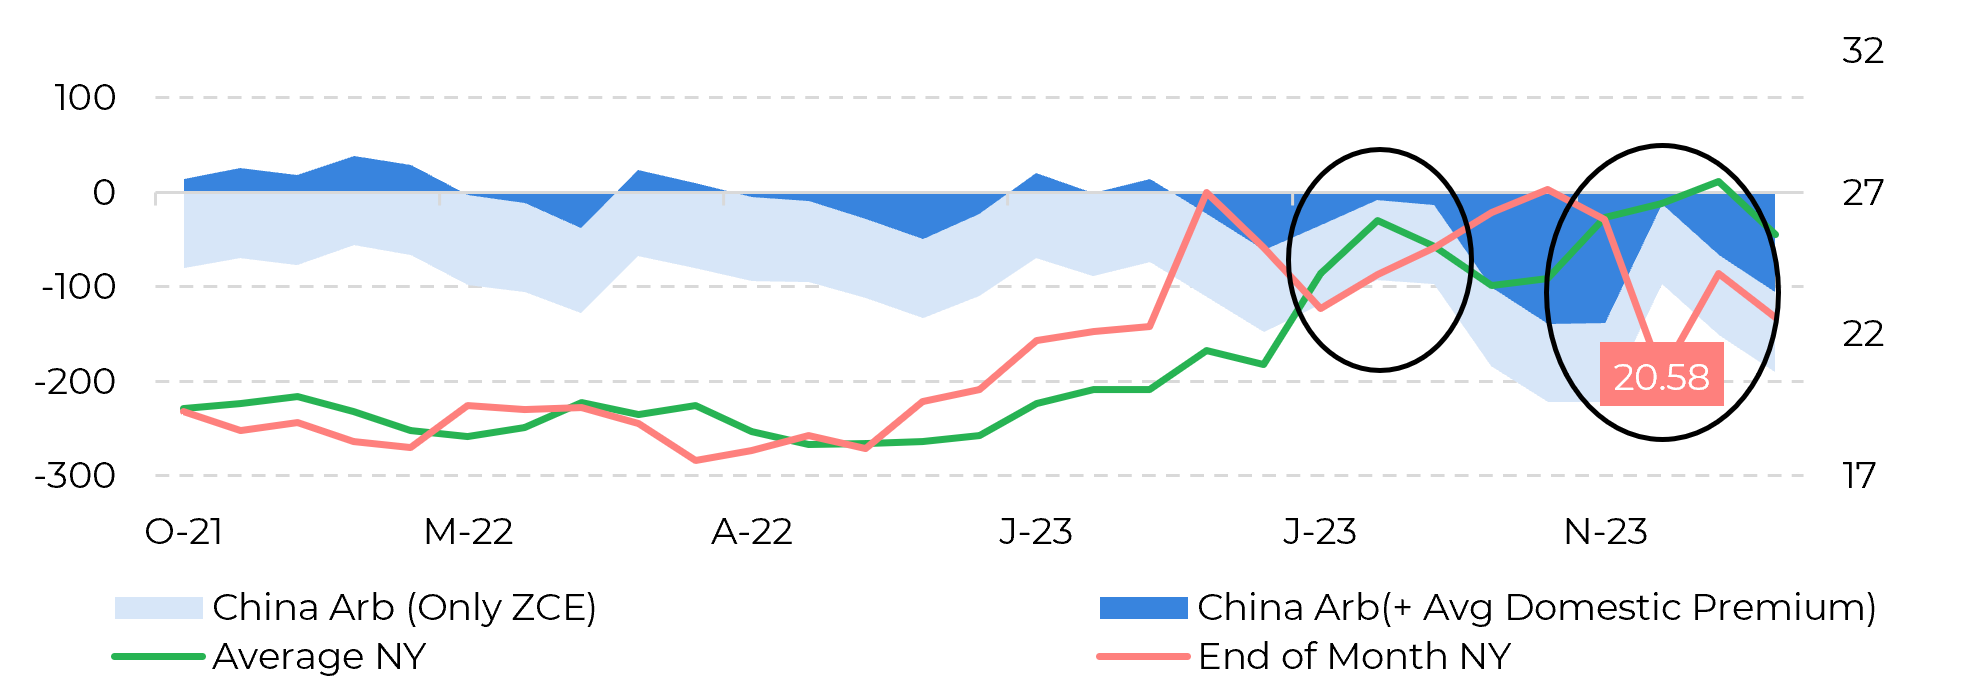
With the price burst observed since the end of 2022, Chinese import arb has been fairly closed – at least considering ZCE prices only. However, for analytical purposes, we decided to consider different prices depending on whether the region is or not a producer, meaning that domestic prices of nonproducers should be higher. We estimate that this premium would be of about 600 RMB/t. Therefore, nonproducing regions should choose to buy from the domestic market or import.
Image 2: Chinese import arbitrage from Brazil (USD/t) VS raw prices (c/lb)

Source: Refinitiv, Bloomberg, hEDGEpoint
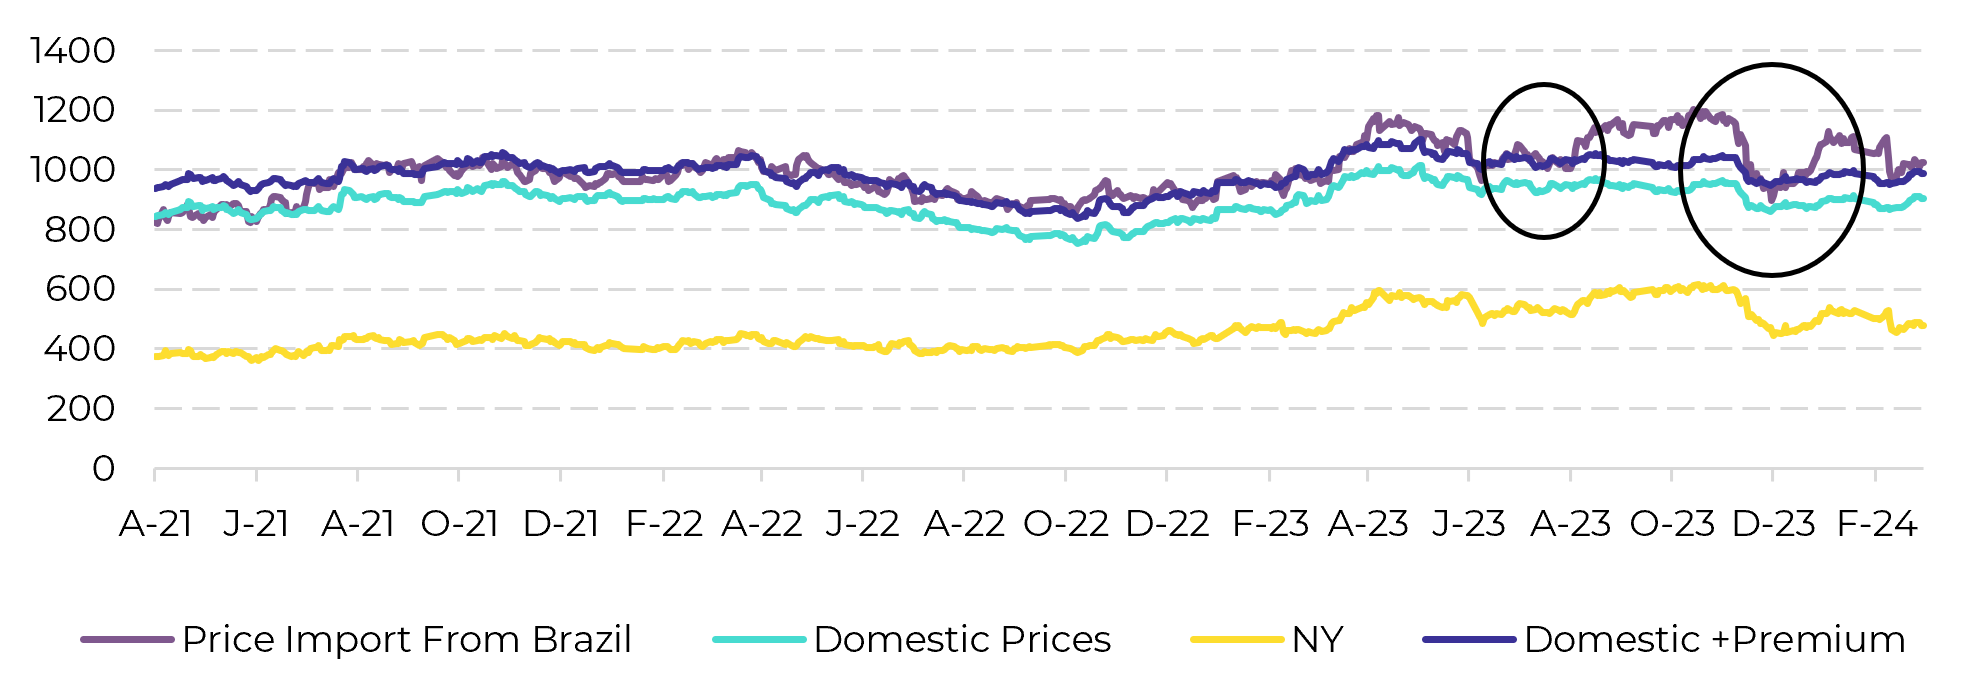
Looking back, the price meltdown experienced in the latter half of December reached attractive levels for nonproducing regions between the 18th and January 5. During this timeframe, average prices stood at 20.8 c/lb. Strictly considering the ZCE parity without any additional premium, it was closed by approximately 70$/t during the same period. In light of the latter, it would have been economically unjustifiable for China to boost its imports in the absence of price disparities among regions. Nevertheless, significant buying activity did occur during that period, culminating in higher-than-anticipated imports from China during January and February. This behavior was especially surprising as it was short after the significant deliveries in October and a high import volume last August, when arb was estimated to be marginally open for nonproducers.
Image 3: Sugar prices in China Vs Raws in USD/t

Source: Refinitiv, hEDGEpoint
In Summary
Weekly Report — Sugar
livea.coda@hedgepointglobal.com
laleska.moda@hedgepointglobal.com

