Slow market, higher macro influence
"Recent rains in Center-South and the lack of other relevant news stabilized sugar prices, making them more influenced by external market factors like energy prices and macro framework."
Slow market, higher macro influence
- Recent rains in Center-South and the lack of other relevant news stabilized sugar prices, making them more influenced by external market factors like energy prices and macro framework.
- October was slow for sugar trading, with funds losing interest amid lower volatility.
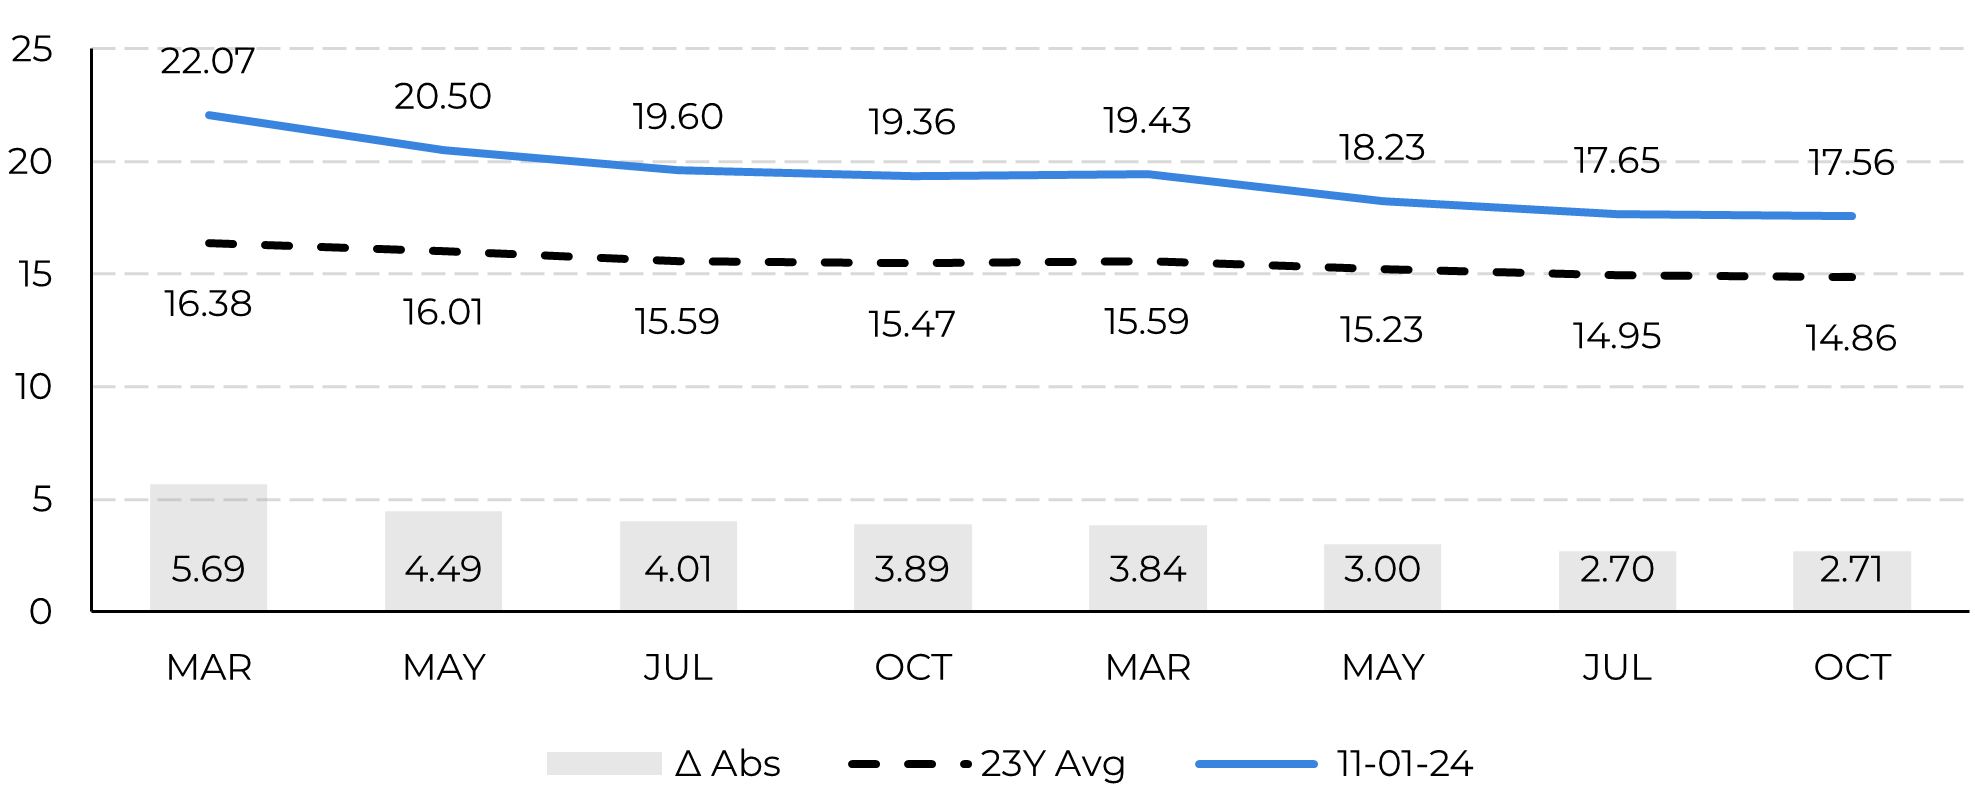
- Prices remain supported, with the March contract trading 500 points above historical averages, though stronger news is needed for any price breakthrough.
- Brazil’s October exports likely topped 3 Mt, supporting stable prices. Reduced supply by the country in late 2024 may aid price-recovery, especially if India limits exports.
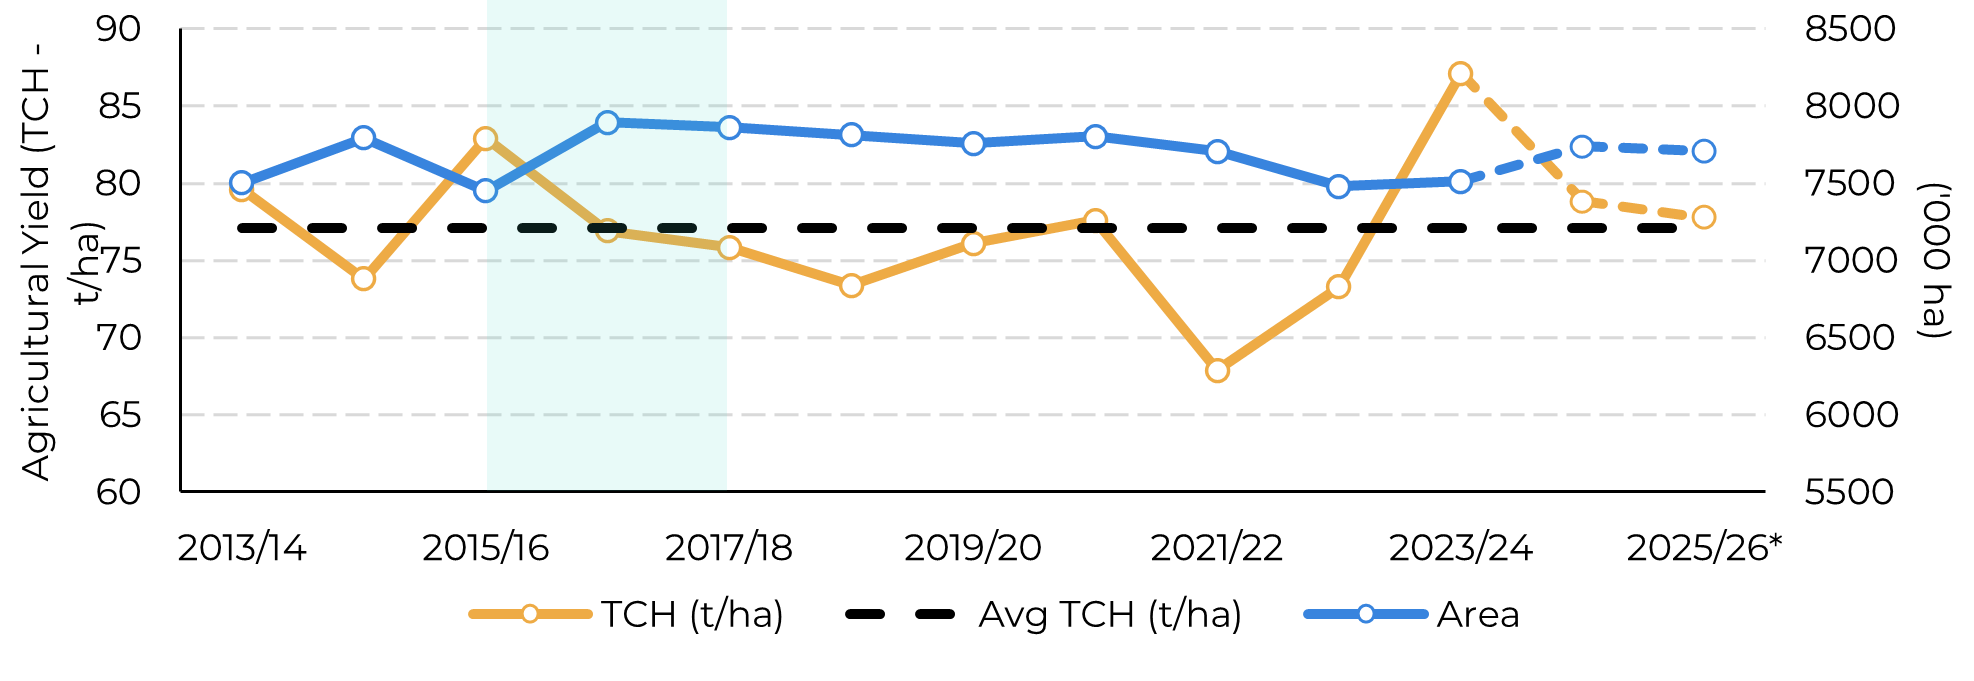
- For 2025/26, CS cane output is revised to 600 Mt, dependent on summer rains, suggesting potential price support into 2025.
It seems that the lack of news coupled with the recent rains in the Center-South region and favorable weather forecasts are leaving sugar more exposed to external market factors. The energy complex meltdown on last Monday, with crude oil dropping over 5% and natural gas correcting by more than 10% amid easing geopolitical tensions, took a tool on sugar prices, which have been overall stable. As a result of a dull market, funds and speculators appear to be losing interest, with October proving to be a slow month for the March contract.
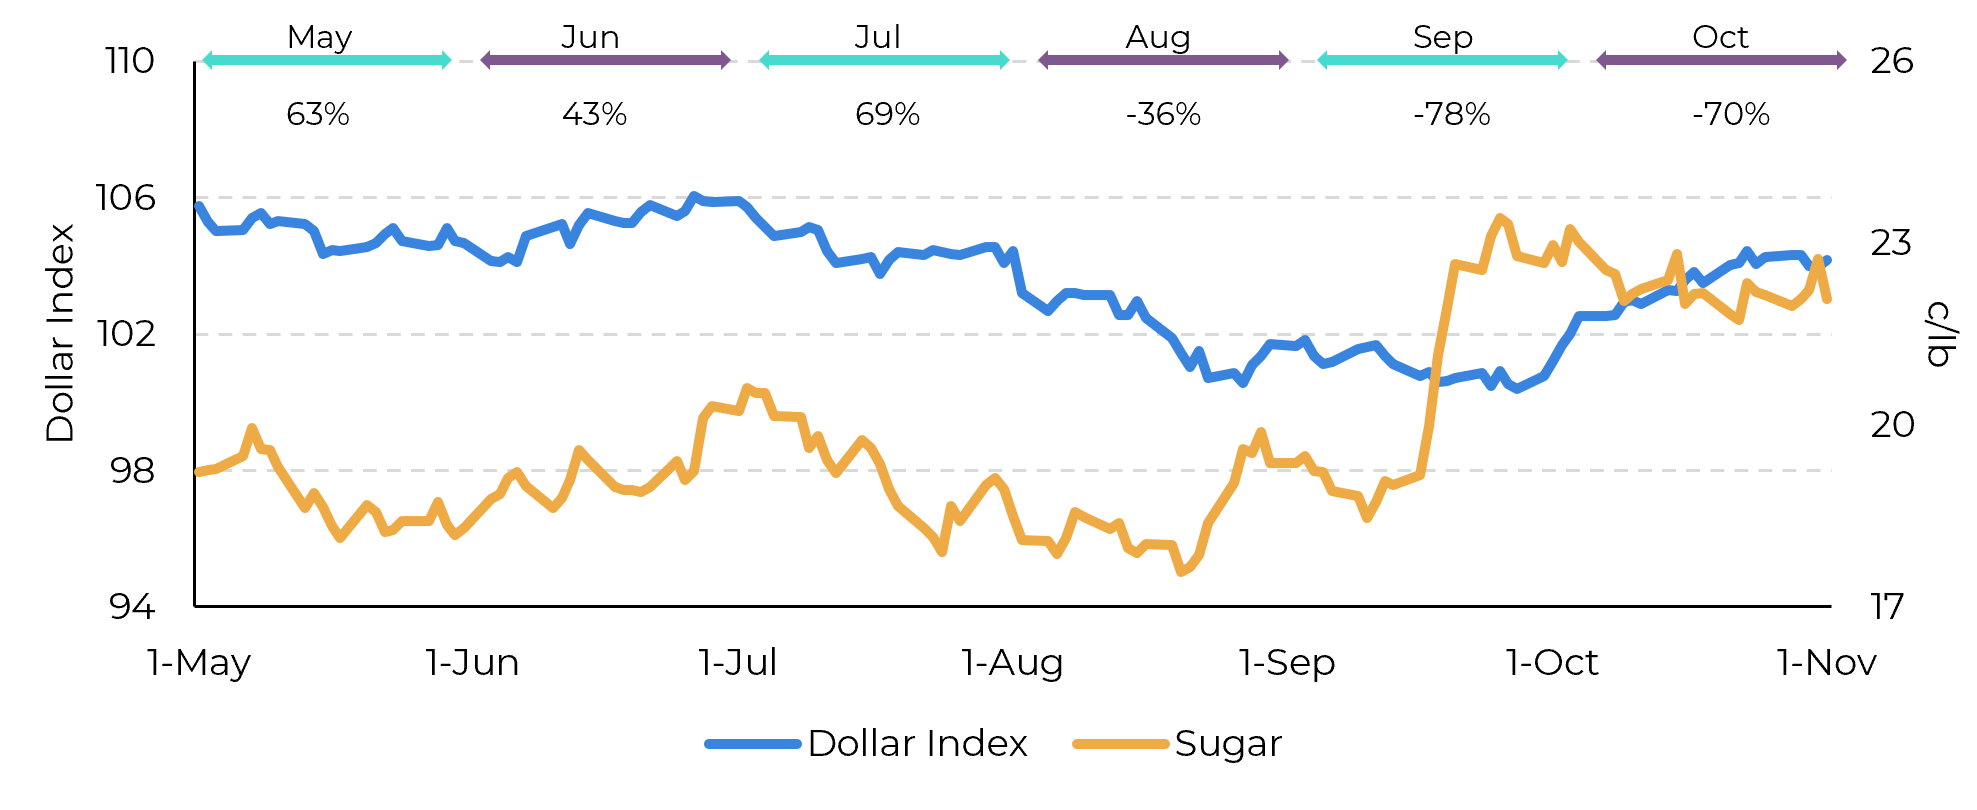
The removal of the risk premium associated with the war, combined with a stronger USD – despite the interest rate cuts in September – has contributed to a stable-to-weaker sugar market throughout last week. This trend is noteworthy, as it suggests that sugar is starting to regain its long-lost negative correlation to macro, hinting that the market currently lacks strong new fundamentals.
Image 1: Monthly correlation between the dollar index and raw sugar

Source: Refinitiv, Hedgepoint
Image 2: Raw Sugar's Historical Future Curve Comparison (USc/lb)

Source: Refinitiv, Hedgepoint
Image 3: Total Exports - Brazil CS ('000t)

Source: Williams, SECEX, MAPA, Unica, Hedgepoint
Image 4: Precipitation anomaly forecast (mm)

Source: inmet
Image 5: Historical area vs yield comparison

Source: Unica, CTC, Hedgepoint
In Summary
Weekly Report — Sugar
livea.coda@hedgepointglobal.com
laleska.moda@hedgepointglobal.com
Disclaimer
Contact us
Check our general terms and important notices.
We have updated our Terms & Conditions to reflect improvements to our platform, data handling practices, and the overall experience we provide to our clients.

