Sugar and Ethanol Monthly Report - 2024 02 01
"With seasonally higher demand, especially considering the approach of the Ramadan festivities, prices moved back to the 24c/lb level but failed to surpass 24.5c/lb during January. Trade flows and global S&D show us that the market is currently trading at a tight range. Any event, either bulls or bears, can trigger the price and bring funds back into the game. It seems that the market is quietly waiting for a signal, and analyzing some variables has become essential. "
S&D and Trade Flow
With seasonally higher demand, especially considering the approach of the Ramadan festivities, prices moved back to the 24c/lb level but failed to surpass 24.5c/lb during January. Of course, Brazil keeps adding to the bears' side, being responsible for nearly the complete offset of the Northern Hemisphere absence. But a word of caution: the market is in a tight balance.
Moving from a deficit to a surplus, the global balance seems to be signaling a tight price range, with quite some volatility to be expected. Trade flows show the same: we are walking on thin ice. Any event, either bulls or bears, can trigger the price and bring funds back into the game. It seems that the market is quietly waiting for a signal, and analyzing some variables has become essential. The main one is weather: will it help a healthy 24/25 Center-South season?
Although we believe it is tittering to the bear side - so far it wasn't ideal but definitely not catastrophic - a drier-than-average summer could add to the bulls. Also, will we shift to a La Niña year? The latter is still quite premature to answer. However, assuming more "normal" weather, the market should remain stuck in this range for a while, but probably drive away from major price recoveries.
Image 1: Total Trade Flow ('000t)

Source: hEDGEpoint
Image 2: Raw's Trade Flow ('000t)

Source: hEDGEpoint
Image 3: White's Trade Flow ('000t)

Source: hEDGEpoint
Image 4: Global Supply and Demand Balance (MT RV oct-sep)

Source: hEDGEpoint
Brazil CS
Image 5: Sugar Balance - Brazil CS (Apr-Mar Mt)

Source: Unica, MAPA, SECEX, hEDGEpoint
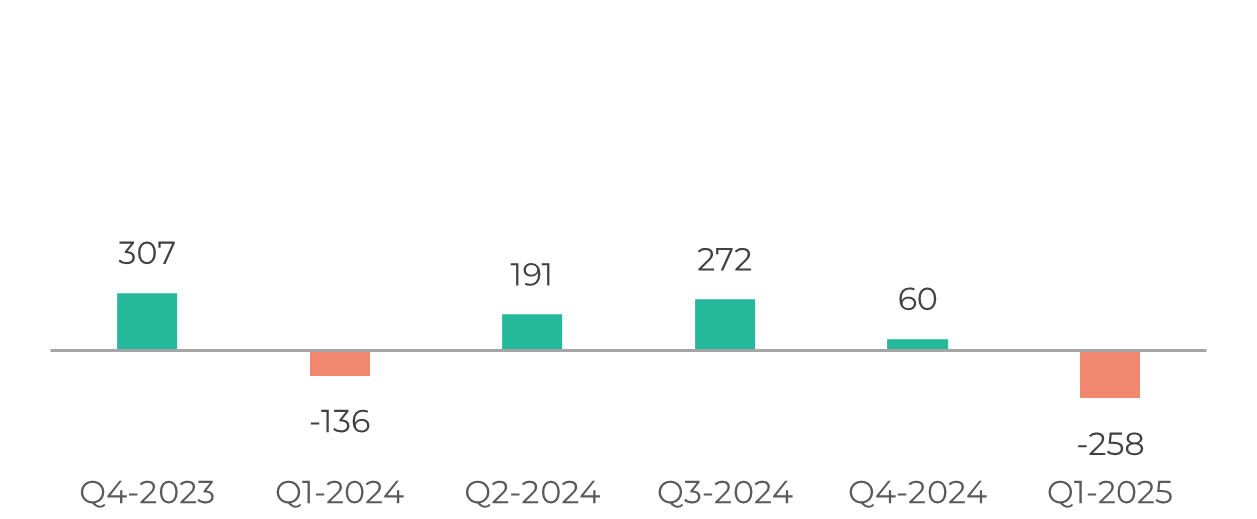
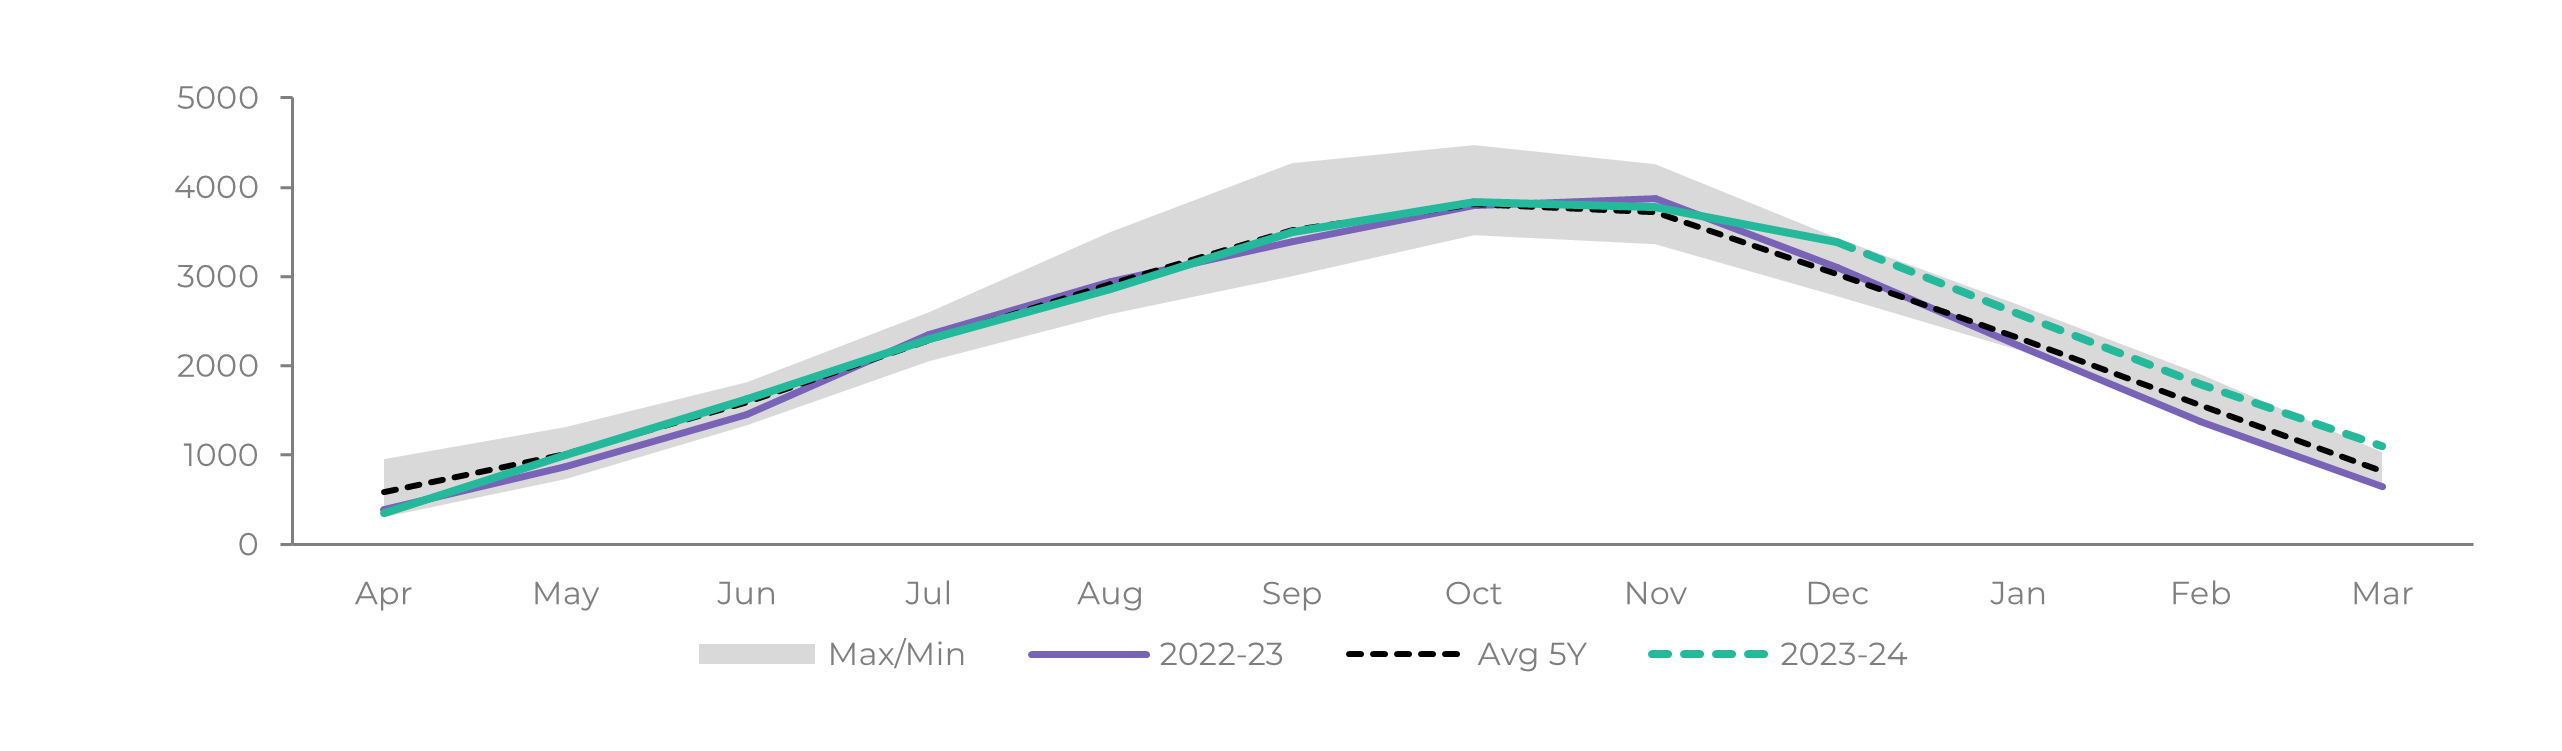
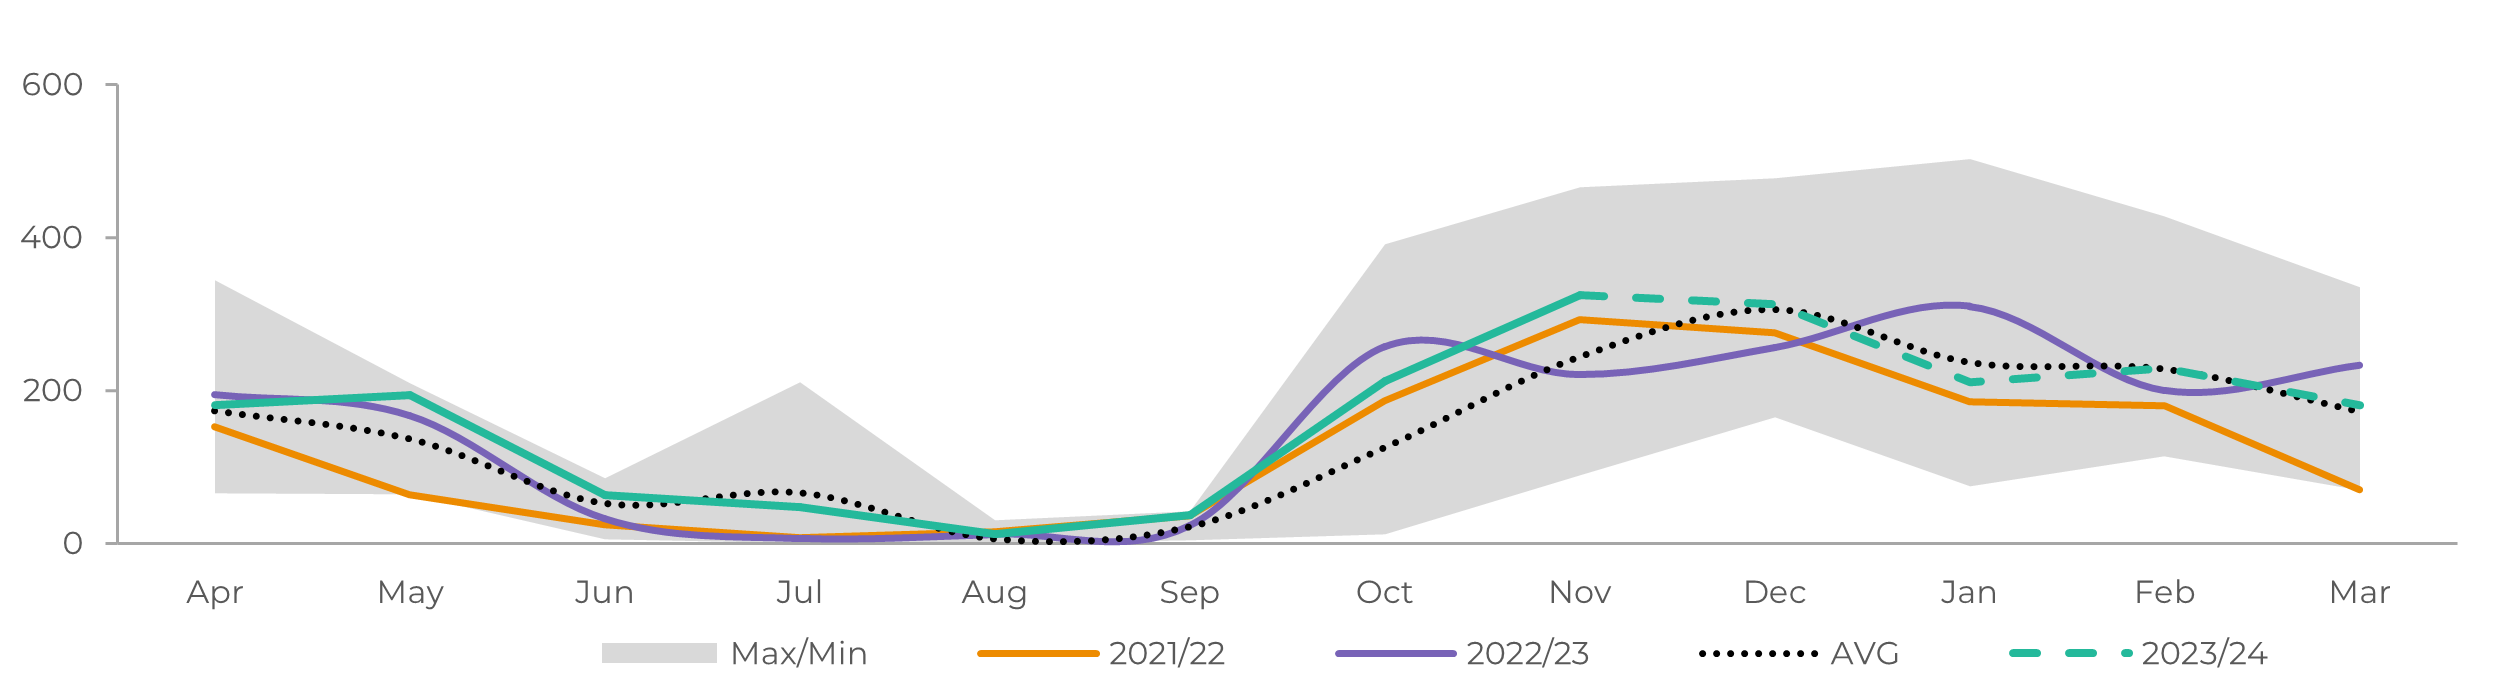
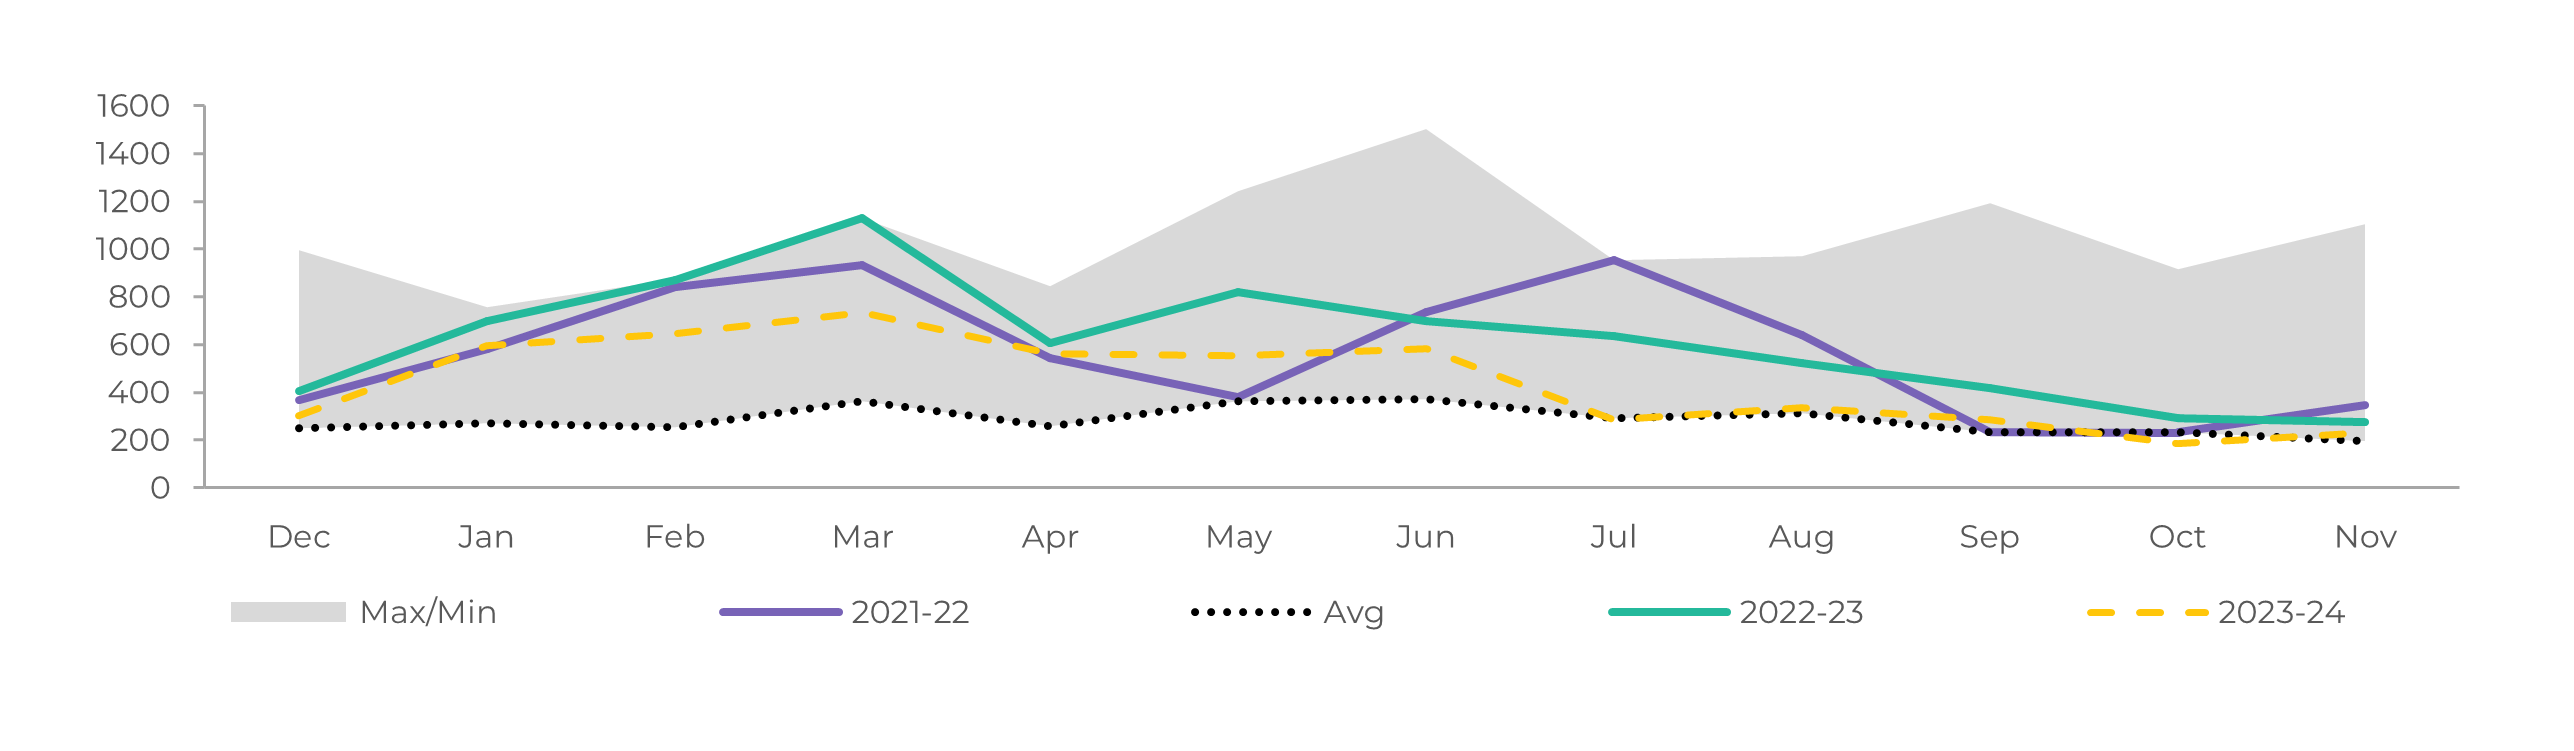
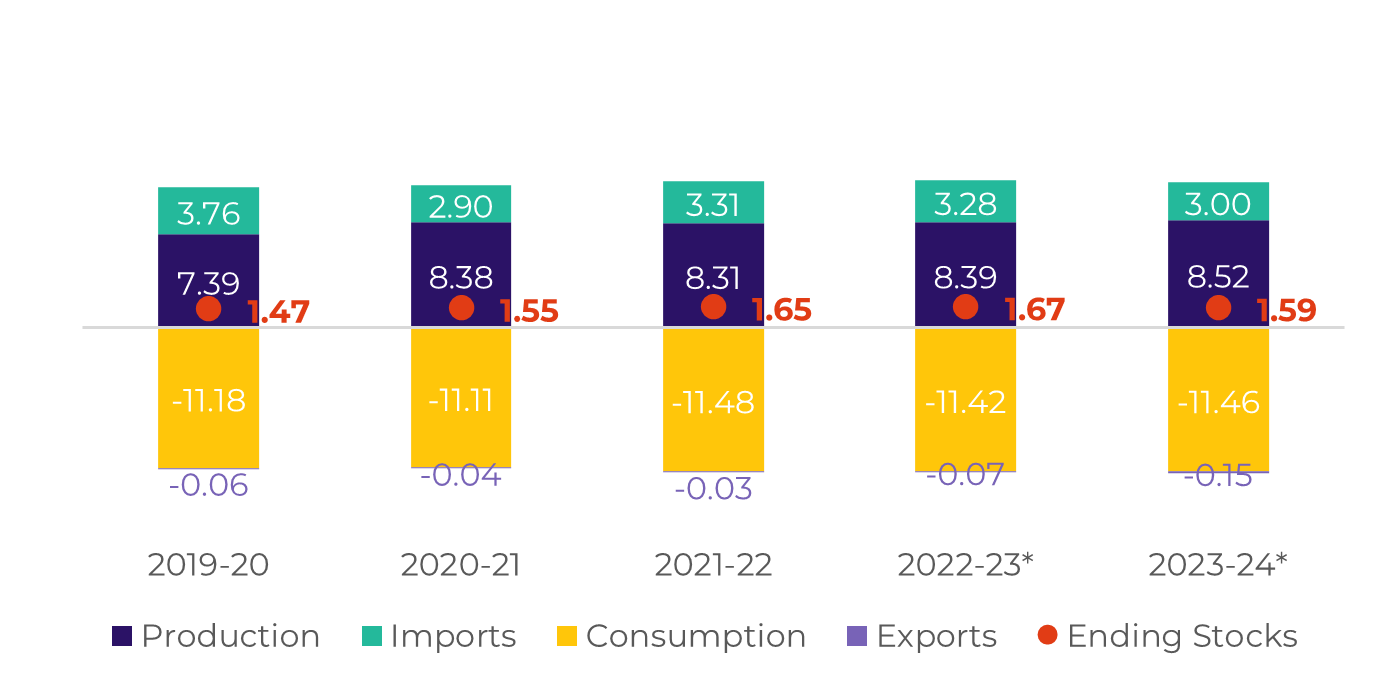
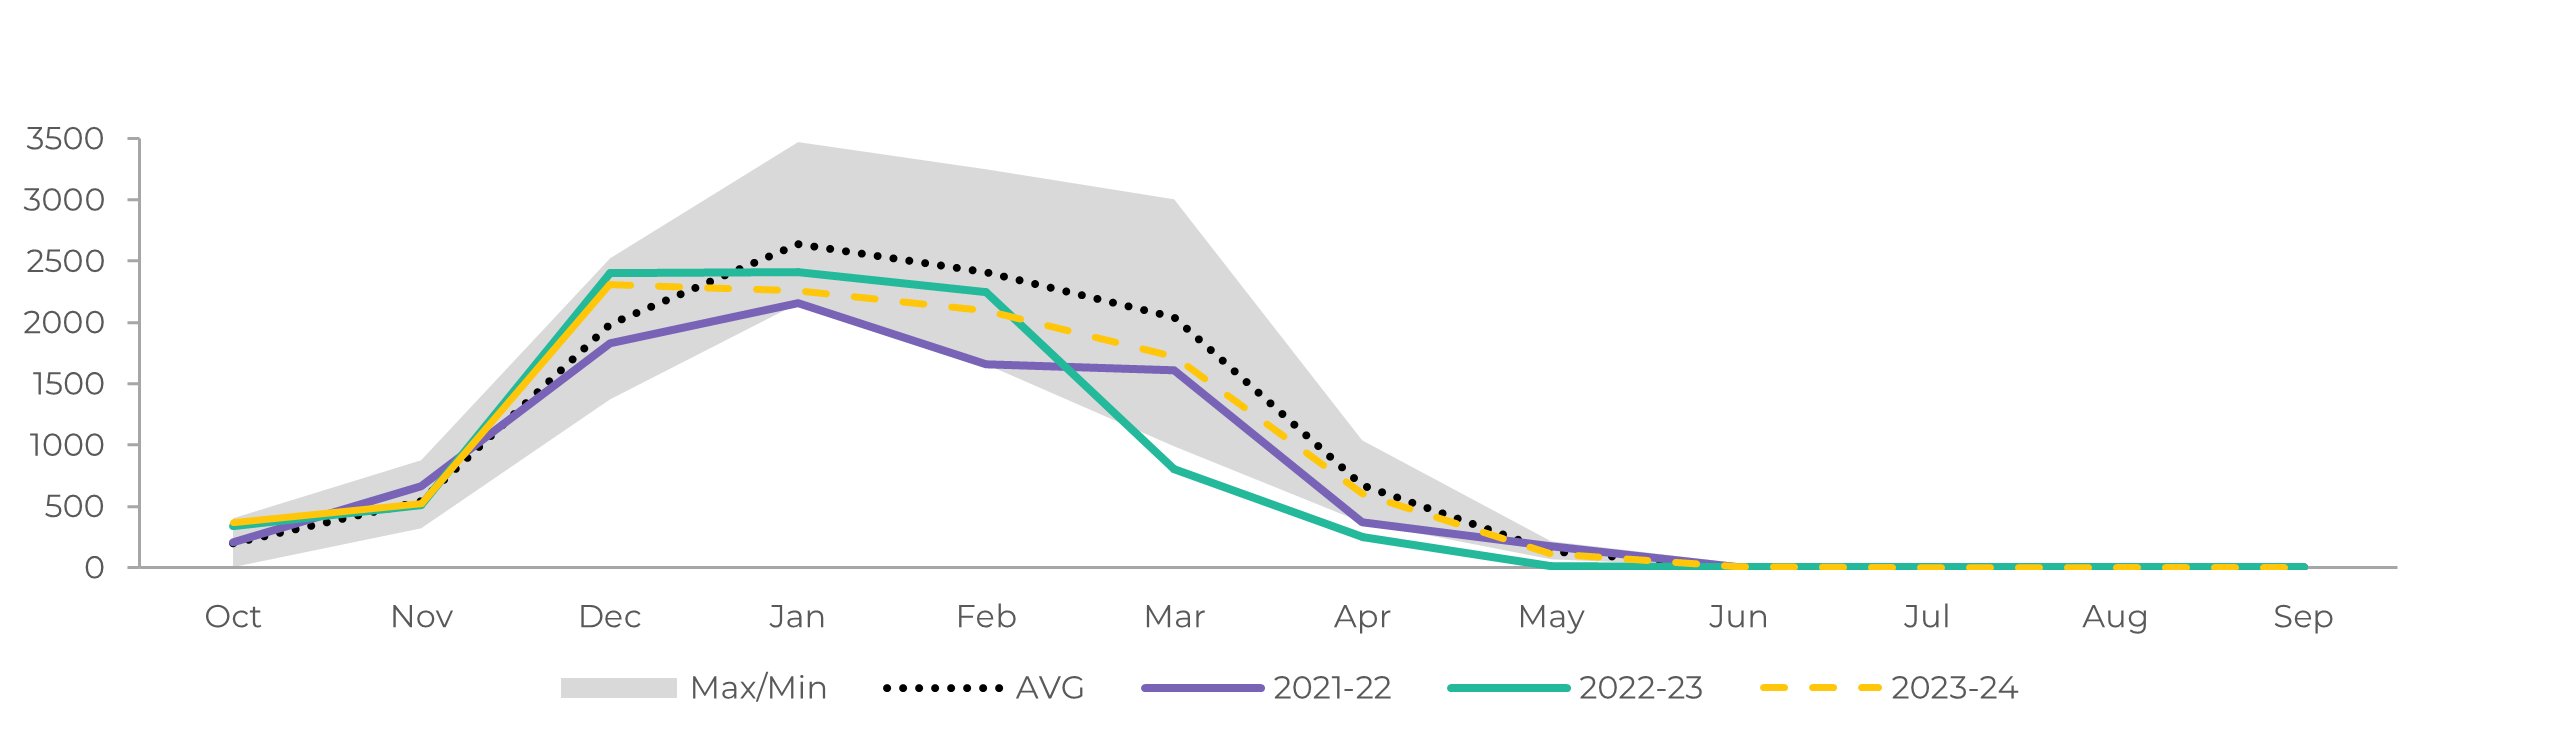
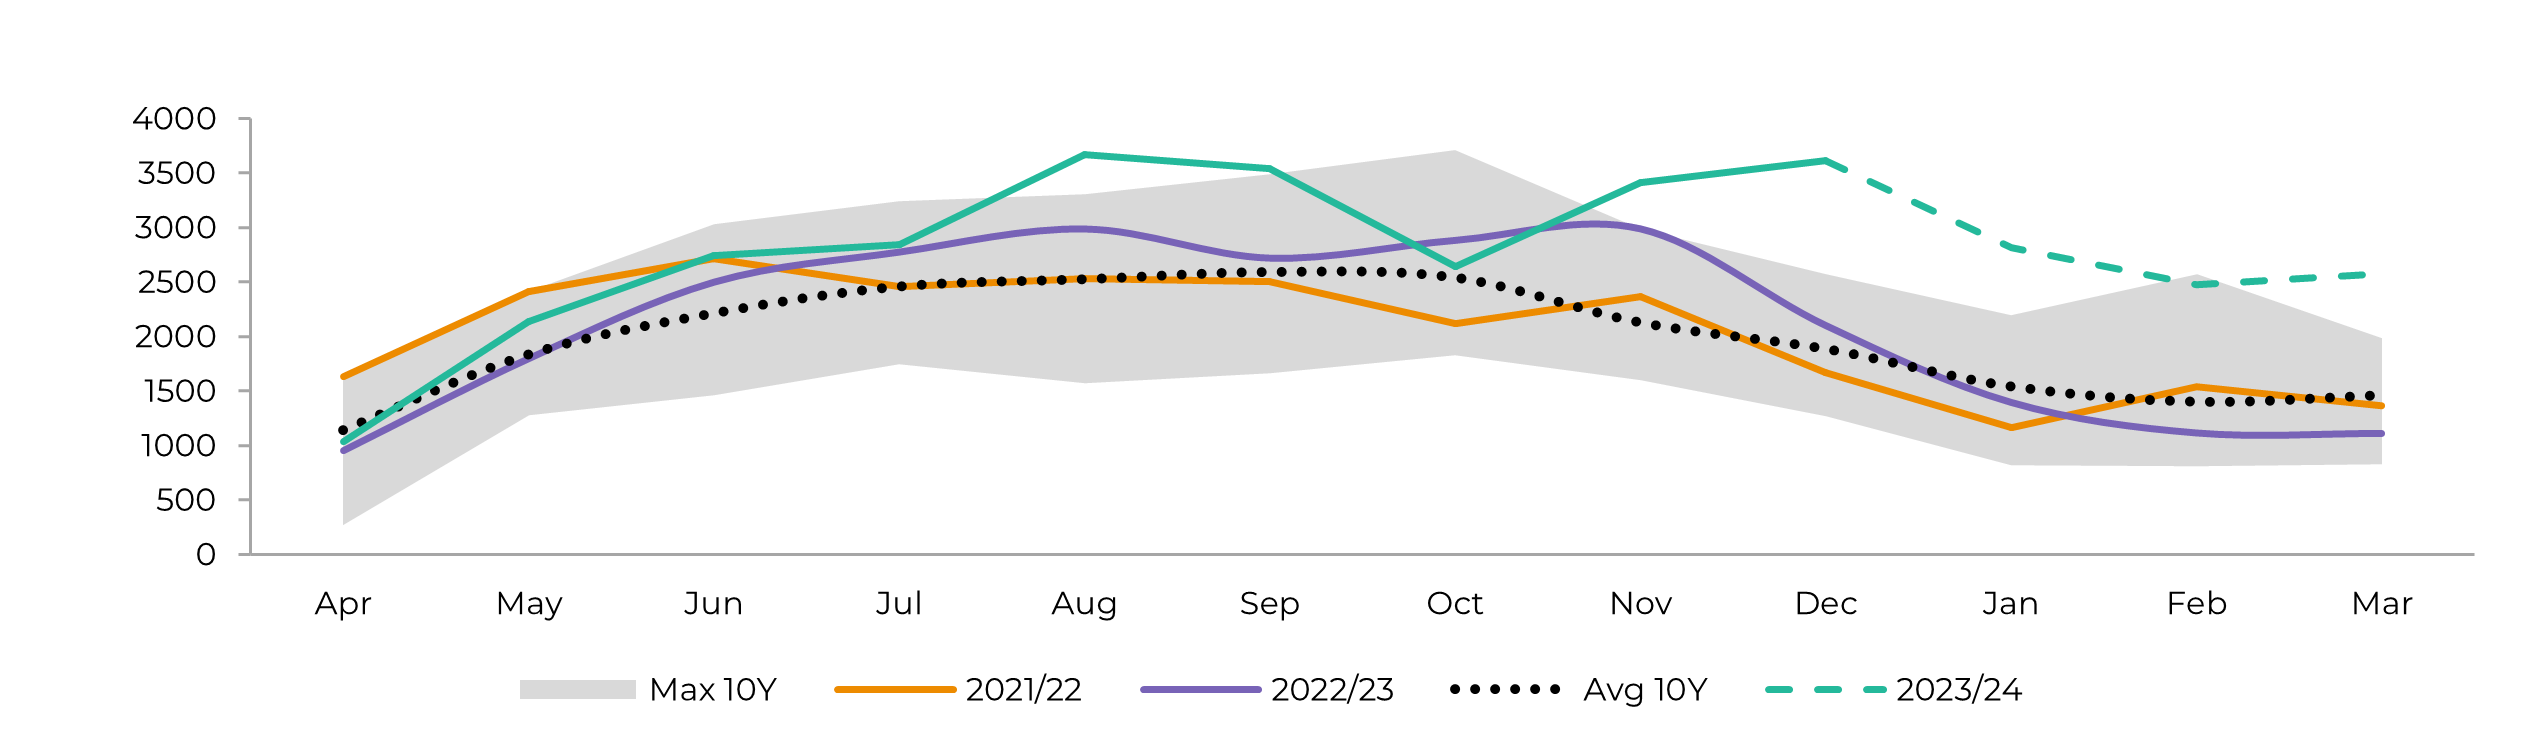
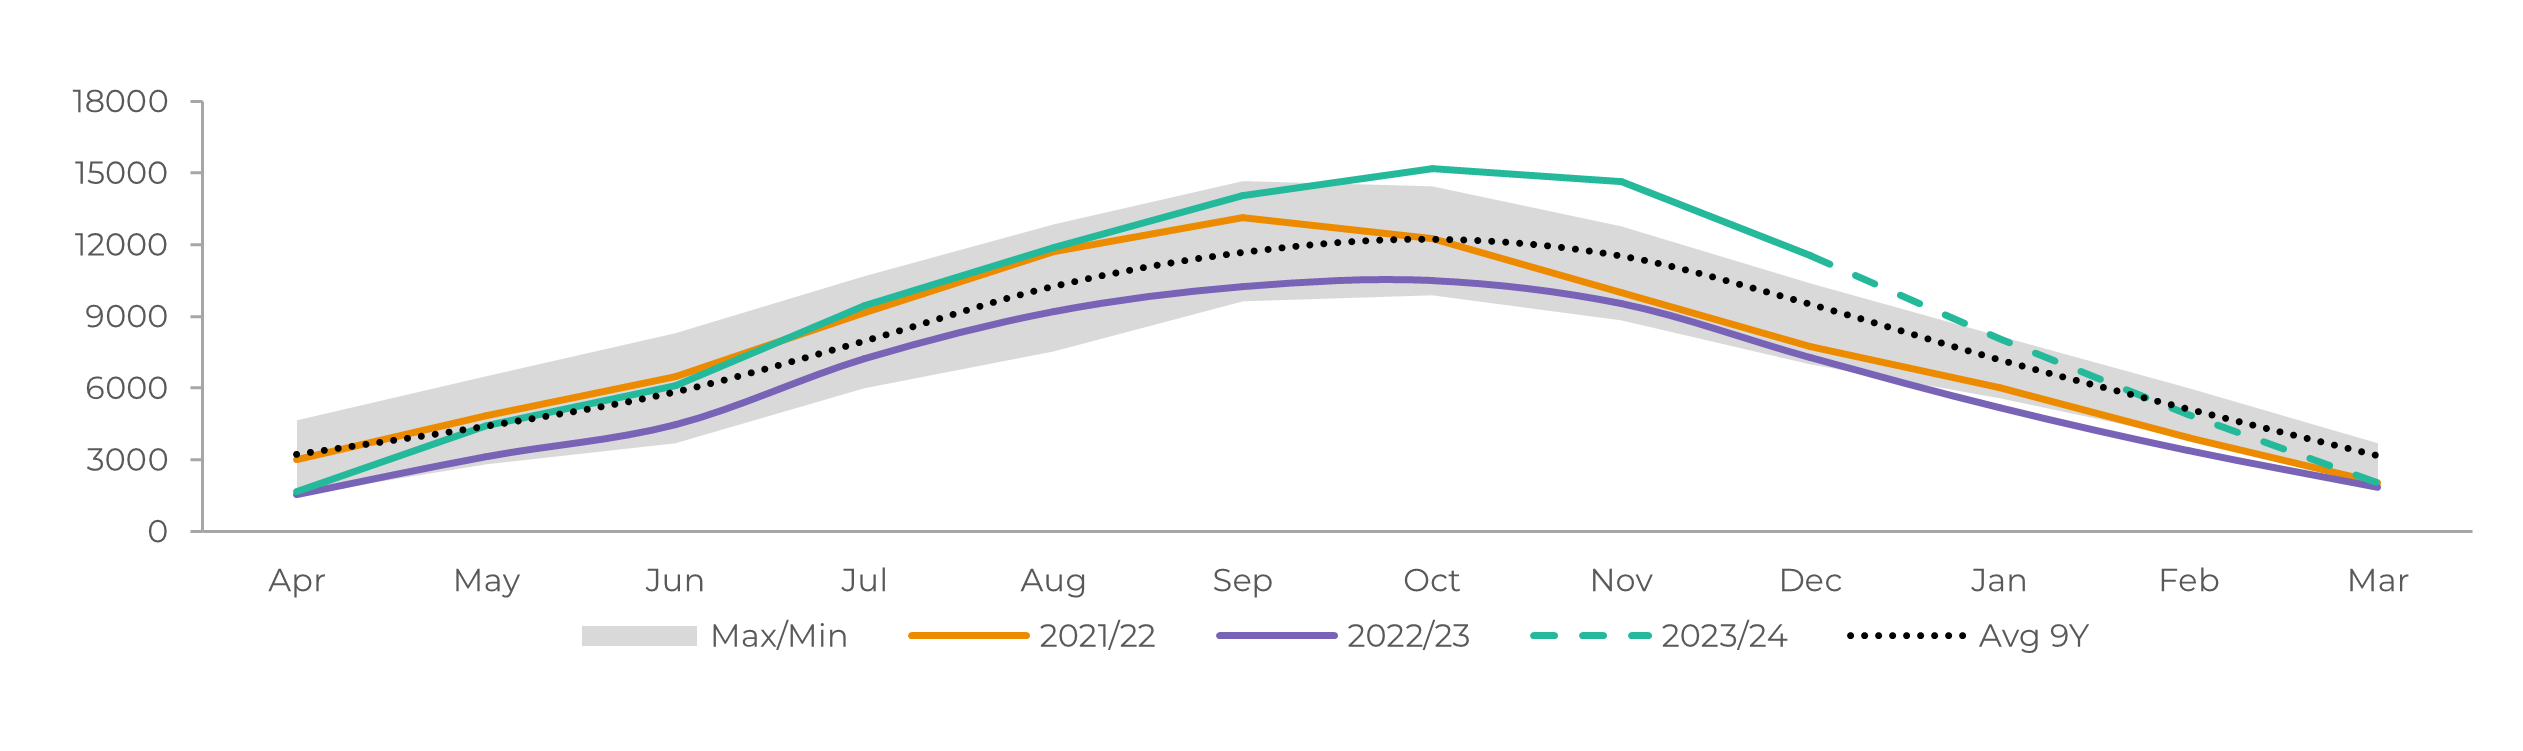
Crushing has already reached 645.4Mt by January's first fortnight. This means that if the weather remains average or slightly below, the region could end up crushing all of its 23/24's availability - which is close to 655 Mt.
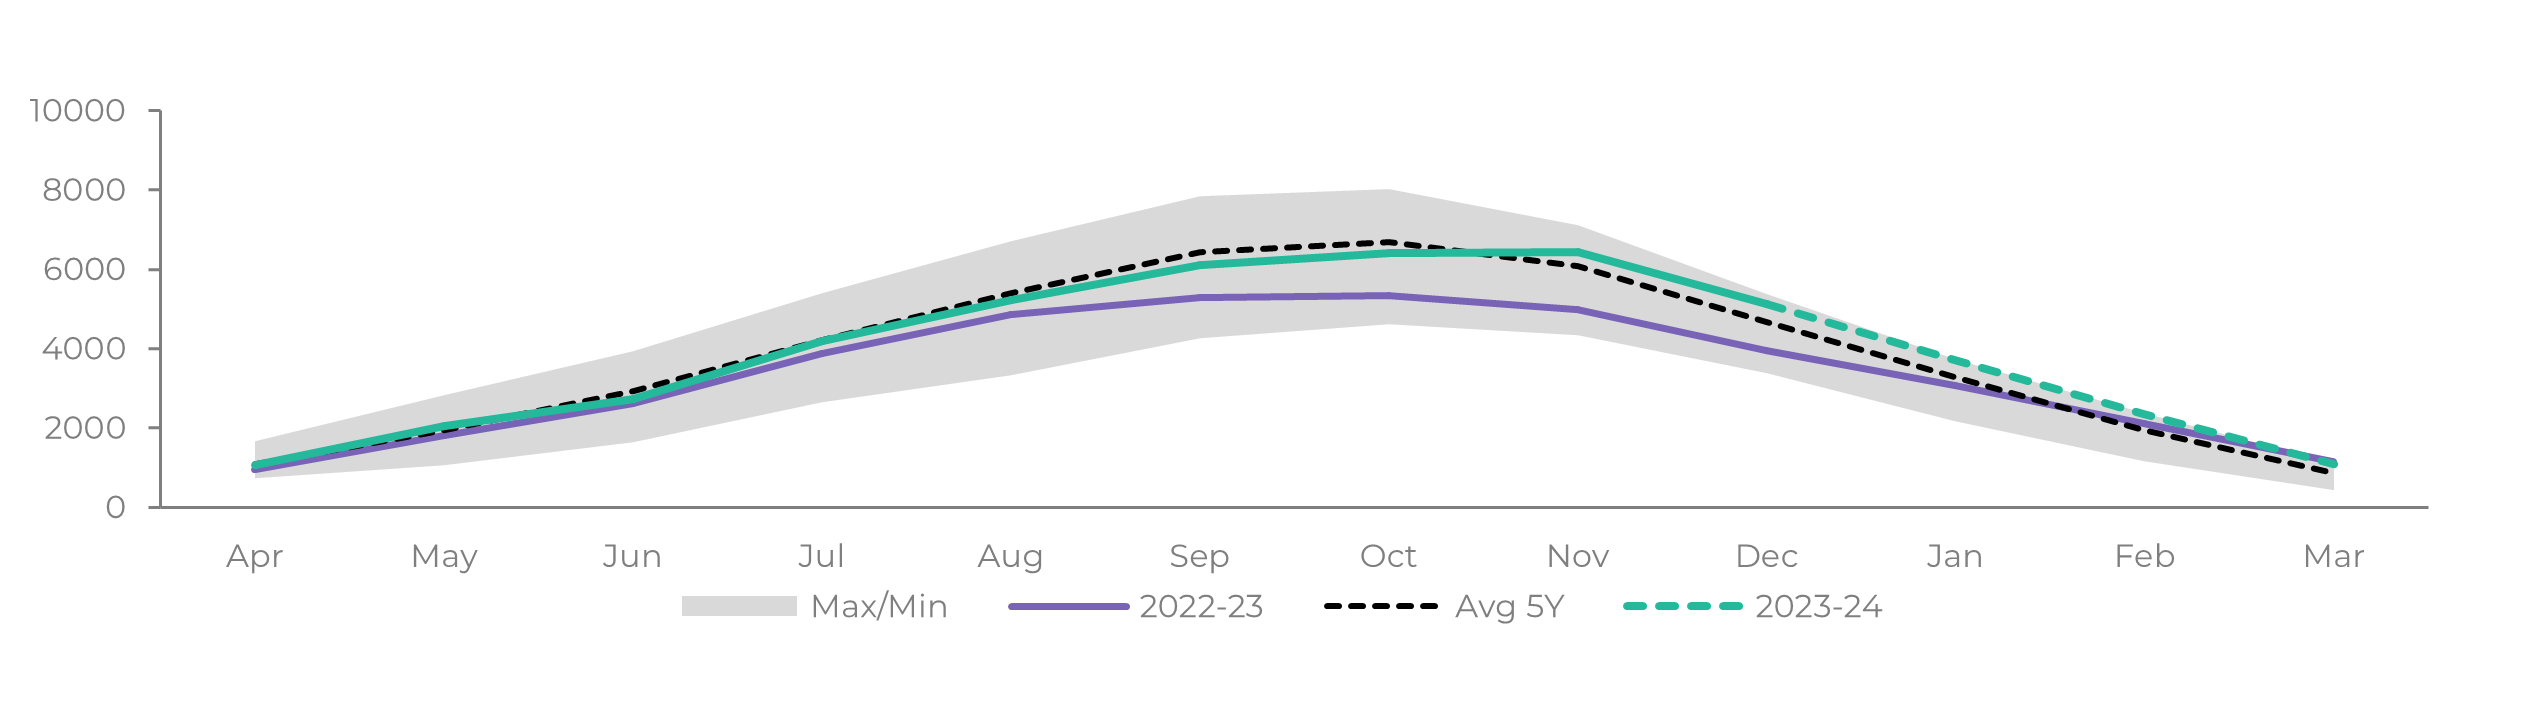
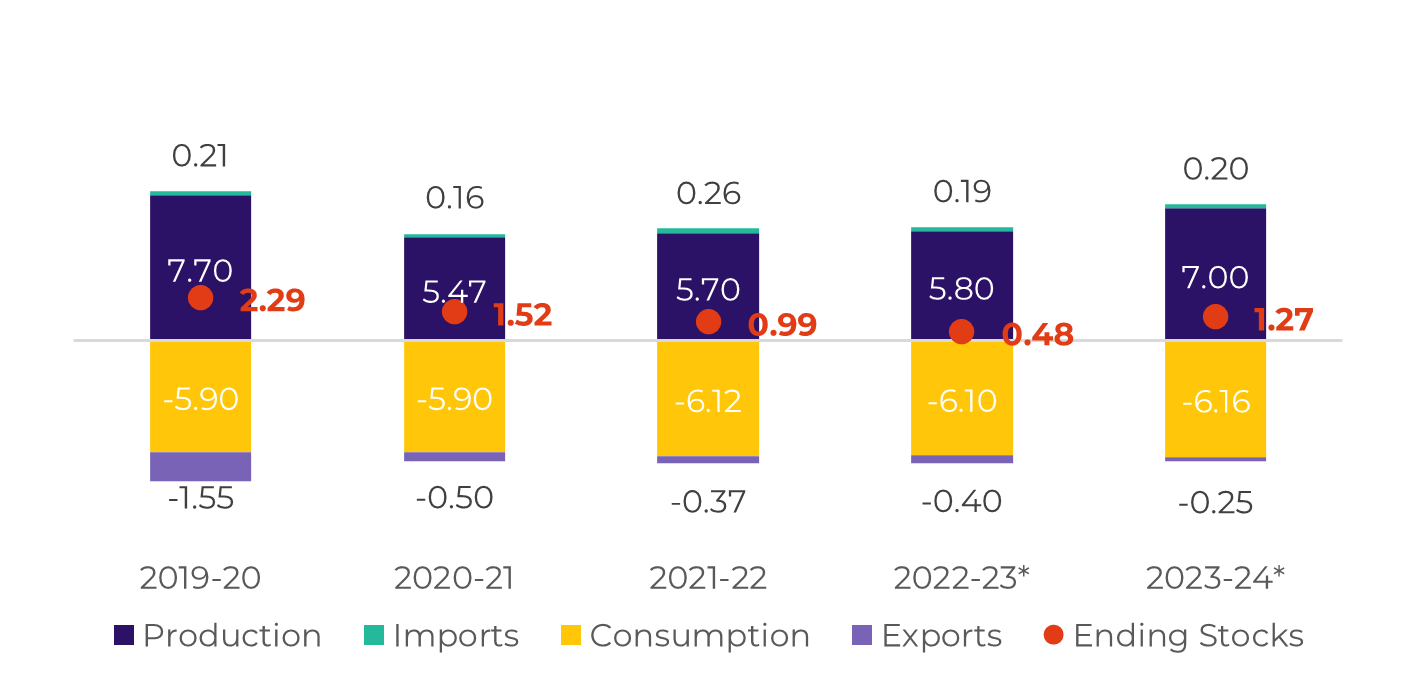
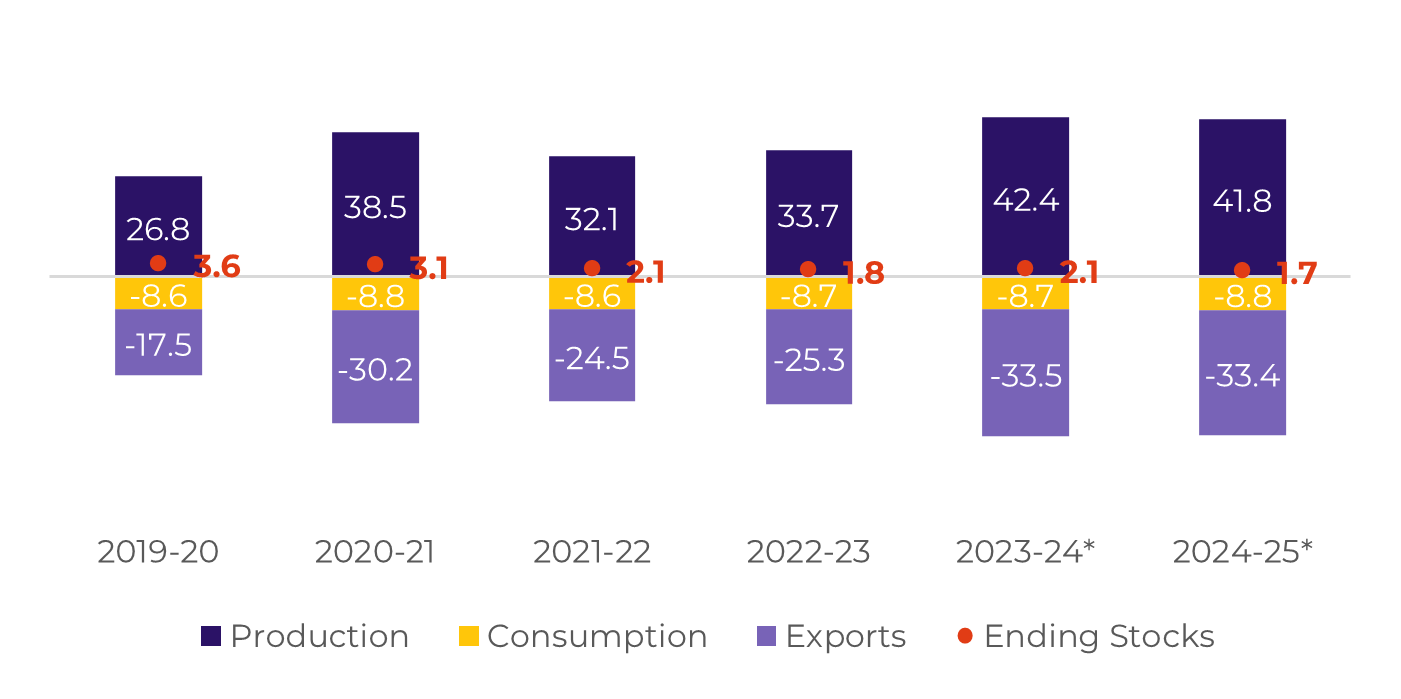
For the next season, weather hasn't been completely favourable for cane development, therefore, we should not expect crushing to reach the same levels as in 23/24. Currently, we estimate around 620 Mt of cane, which, when coupled with a higher sugar mix of nearly 51%, could lead to the Center South region's second-best sugar production level. Note that while there is a bullish risk regarding weather, investments in the crystallization process could induce higher sugar mix.
Image 6: Total Exports - Brazil CS ('000t)

Image 7: Total Stocks - Brazil CS ('000t)
Source: SECEX, Williams, hEDGEpoint

Source: Unica,MAPA, SECEX, Williams, hEDGEpoint
Brazil CS Ethanol
Image 8: Otto Cycle - Brazil CS (M m³)

Source: ANP, Bloomberg, hEDGEpoint
Otto Cycle's results have been disappointing. Although sales to the domestic market picked up during 2023 last month, it was only respecting usual seasonality having little impact on overall stock expectations.
Image 9: Anhydrous Ending Stocks - Brazil CS ('000 m³)

Image 10: Hydrous Ending Stocks - Brazil CS ('000 m³)
Source: Unica, MAPA, ANP, SECEX, hEDGEpoint

Source: Unica, MAPA, ANP, SECEX, hEDGEpoint
Brazil NNE
Image 11: Sugar Balance - Brazil NNE (Apr-Mar Mt)

Source: MAPA, SECEX, hEDGEpoint
Until the end of December, NNE already produced 13% more sugar Y/Y, reaching 2.3Mt. Figures suggest that the region should end the season crushing nearly 63Mt of cane. Coupled with a 47% sugar mix, total sugar production can reach 3.6Mt.
The region continues to receive above-normal rainfall, especially in Eastern Alagoas, which could hamper some mills operations. However, rains are welcome, as they can be beneficial for next year's sugarcane - if extended until its key development period.
Image 12: Total Exports - Brazil NNE ('000t)

Source: SECEX, hEDGEpoint
India
Image 13: Sugar Balance - India (Oct-Sep Mt)

Source: ISMA,AISTA, hEDGEpoint
India's latest sugar production figures, reported by ISMA, met expectations and closed the gap compared to last season to 5.3% including January's first fortnight. Favorable weather conditions have contributed to leading cane commissioners in key states like Uttar Pradesh, Maharashtra, and Karnataka to raise their sugar production estimates for the season by 5% to 10% each.
This movement made us comfortable in keeping our nearly 32Mt sugar production estimates and no exports, especially given that the newly found availability drove ISMA to request another 1-1.2Mt sugar diversion permission.
Image 14: Total Domestic Exports - India ('000t w/o tolling)

Source: ISMA,AISTA, hEDGEpoint
Thailand
Image 15: Sugar Balance - Thailand (Dec-Nov Mt)

Source: Thai Sgar Millers, Sugarzone, hEDGEpoint
As the 23/24 season advances, the yearly drop reduces but remains wide. By the end of January's first fortnight, Thailand had produced 2.3Mt of sugar, an 18% drop compared to 22/23.
We should keep in mind that mills started 10 days later than usual, however, the drought effects are more than confirmed. Our estimates remain unchanged from last report, with 8.2Mt of the sweetener being produced and only 5.3Mt exported.
Image 16: Total Exports - Thailand ('000t)

Source: Thai Sgar Millers, hEDGEpoint
EU 27+UK
Image 17: Sugar Balance - EU 27+UK (Oct-Sep Mt)

Source: EC, Greenpool, hEDGEpoint
While our projections remain unchanged, it's worth mentioning some developments concerning Europe. In January, the UK government announced the conditional approval of a neonicotinoid pesticide for use during the 2024 sugar beet crop in England, contingent upon a risk of over 65% virus incidence.
Mexico
Image 18: Sugar Balance - Mexico (Oct-Sep Mt)

Source: Conadesuca, Greenpool, hEDGEpoint
We remain firm in our position that Mexico will not reach 5Mt of sugar production in 23/24. Conadesuca's crop advance summary shed light on the matter with a drop to the area (-1%), yield (-1%), sugar yield (-9.2%), and sugar (-9.2%).
Compared to their first estimates (nearly 6Mt for 23/24 and about 1.7Mt until January 20), sugar production already lags 500kt. The country has produced 1.2Mt of the sweetener to date. Compared to last season, the gap is lower by 120kt. So far, realized figures have met our expectations.
Image 19: Total Exports - Mexico ('000t)

Source: Conadesuca, Greenpool, hEDGEpoint
USA
Image 20: Sugar Balance - US (Oct-Sep Mt)

Source: USDA, hEDGEpoint
We revised our US's expectations up after the second month in a row that USDA pointed out better than anticipated results, especially regarding beet.
While cane areas were penalized by adverse weather, the agency predicts a record beet production during 23/24. This adds to the total sweetener availability guaranteeing lower than previously estimated imports.
Beet results couldn't come at a better time. Although the country will still need to diversify its import origins, because of Mexico's crop failure, stocks are not at a major risk.
Guatemala
Image 21: Sugar Balance - Guatemala (Oct-Sep Mt)

Source: Cengicaña, Sieca, Azucar.gt,Greenpool, hEDGEpoint
Image 22: Total Exports - Guatemala ('000t)

Source: Sieca
El Salvador
Image 23: Sugar Balance - El Salvador (Oct-Sep Mt)

Source: Cengicaña, Sieca, Azucar.gt,Greenpool, hEDGEpoint
El Salvador started the crop a little later than usual and has, by the end of January, produced only 288kt of sugar. This represents a yearly drop of 16%, as by the same time last year, the country's production was nearly 350kt.
Source: Sieca
Russia
Image 24: Sugar Balance - Russia (Mt Sep-Aug)

Source: Ikar, Sugar.ru, Greenpool, hEDGEpoint
According to R.V. Nekrasov, director of the Department of the Russian Ministry of Agriculture, the area designated for sugar beet cultivation is expected to marginally expand to 1,068.5 thousand hectares by 2024.
China
Image 25: Sugar Balance - China (Oct-Sep Mt)

Source: GSMN, CSA, Refinitiv, Greenpool, hEDGEpoint
Obs: stocks also account for bonded warehouses volume and imports include syrup and smuggling estimates
Image 26: Total Imports - China ('000t - exc. syrup and smuggling)

Image 27: Total Production - China ('000t)
Source: GSMM, hEDGEpoint

Source: CSA, Refinitiv, Greenpool, hEDGEpoint
Weekly Report — Sugar and Ethanol
livea.coda@hedgepointglobal.com
natalia.gandolphi@hedgepointglobal.com
Sugar and Ethanol Desk
murilo.mello@hedgepointglobal.com
vipul.bhandari@hedgepointglobal.com
gabriel.oliveira@hedgepointglobal.com
etori.veronezi@hedgepointglobal.com
Disclaimer
Contact us
Check our general terms and important notices.
We have updated our Terms & Conditions to reflect improvements to our platform, data handling practices, and the overall experience we provide to our clients.

