
Sugar and Ethanol Monthly Report - 2024 03 28
"Bulls have been battling bears daily, with prices remaining in a tight range and failing to move back above 23c/lb. However, despite this bearish pressure, the market remains on the verge of another deficit year. Demand is expected to remain resilient, especially given the recent price correction. An example of this is China's eagerness to buy sugar every time its prices fall back to the 20.5c/lb level - opening the non-producer region's arbitrage. In addition, lower availability from Brazil is already given, despite its well-known efforts to maximize sugar, while the 24/25 Northern Hemisphere's crop recovery is still highly dependent on weather."
S&D and Trade Flow
At the same time that the market has become more pessimistic regarding the Brazilian CS 24/25 crop season, the Northern Hemisphere's 23/24 prospects have improved, making it easier to remain on the optimistic side for 24/25 in terms of the region's availability. Europe is one of the key regions acting on the bearish side, with higher imports from Ukraine being allowed. The latter is expected to have higher sugar availability given the price advantage of beet over grain, allowing exports of 800 kt to 1 mt in 24/25.
The EU approval of no tariffs on Ukrainian sugar could allow up to 650kt to be imported to the region, pressuring domestic prices and the white contract. As a result, one could expect the EU to be participating more eagerly in the international market. This trend could be seen throughout the rest of 23/24 and into 24/25 (Oct-Sep), as beet area is also expected to increase during the region's new crop.
Therefore, bulls have been battling bears daily, with prices remaining in a tight range and failing to move back above 23c/lb.However, despite this bearish pressure, the market remains on the verge of another deficit year. Demand is expected to remain resilient, especially given the recent price correction. An example of this is China's eagerness to buy sugar every time its prices fall back to the 20.5c/lb level - opening the non-producer region's arbitrage. In addition, lower availability from Brazil is already given, despite its well-known efforts to maximize sugar, while the 24/25 Northern Hemisphere's crop recovery is still highly dependent on weather.
Image 1: Total Trade Flow ('000t)
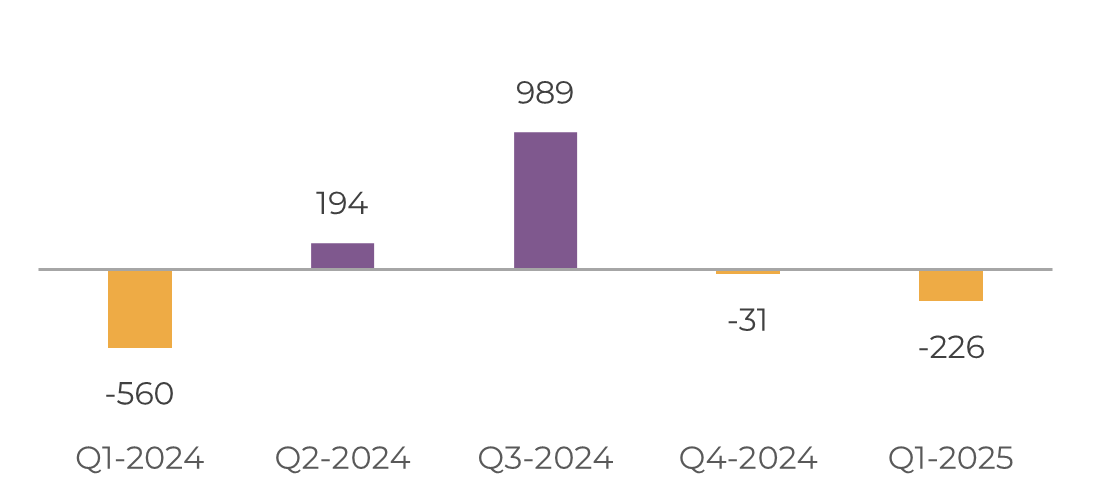
Source: hEDGEpoint
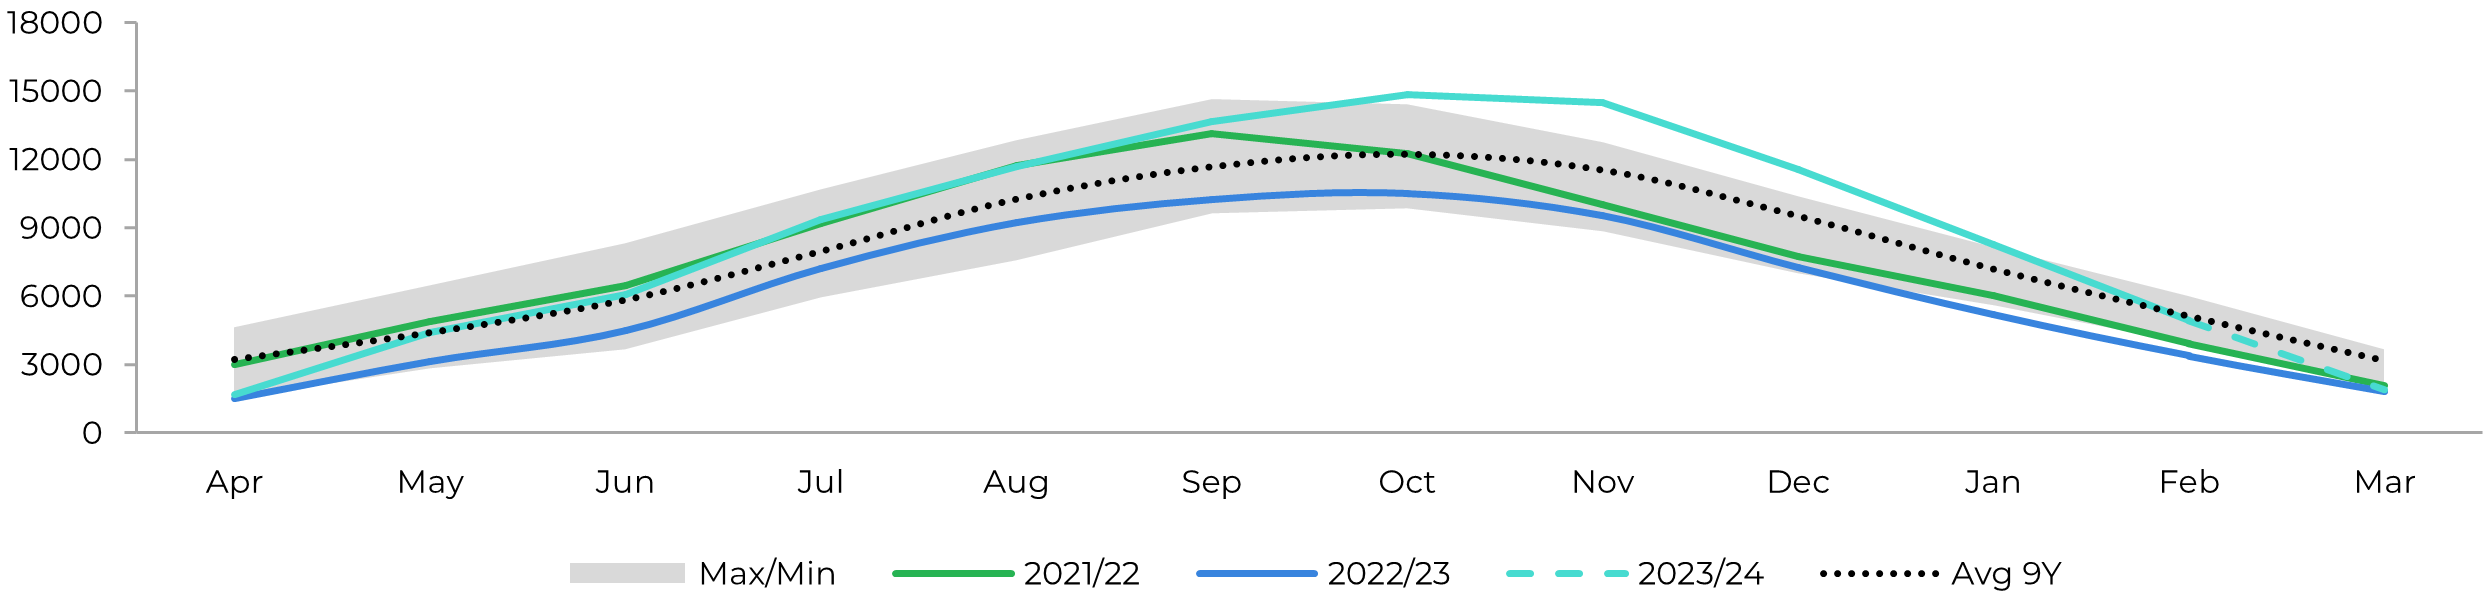
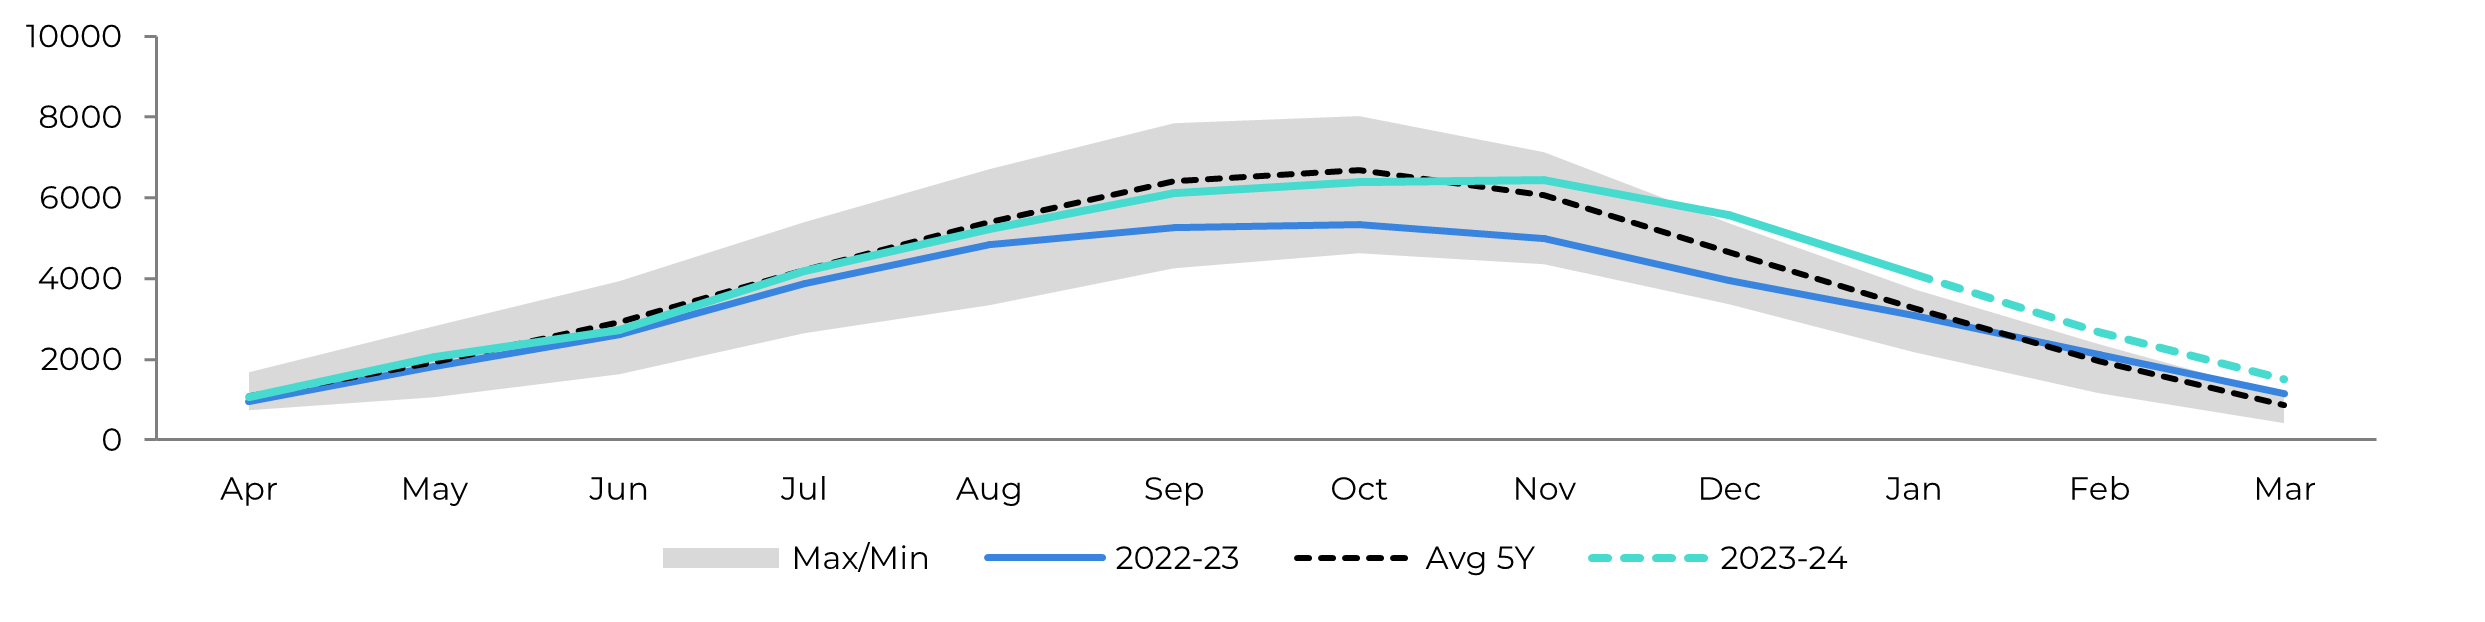
Image 2: Raw's Trade Flow ('000t)
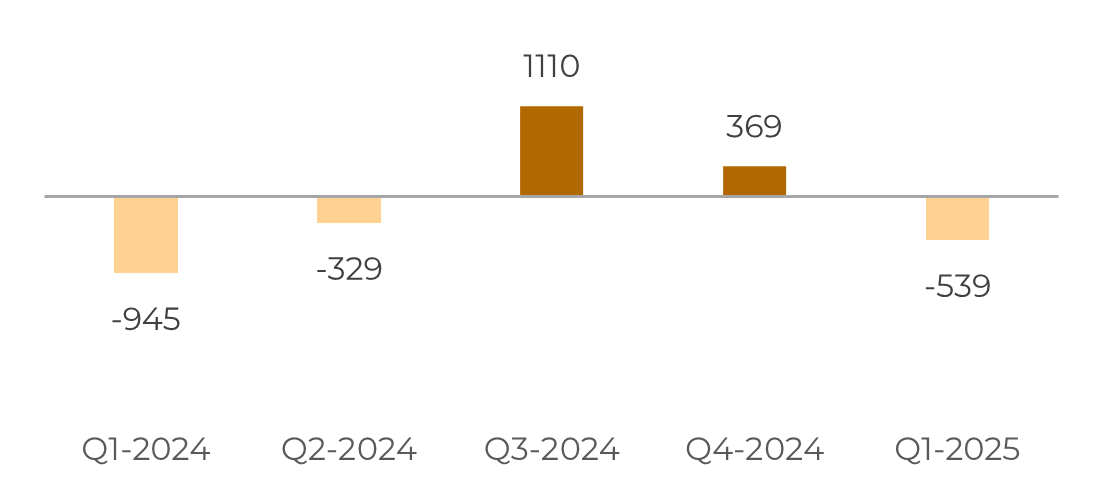
Source: hEDGEpoint
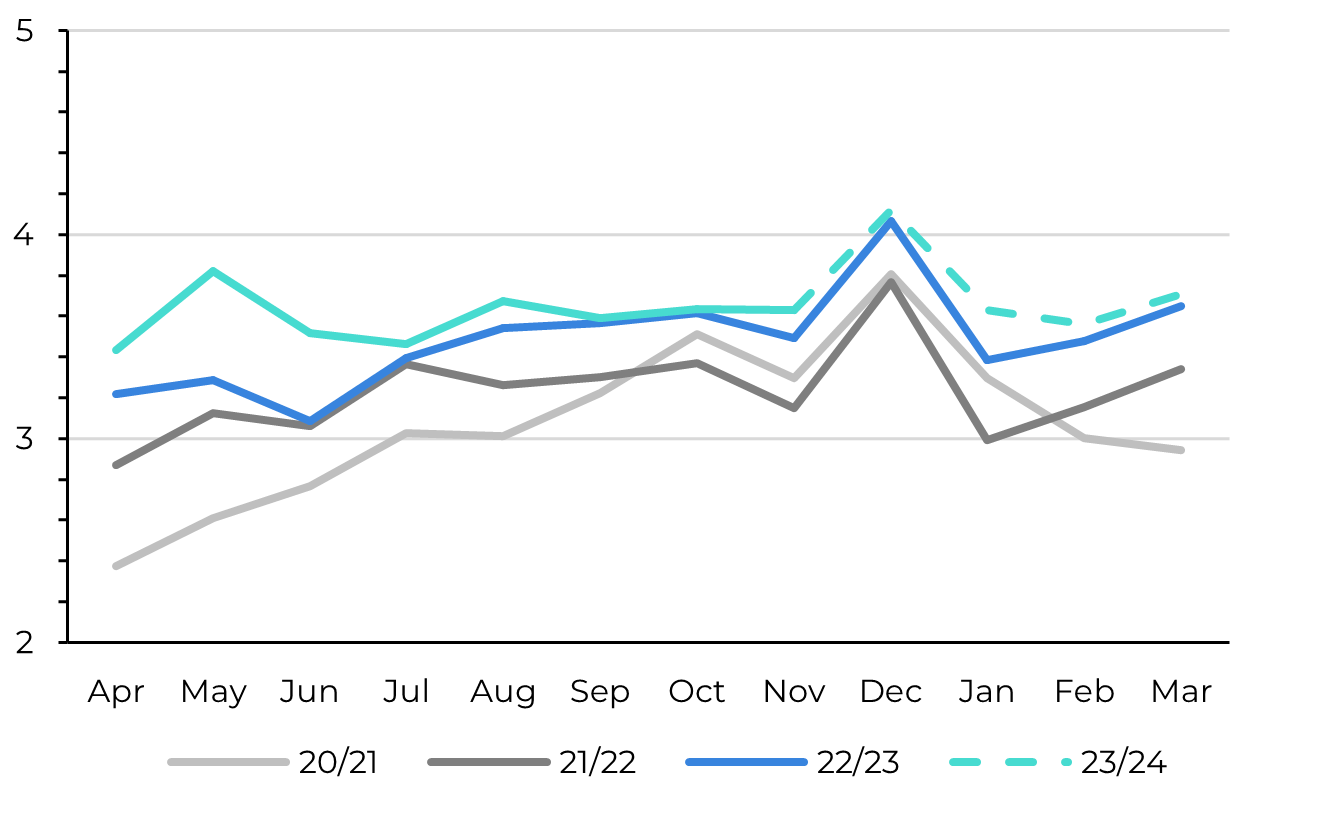
Image 3: White's Trade Flow ('000t)
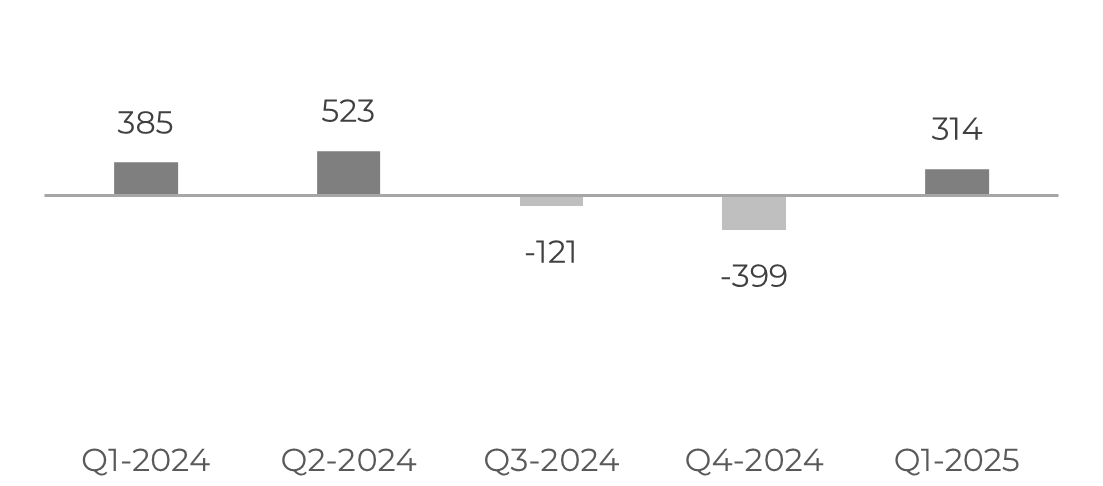
Source: hEDGEpoint
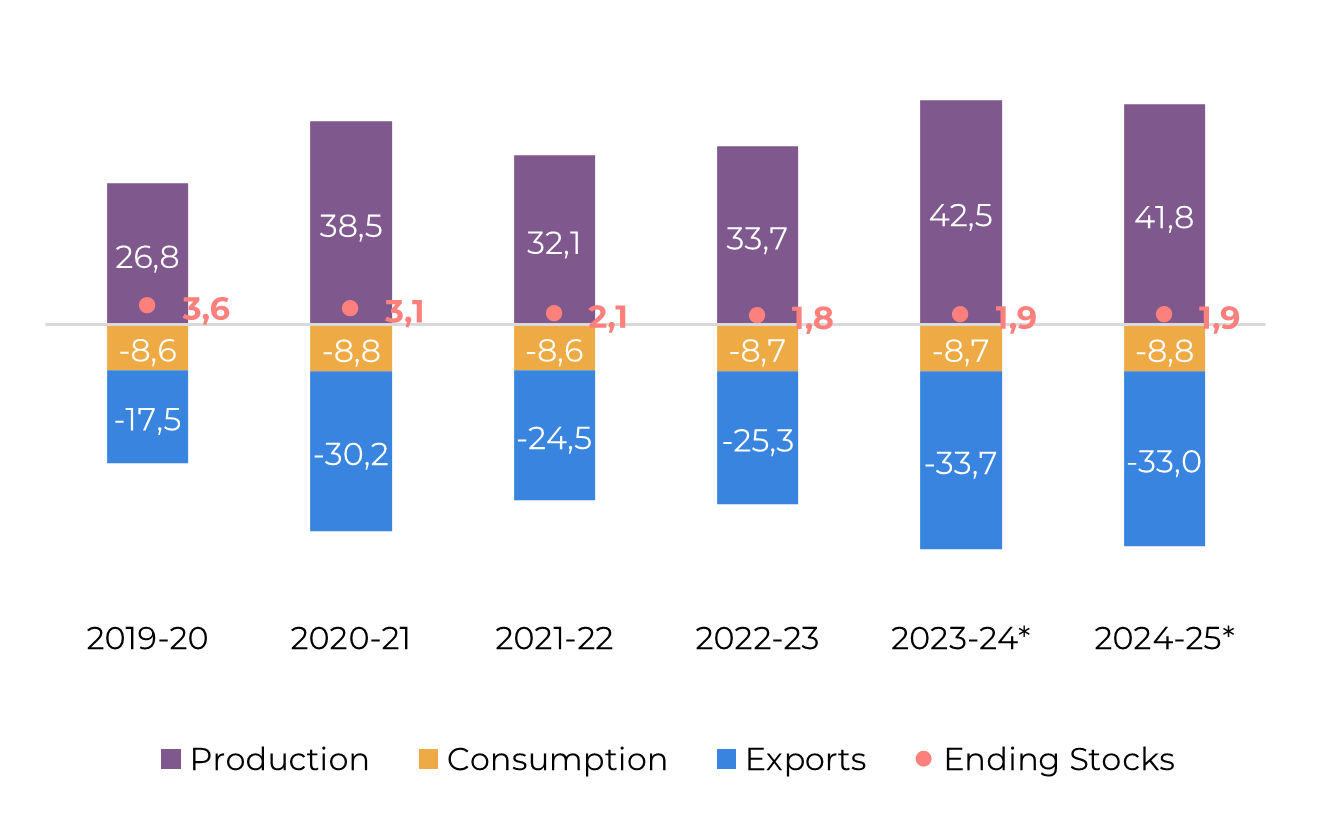
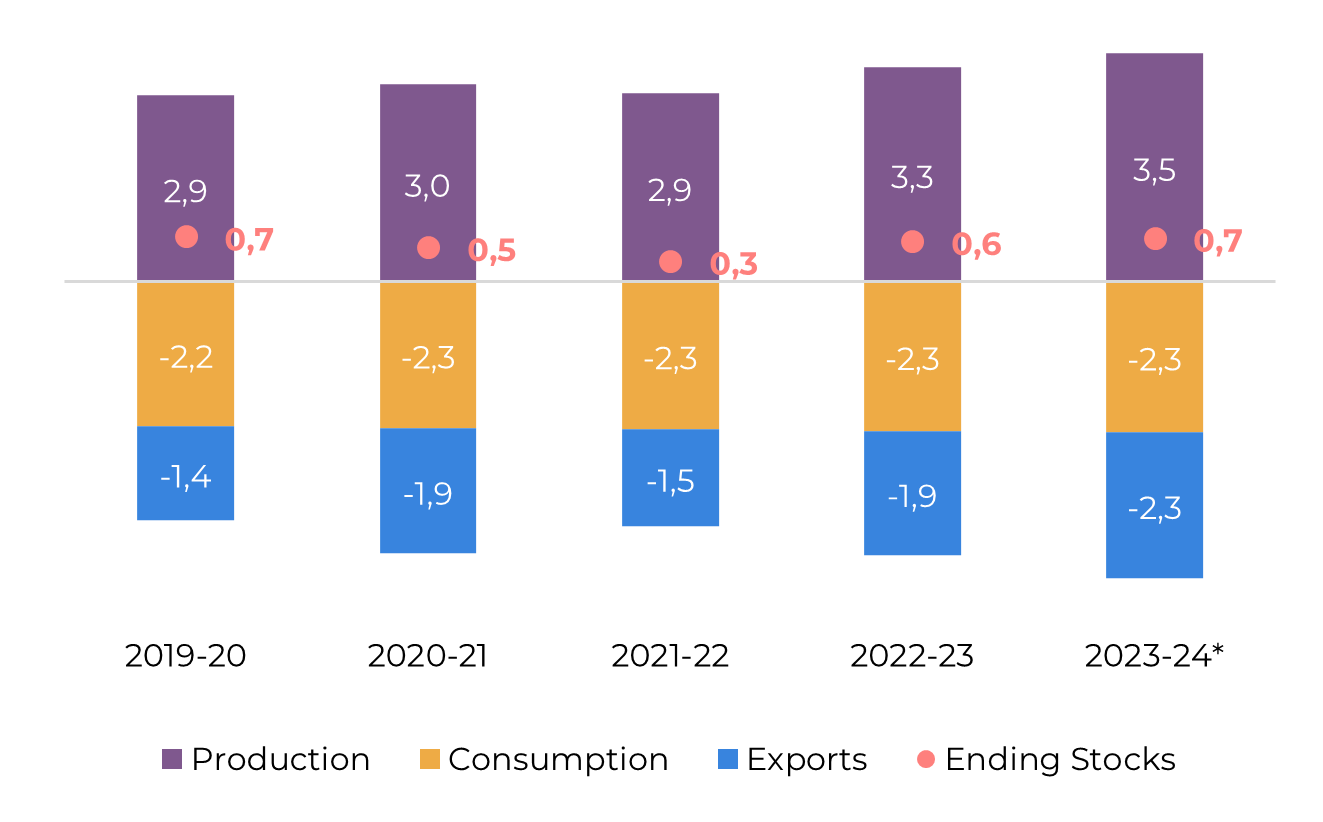
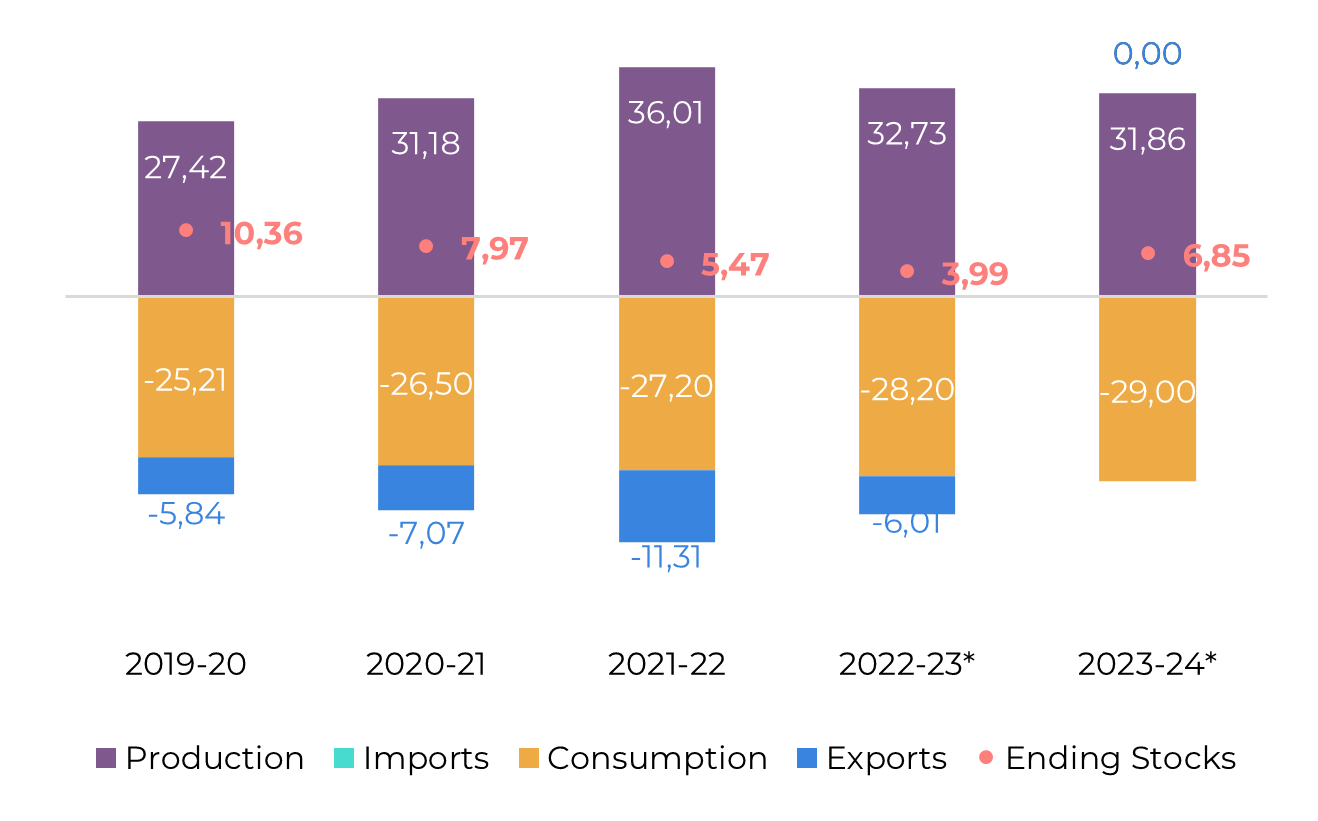
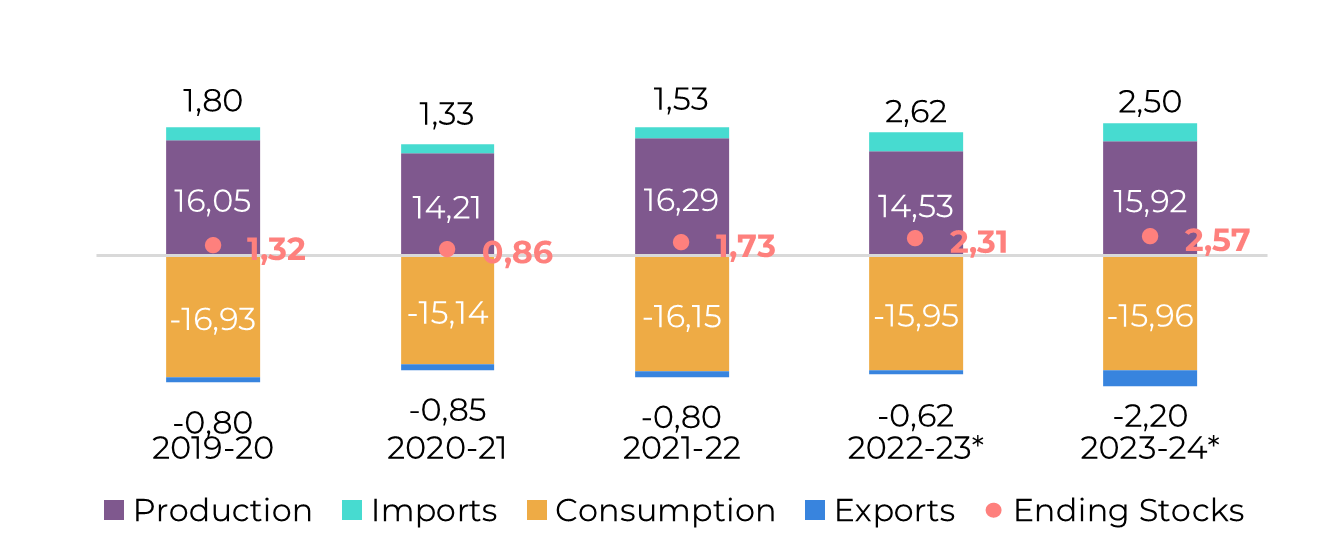
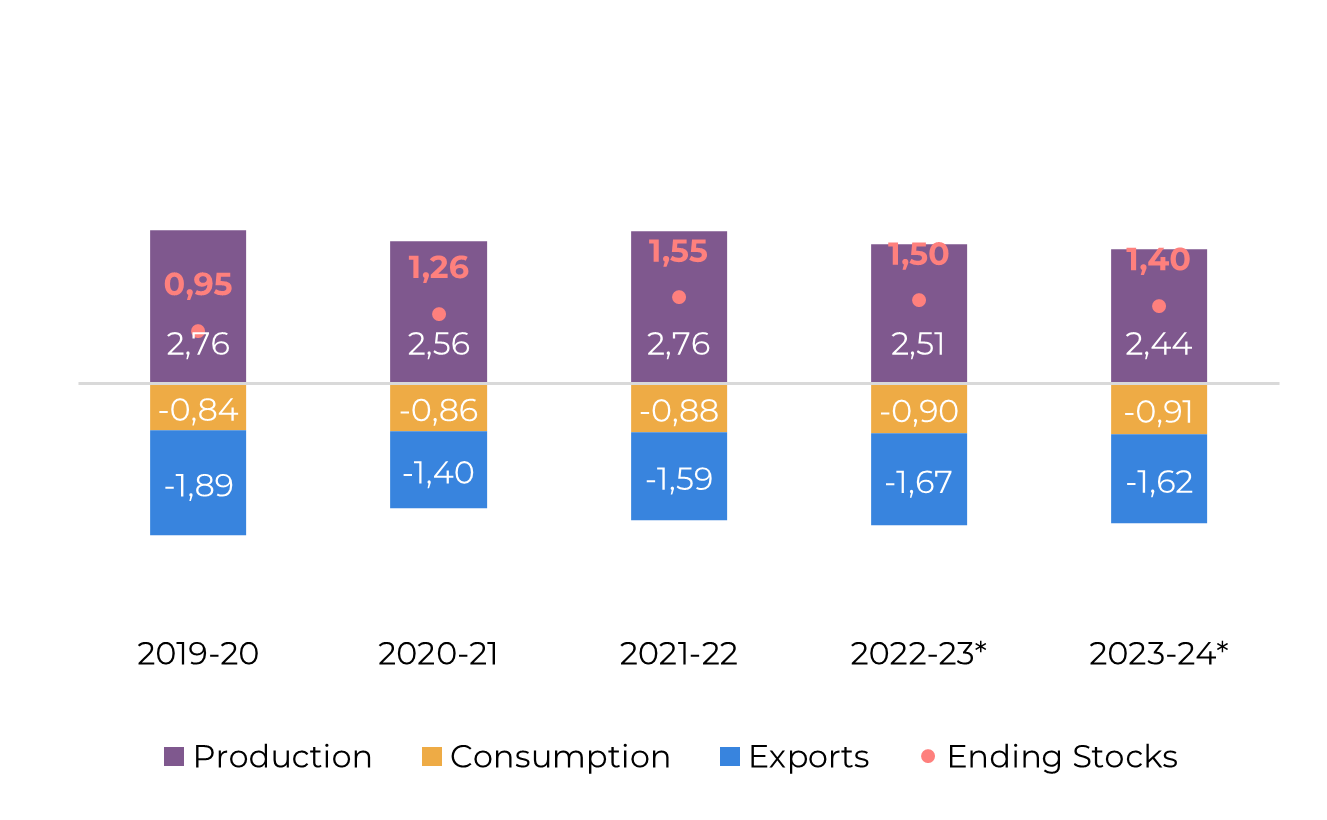
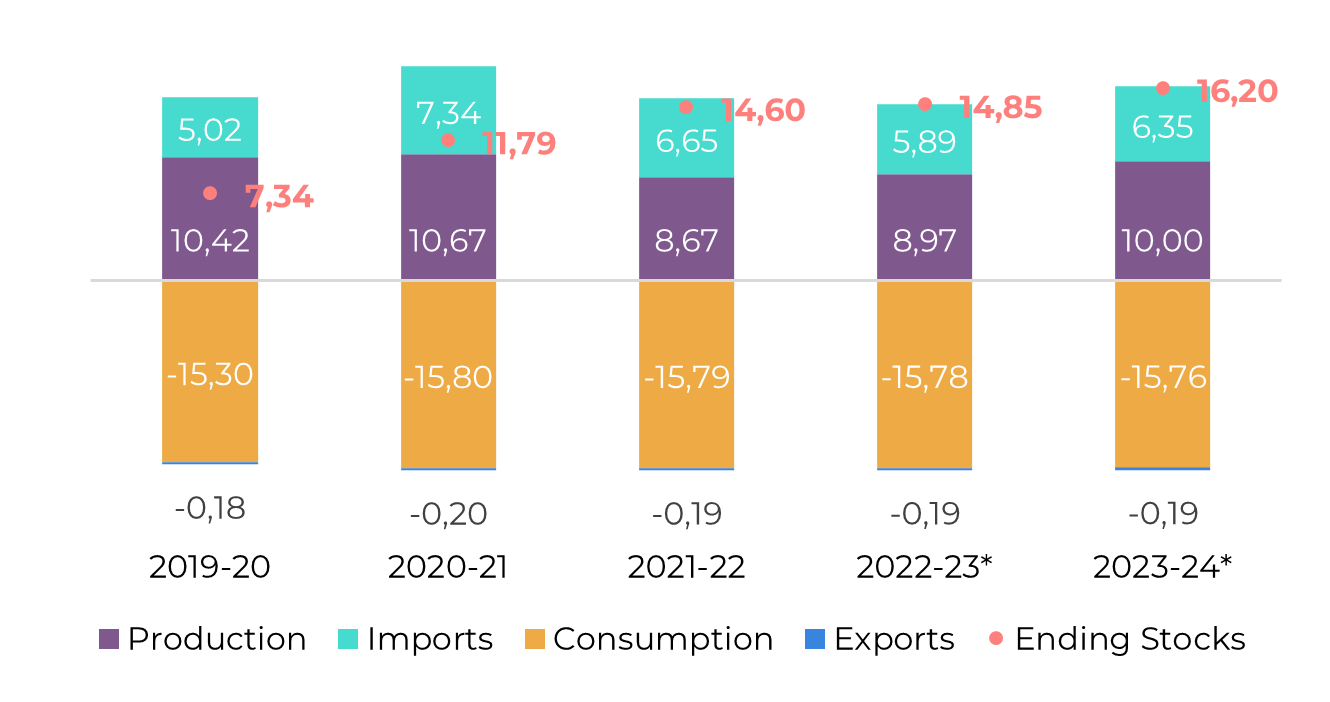
Image 4: Global Supply and Demand Balance (MT RV oct-sep)
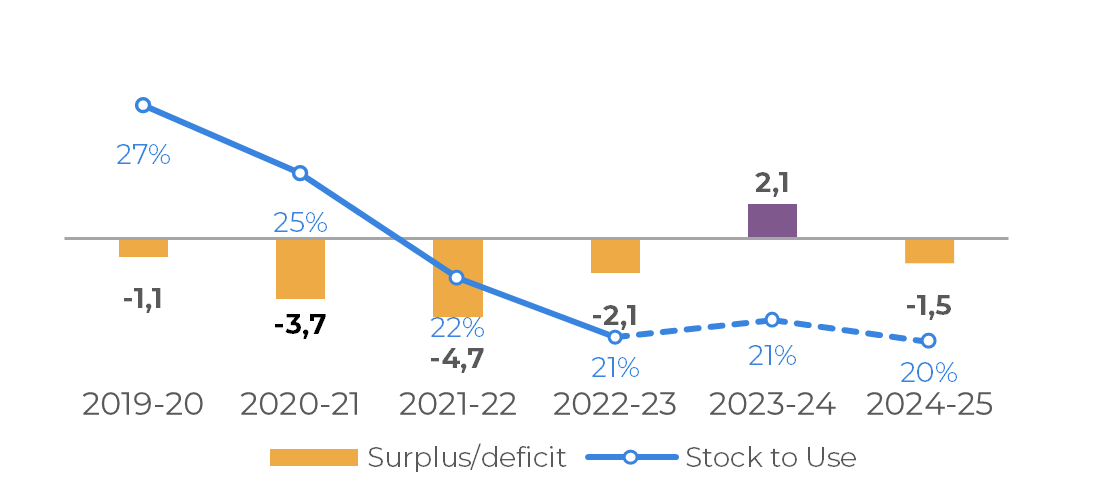
Source: hEDGEpoint
Brazil CS
Image 5: Sugar Balance - Brazil CS (Apr-Mar Mt)
Source: Unica, MAPA, SECEX, hEDGEpoint
Sugar prices are being supported by ongoing production challenges in the Center-South region, exacerbated by the adverse weather conditions in February, prompting a reevaluation of cane's projections. It's important to note that while soil moisture and cumulative rainfall indicate a potentially sharper decline in yields compared to our current estimates, the impact of the drought was not uniform across the Center-South region.
Therefore, we believe it is too early to forecast cane volumes below 600 Mt. Despite the return to more typical yields, the 24/25 season is unlikely to be a major failure, remaining within the higher range of cane and sugar production observed in previous years. By analyzing proxy regions, taking into account rainfall patterns, we estimate that approximately 30% of the Center-South's cane production received average rainfall, while 23% experienced below-average levels and roughly 47% recorded minimal levels. Taking all factors into consideration, including historical trends and market forecasts, the Center-South region could see an 8.4% decrease in yield, reverting to a more typical TCH of nearly 79 t/ha and around 605.8Mt of cane.
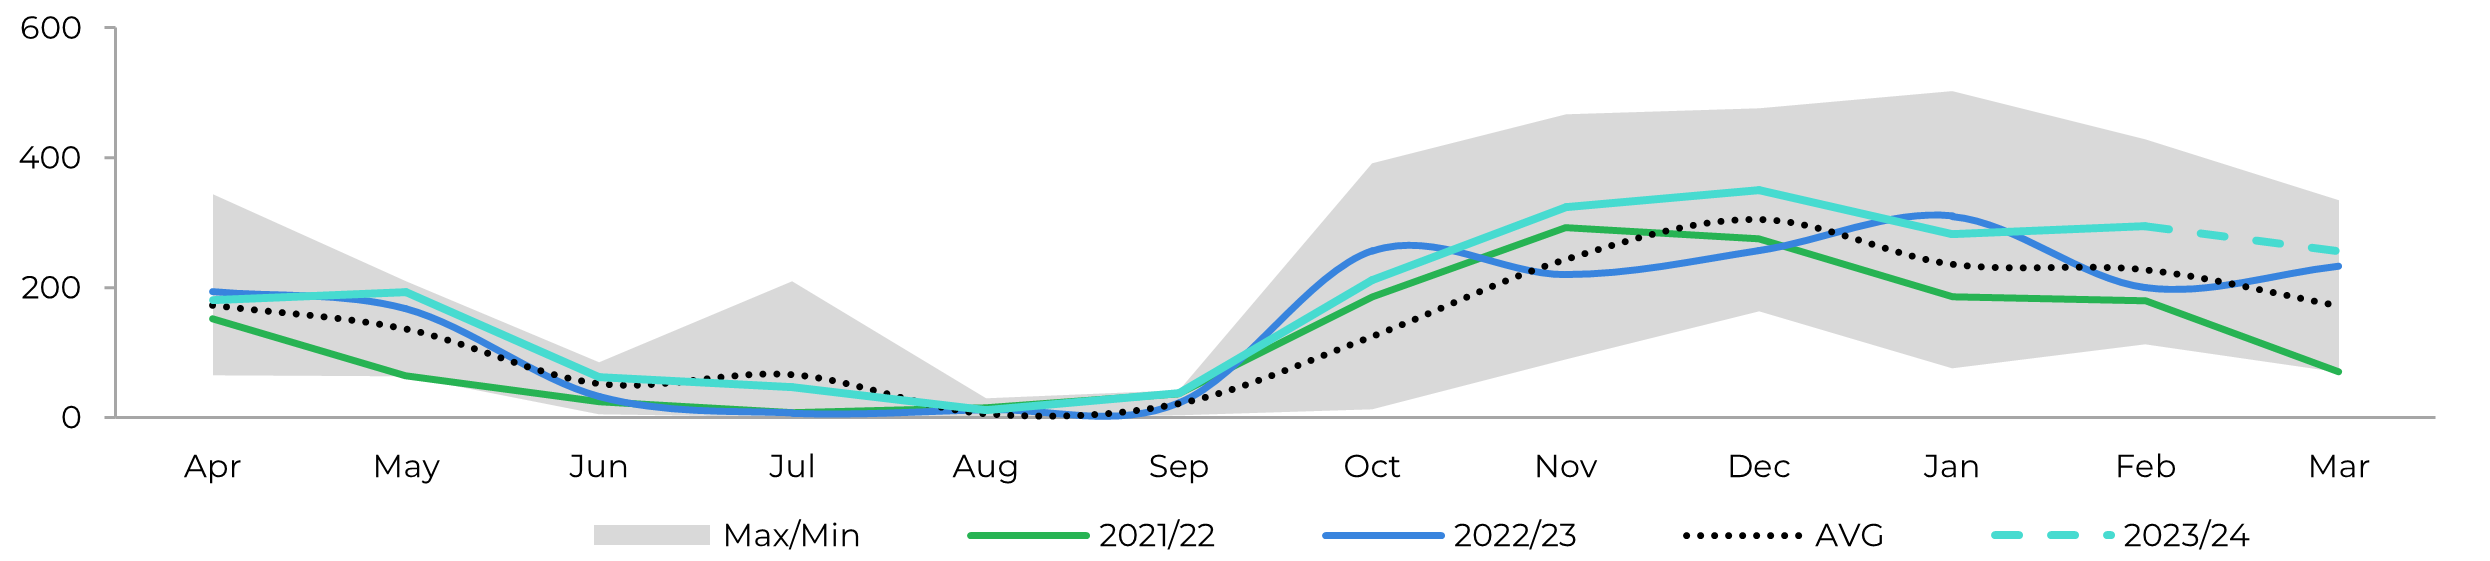
Image 6: Total Exports - Brazil CS ('000t)
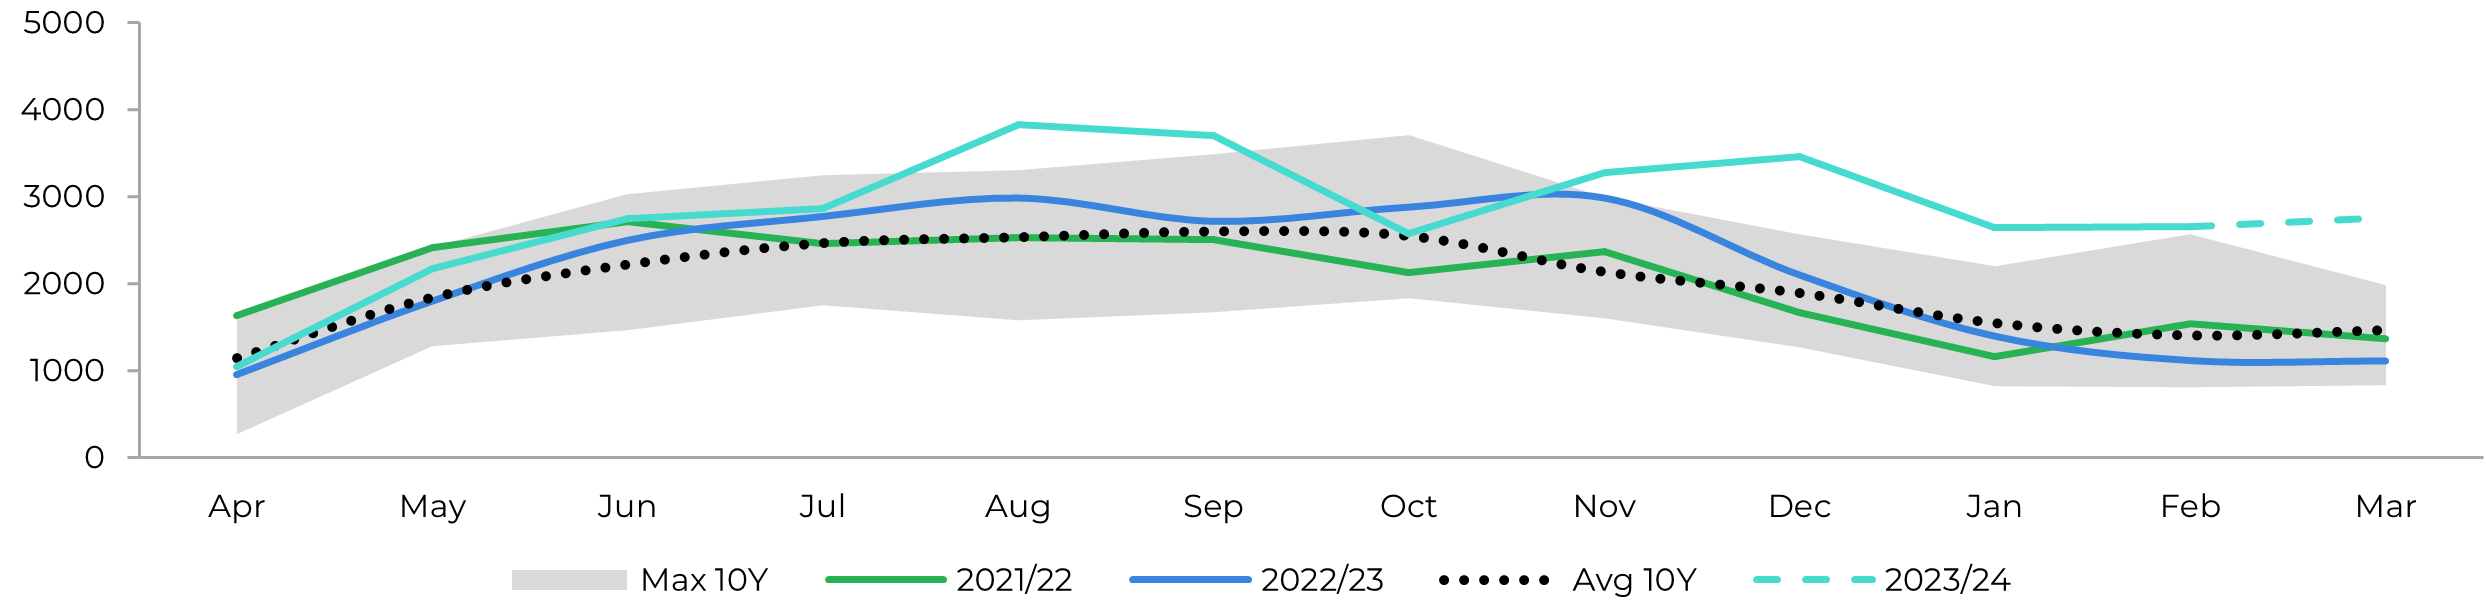
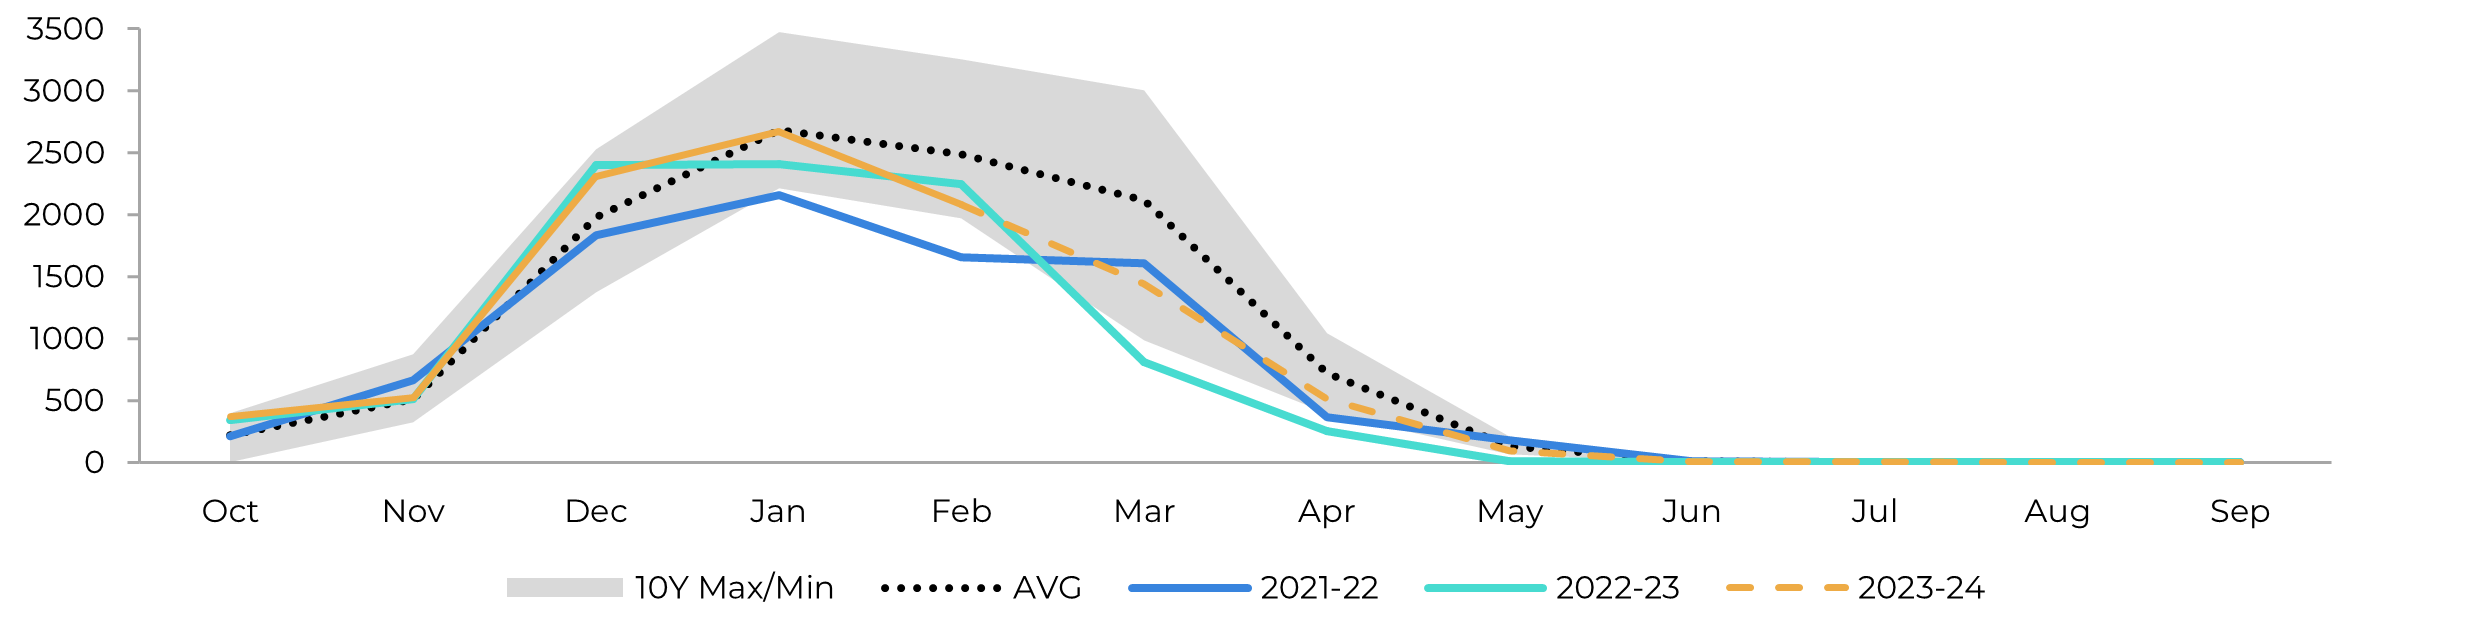
Image 7: Total Stocks - Brazil CS ('000t)
Source: SECEX, Williams, hEDGEpoint
Source: Unica,MAPA, SECEX, Williams, hEDGEpoint
Brazil CS Ethanol
Image 8: Otto Cycle - Brazil CS (M m³)
Source: ANP, Bloomberg, hEDGEpoint
From the beginning of 2024, the Otto Cycle shows usual seasonality. Anhydrous sales, as reported by Unica, have shown an increase during this period. Additionally, sales of hydrous have also picked up since August, surpassing historical averages and maintaining a heightened level. However, despite this positive trend, the increased availability of raw materials has led to a rise in ethanol stocks, contributing to a disappointing price performance.
This estimation is contingent upon current cane estimates, which stand at 605 million metric tons. Any deterioration in these estimates could exert pressure on prices. As demand has only recently recovered, it remains the most vulnerable aspect of the market. Consequently, if prices increase, ethanol demand would be the first to suffer, particularly considering the artificially low prices of gasoline at the pump.
Image 9: Anhydrous Ending Stocks - Brazil CS ('000 m³)
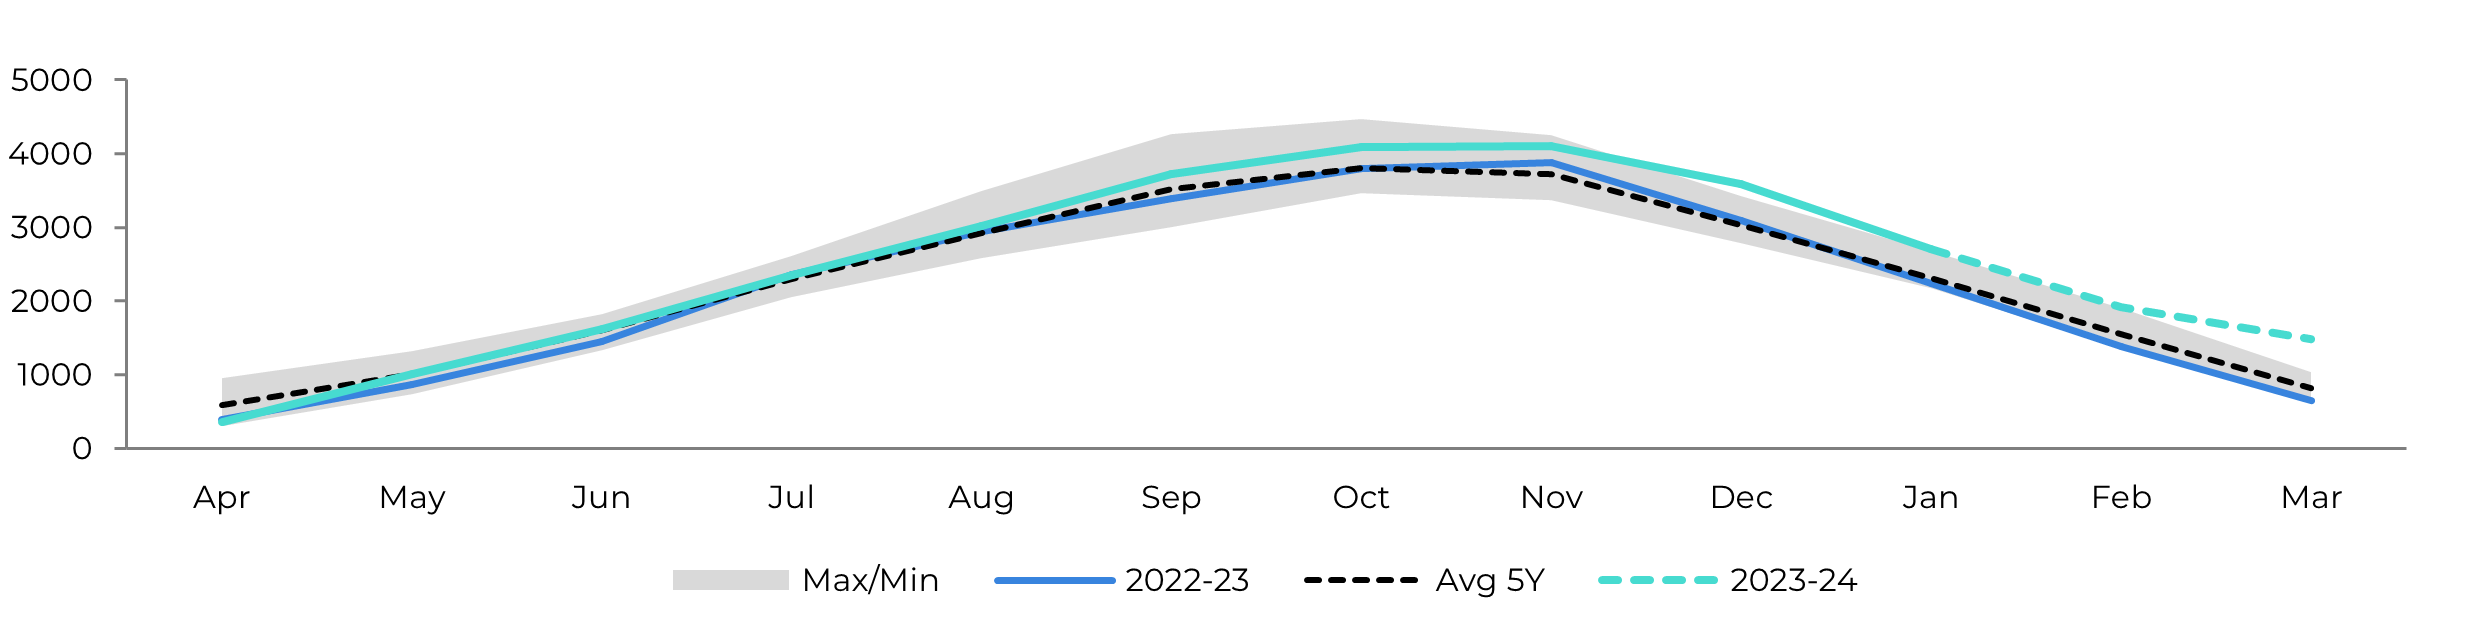
Image 10: Hydrous Ending Stocks - Brazil CS ('000 m³)
Source: Unica, MAPA, ANP, SECEX, hEDGEpoint
Source: Unica, MAPA, ANP, SECEX, hEDGEpoint
Brazil NNE
Image 11: Sugar Balance - Brazil NNE (Apr-Mar Mt)
Source: MAPA, SECEX, hEDGEpoint
During the summer season, the North and Northeast regions, particularly the latter, have experienced above-average rainfall. This weather pattern has disrupted crushing operations and led to lower sucrose content, resulting in a downgrade of our estimated TRS to 127 kg/t, though still above last season's levels. Despite these challenges, mills have managed to maintain a sugary mix.
In the April-March period, the region has produced 3.2 Mt of sugar, suggesting a potential to nearly reach 3.5 Mt. However, it's worth noting that we have revised our cane availability down to 61 Mt due to the various issues faced by the region between December and the end of February.
Image 12: Total Exports - Brazil NNE ('000t)
Source: SECEX, hEDGEpoint
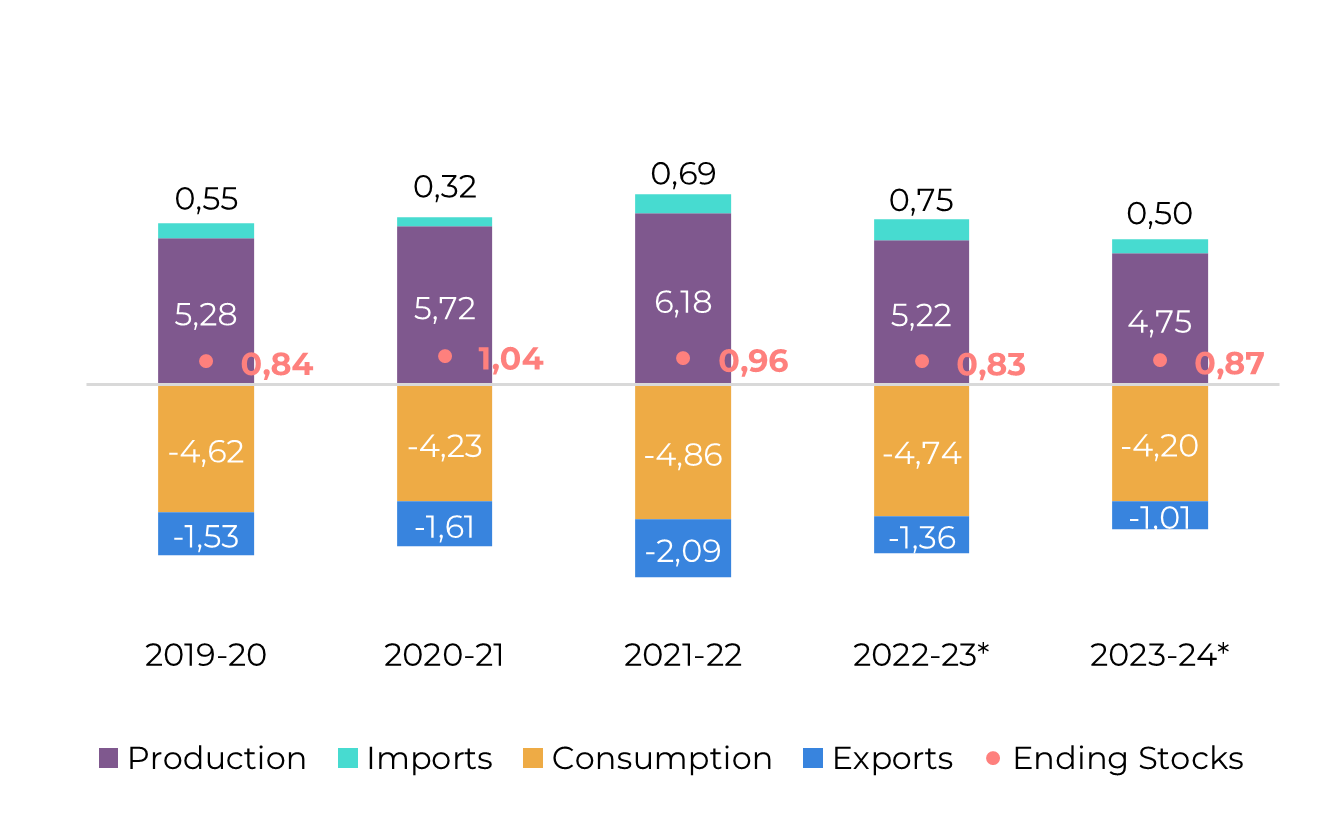
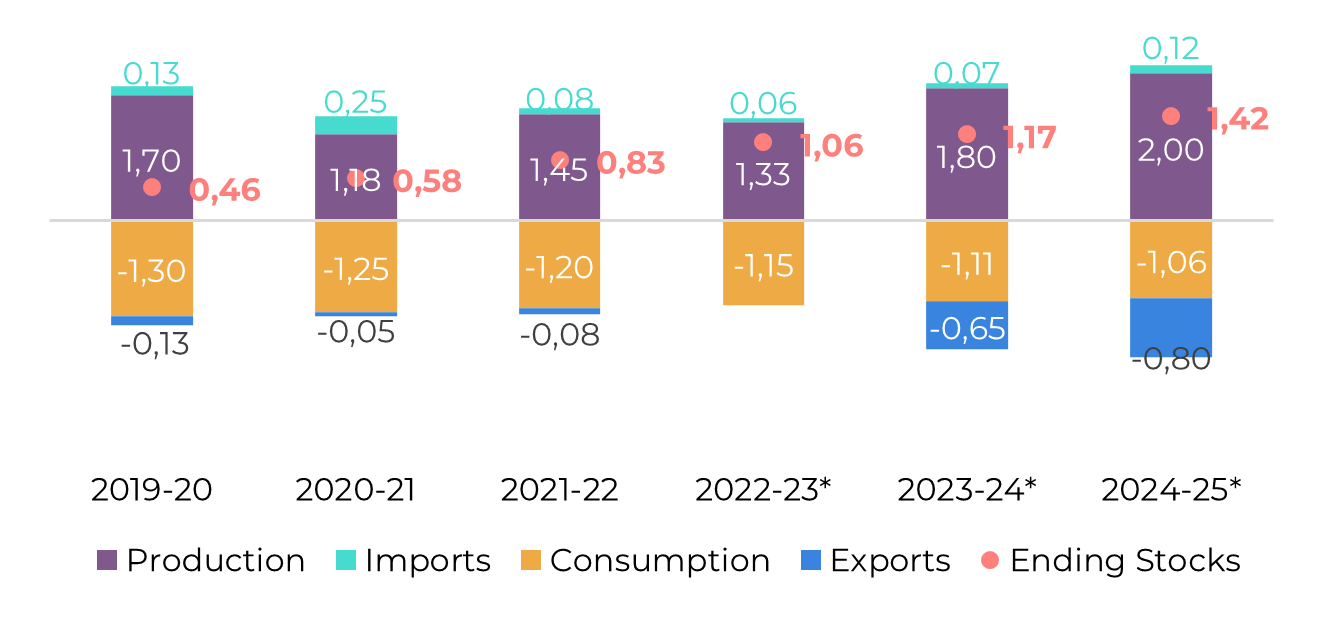
India
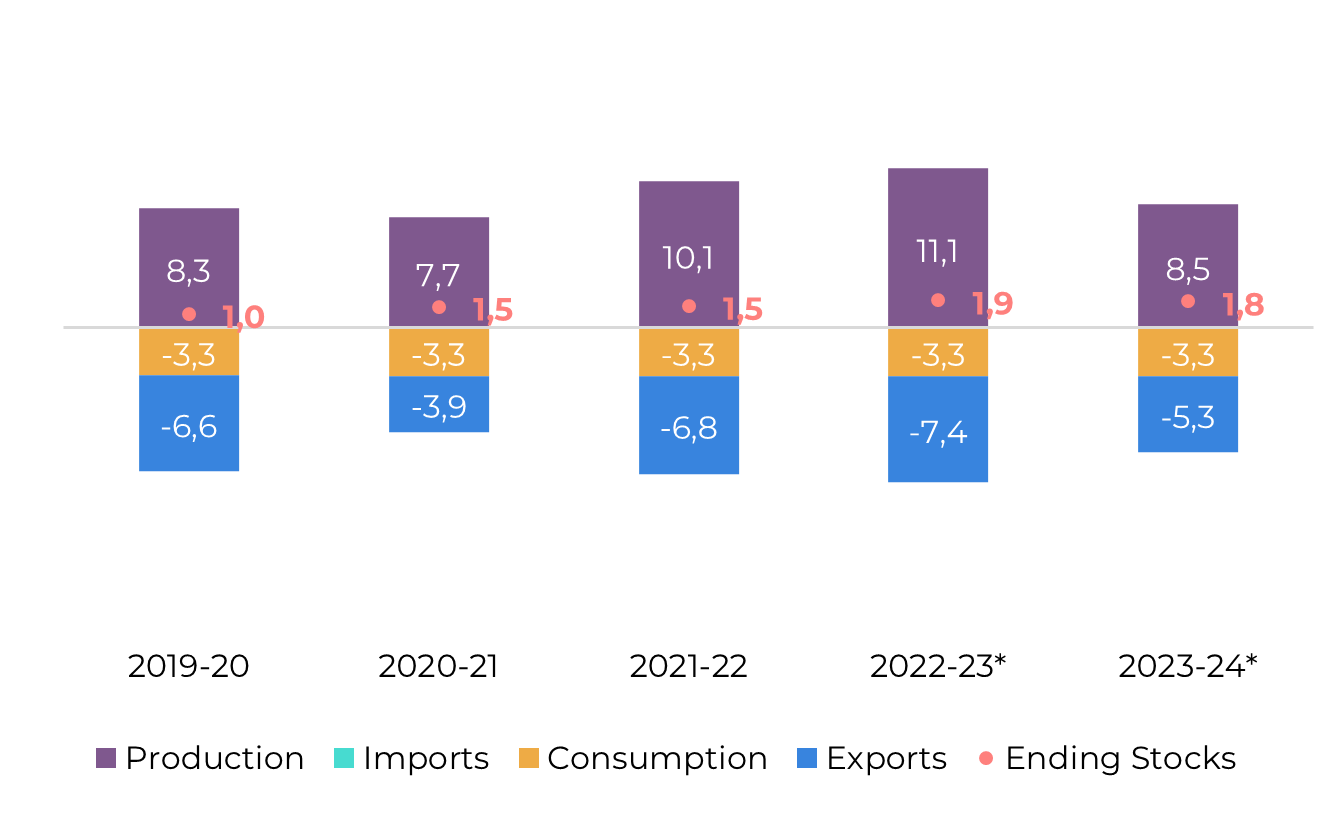
Image 13: Sugar Balance - India (Oct-Sep Mt)
Source: ISMA,AISTA, hEDGEpoint
Recent reassessments by Indian officials have painted a more optimistic picture for the upcoming season. According to AISTA, India is projected to produce approximately 32 Mt of sugar in the 23/24 season, closely aligning with our previous estimates of 31.9 Mt. Not only AISTA, but ISMA has also revisited their figures suggesting total sugar production close to 32.3Mt.
This upward revision suggests that the country could replenish its sugar stocks by around 3.5Mt and contrasts with the initial market expectations, which estimated production to be under 30 Mt at the season's outset. Despite reports of reduced planting in the southern Indian states for the 24/25 season due to drought conditions, AISTA highlights that sugarcane remains the most profitable crop for the average Indian farmer. Therefore, we remain optimistic.
A modest 2% reduction could be offset by higher yields if weather conditions cooperate, particularly if La Niña's impact proves to be less severe. In such a scenario, India could potentially redirect 5.5Mt of sugar towards its ethanol program without depleting its stock reserves. Subsequently, the decision to export approximately 1Mt or to allocate it to domestic stocks would hinge on prevailing domestic and international price dynamics and government policies.
Image 14: Total Domestic Exports - India ('000t w/o tolling)
Source: ISMA,AISTA, hEDGEpoint
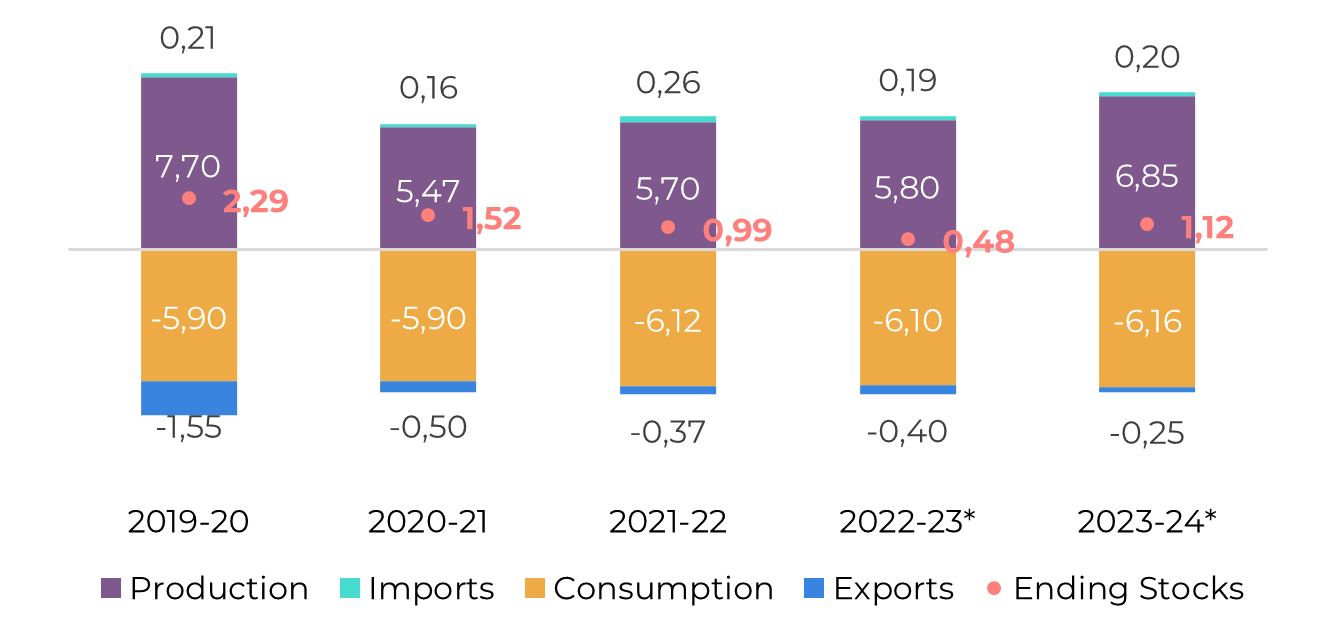
Thailand
Image 15: Sugar Balance - Thailand (Dec-Nov Mt)
Source: Thai Sgar Millers, Sugarzone, hEDGEpoint
By the end of February, Thailand had already surpassed expectations by achieving a sugar production of 8 Mt. This figure not only exceeds our initial forecast but also surpasses the market's average expectations. As a result, we are revising our projections upwards. At the current pace of crushing, Thailand could potentially reach a sugar production of 8.5 Mt in the 2023/2024 season.
However, despite the impressive production figures, exports are still lagging. Data up to the end of January indicate a decline of 37% in exports compared to the previous season, totaling only 696 kt. A significant portion of this volume, approximately 350 kt, consisted of refined sugar exports.
Image 16: Total Exports - Thailand ('000t)
Source: Thai Sgar Millers, hEDGEpoint
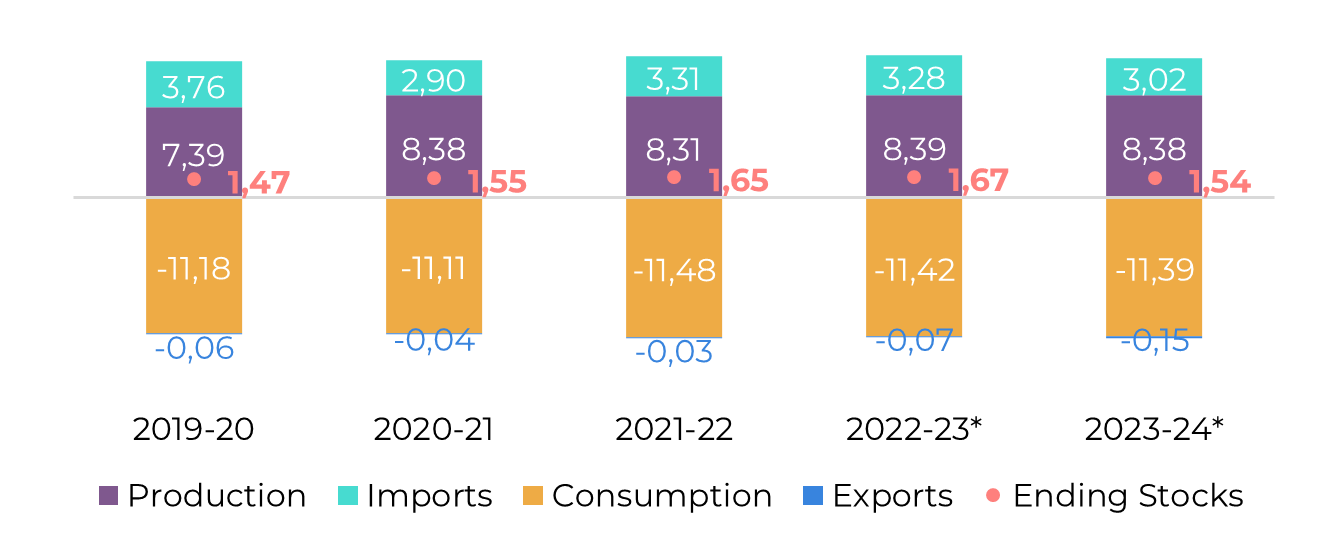
EU 27+UK
Image 17: Sugar Balance - EU 27+UK (Oct-Sep Mt)
Source: EC, Greenpool, hEDGEpoint
Regarding EU and UK markets, we forecast a recovery in white sugar production, with volumes potentially reaching 15.92 Mt in 23/24, an increase of 9.5% over 22/23. This figure is the result of an increase in beet area, stimulated by higher prices in 2022, and higher yields.
Mexico
Image 18: Sugar Balance - Mexico (Oct-Sep Mt)
Source: Conadesuca, Greenpool, hEDGEpoint
Conadesuca released its 3rd crop estimate downgrading Mexico’s total sugar production from 4.9Mt to 4.7Mt. This reduction not only affects the country's export capacity, but also its need to import.
Currently, we estimate that Mexico will need to import at least 500kt to keep stocks stable and participate in the global trade flows offering little over 600kt as exports. This is especially worrying for its main trading partner, the US, which has already started re-directing its TRQ.
However, as many other Northern Hemisphere countries, there is a silver lightning. Weather is the key to a recovery in 24/25.
Image 19: Total Exports - Mexico ('000t)
Source: Conadesuca, Greenpool, hEDGEpoint
USA
Image 20: Sugar Balance - US (Oct-Sep Mt)
Source: USDA, hEDGEpoint
The USDA revised beet production down from their previous report, from 4.8Mt to 4.7Mt (-141kt). This reduction was attributed to warm temperatures between December and January, especially in Michigan and the Red River Valley.
As a result, part of the sugar beet piles had to be discarded and the situation made pile management more challenging in some regions. Also, the sucrose recovery extraction was reportedly lower from last month, impacting total production estimates directly.
Lower expected imports from Mexico also impacted the total sugar supply. The combination of both, lower production, and availability from the US’ key trading partner, offset the higher raw sugar tariff-rate quota (TRQ). During March, the USDA increased raw sugar TRQ by 125kt, however, the USTR has not yet published the country allocation. The TRQ volume remains unchanged and at record-high levels.
Guatemala
Image 21: Sugar Balance - Guatemala (Oct-Sep Mt)
Source: Cengicaña, Sieca, Azucar.gt,Greenpool, hEDGEpoint
Image 22: Total Exports - Guatemala ('000t)
Source: Sieca
Ukraine
Image 23: Sugar Balance - Ukraine (Sep-Aug Mt)
Source: Cengicaña, Sieca, Azucar.gt,Greenpool, hEDGEpoint
The 23/24 crop season registered a significant increase in production, which is expected to reach 1.8 Mt. This increased availability led the market to expect a higher participation of the country in trade flows, at around 650 kt.
Source: Sieca
Russia
Image 24: Sugar Balance - Russia (Mt Sep-Aug)
Source: Ikar, Sugar.ru, Greenpool, hEDGEpoint
China
Image 25: Sugar Balance - China (Oct-Sep Mt)
Source: GSMN, CSA, Refinitiv, Greenpool, hEDGEpoint
Obs: stocks also account for bonded warehouses volume and imports include syrup and smuggling estimates
Image 26: Total Imports - China ('000t - exc. syrup and smuggling)
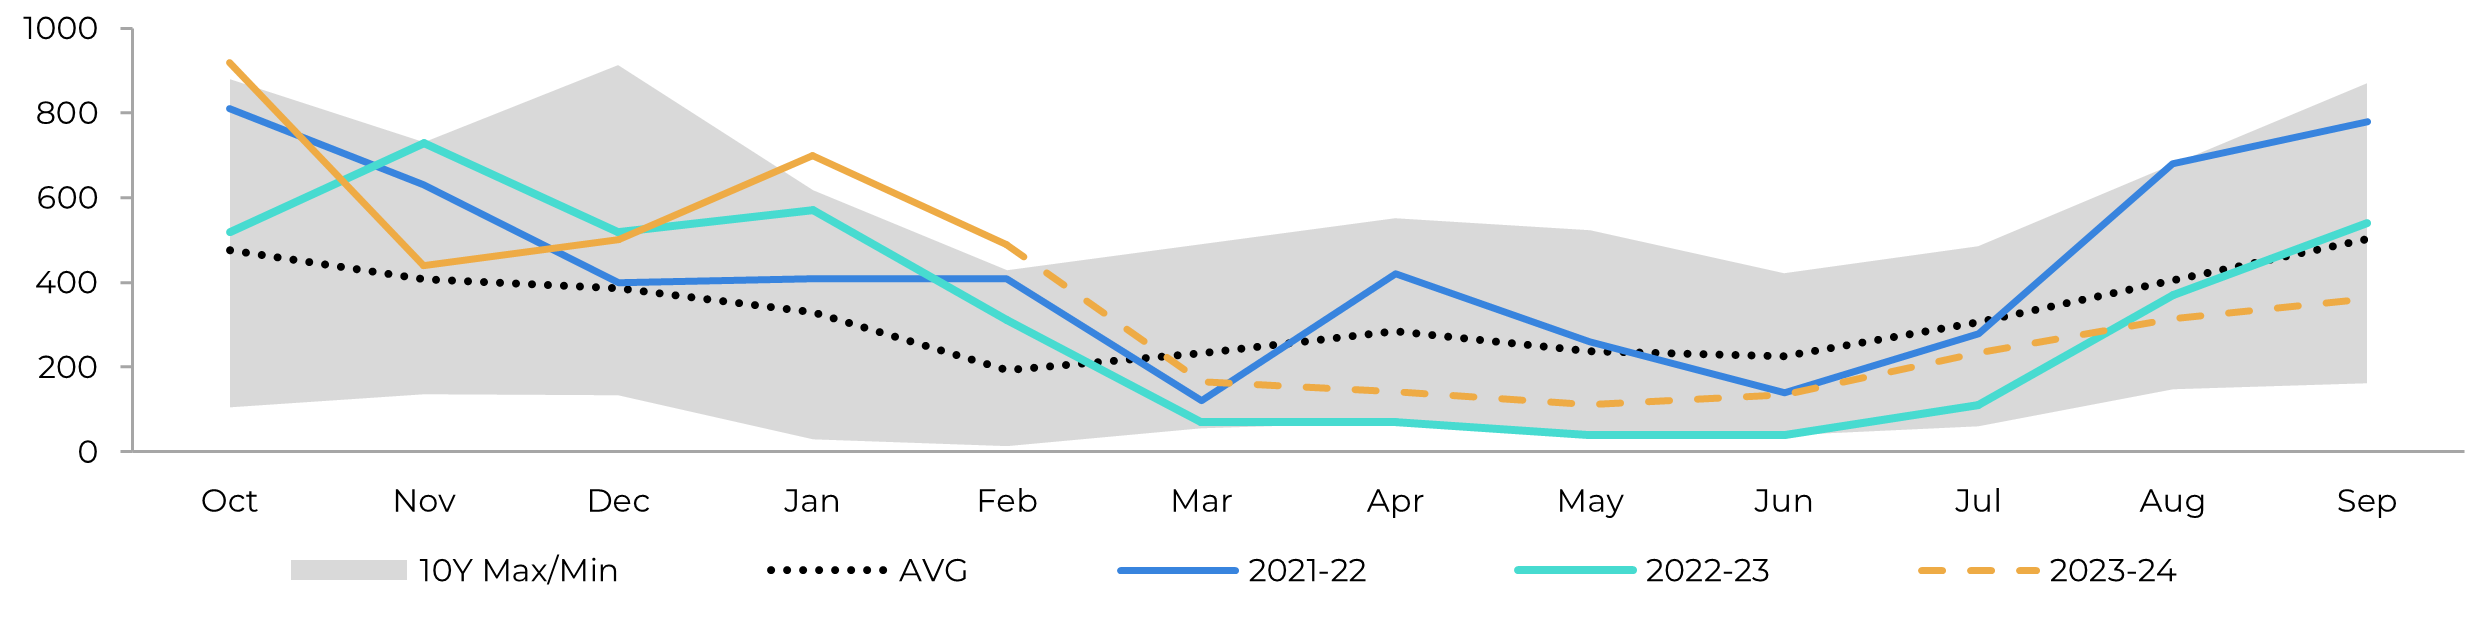
Image 27: Total Production - China ('000t)
Source: GSMM, hEDGEpoint
Source: CSA, Refinitiv, Greenpool, hEDGEpoint
Weekly Report — Sugar and Ethanol
livea.coda@hedgepointglobal.com
laleska.moda@hedgepointglobal.com
Sugar and Ethanol Desk
murilo.mello@hedgepointglobal.com
vipul.bhandari@hedgepointglobal.com
gabriel.oliveira@hedgepointglobal.com
etori.veronezi@hedgepointglobal.com
Disclaimer


Contact us
Check our general terms and important notices.
We have updated our Terms & Conditions to reflect improvements to our platform, data handling practices, and the overall experience we provide to our clients.