
Sugar and Ethanol Monthly Report - 2024 05 03
"The market has shifted towards a more bearish momentum. Not only are global conditions challenging for agricultural commodities due to slower inflation correction and a strong dollar, but sugar fundamentals have also weakened. Regarding trade flows, India's approval of exports to the Maldives and potential exports from Pakistan (close to 700kt) this season suggest a shift towards a more bearish trend. Brazil is expected to supply ample sugar to the global market until the end of Q4/24. The projected deficit in Q1/25 is relatively small, as the Northern Hemisphere is anticipated to recover, indicating that without significant adverse events, short- and medium-term price reactions are likely to be subdued."
S&D and Trade Flow
The market has shifted towards a more bearish momentum. Not only are global conditions challenging for agricultural commodities due to slower inflation correction and a strong dollar, but sugar fundamentals have also weakened.
In the Center-South region, 24/25, although smaller than the record 23/24 crop, is expected to be the second best in terms of cane volume and sugar production. Furthermore, results in the Northern Hemisphere for the current crop have improved, with prospects for 24/25 signaling a recovery in the region. India's recent approval to divert a further 800kt to ethanol indicates that the country's sugar availability is better than initially thought. The Indian Meteorological Department forecasts a slightly above-average 2024 monsoon, which could positively impact sugarcane development and induce yield recovery. Consequently, India might return as an exporter next season, especially if prices remain above their parity level.
Weaker overall demand has prevented prices from rebounding above 20c/lb. China, a key importer, supported prices above 20.5c/lb in Q1-24; however, with domestic production increasing and substantial imports already made, the country may become less inclined to import sugar, potentially driving the Chinese arbitrage closer to a no-premium level around 18c/lb.
With increased global supply, India's exporting parity might determine the price floor for 24/25. Presently, considering premiums and costs, the market would need to offer over 19c/lb to attract Indian millers.
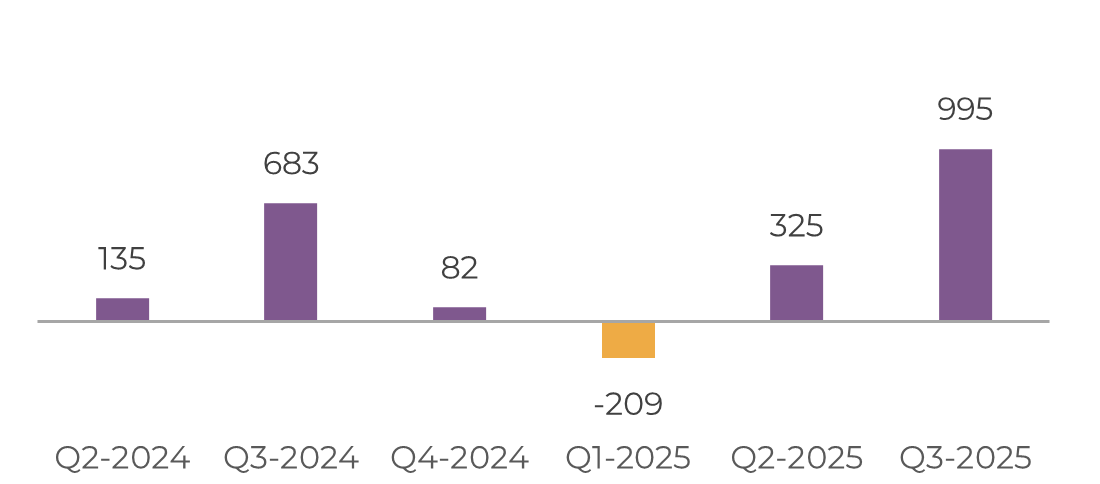
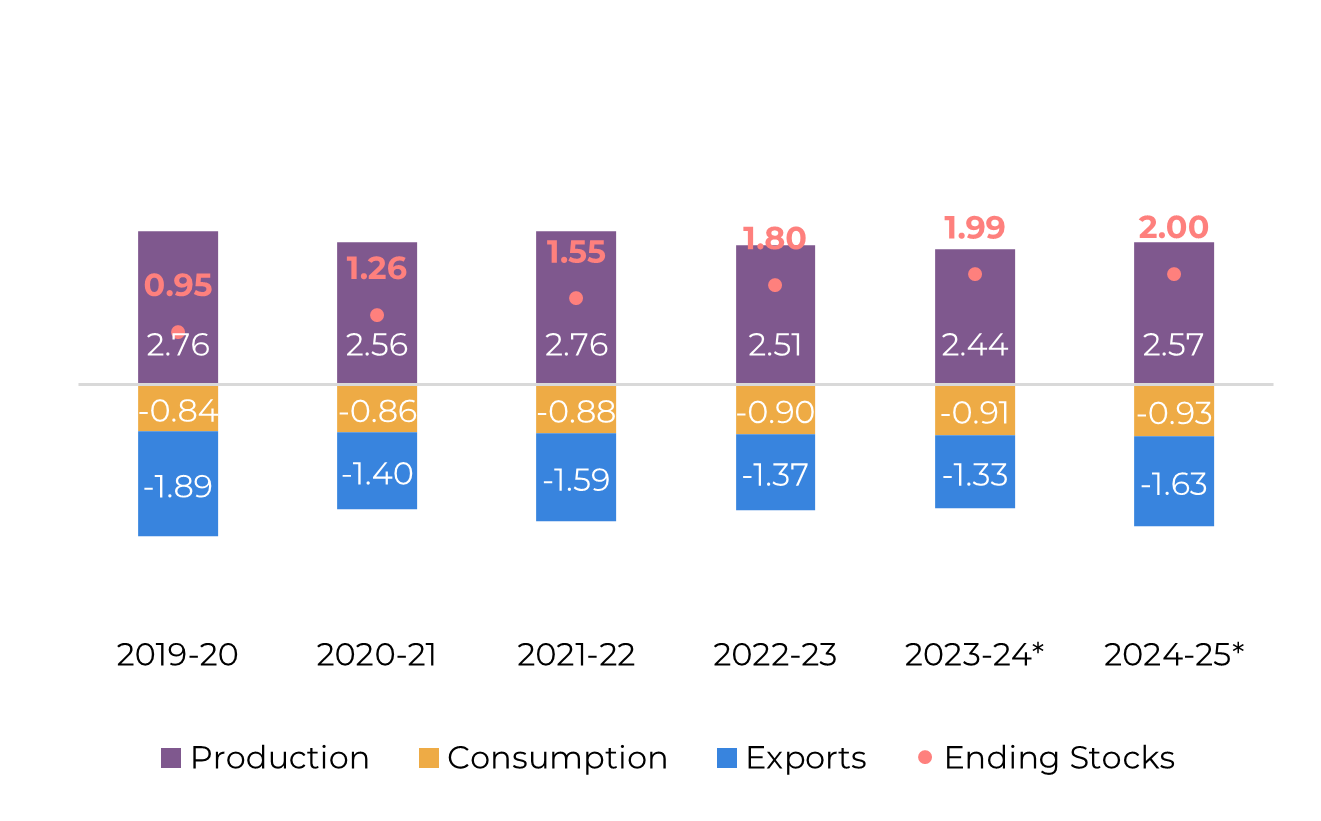
Regarding trade flows, India's approval of exports to the Maldives and potential exports from Pakistan (close to 700kt) this season suggest a shift towards a more bearish trend. Brazil is expected to supply ample sugar to the global market until the end of Q4/24. The projected deficit in Q1/25 is relatively small, as the Northern Hemisphere is anticipated to recover, indicating that without significant adverse events, short- and medium-term price reactions are likely to be subdued.
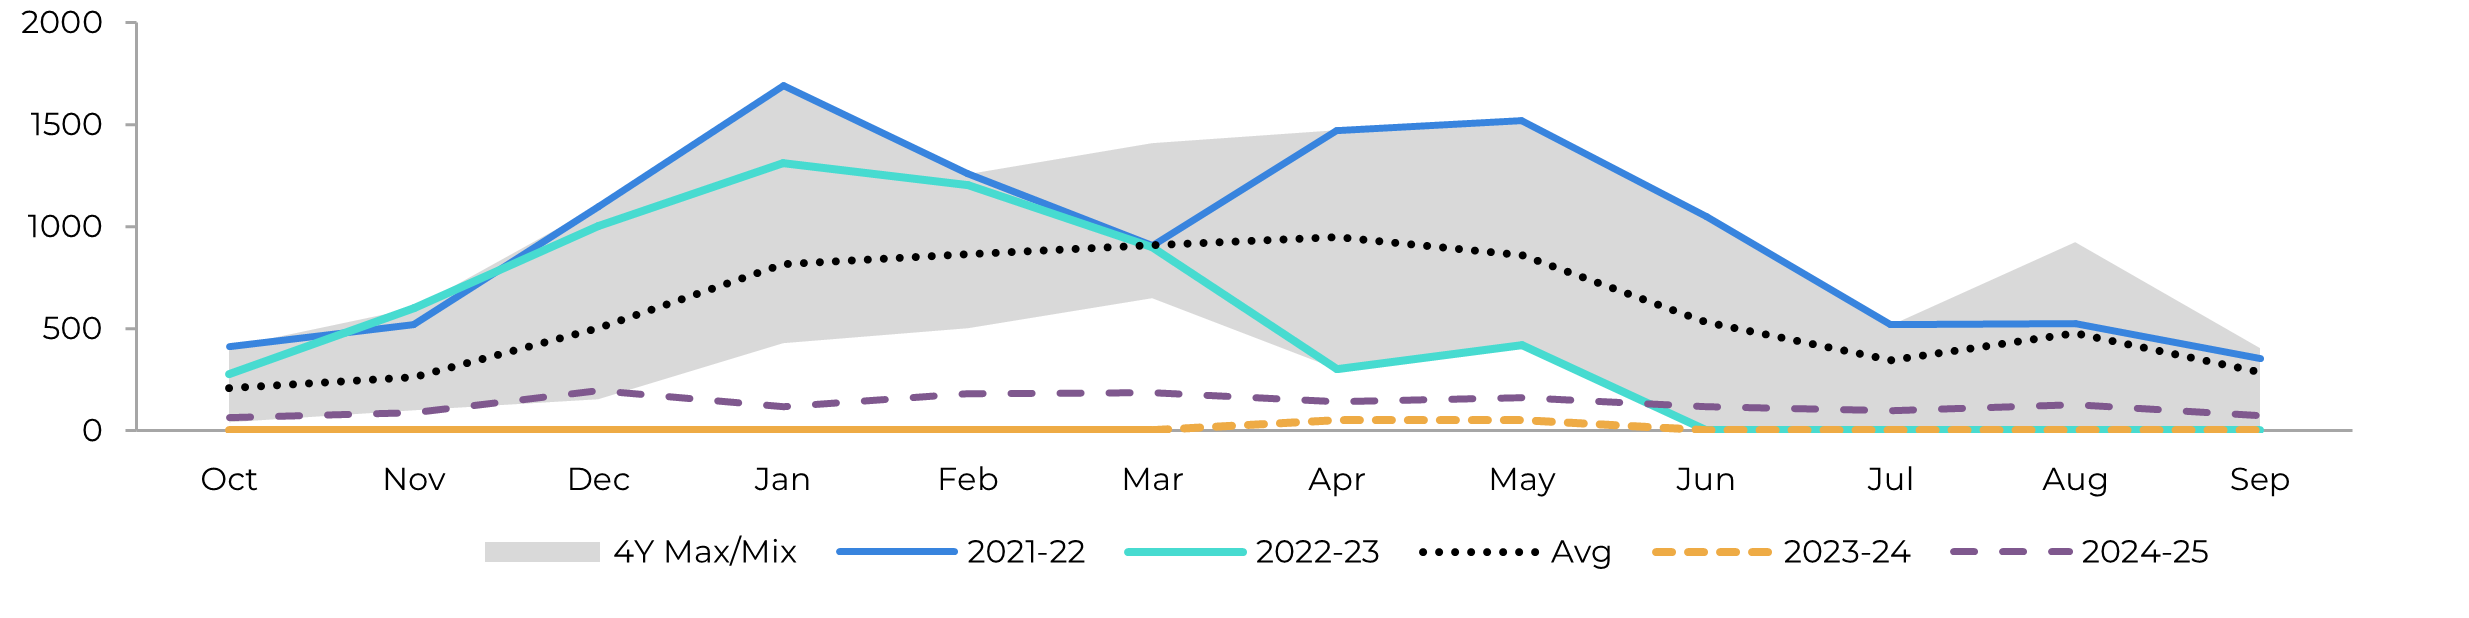
Image 1: Total Trade Flow ('000t)
Source: Hedgepoint
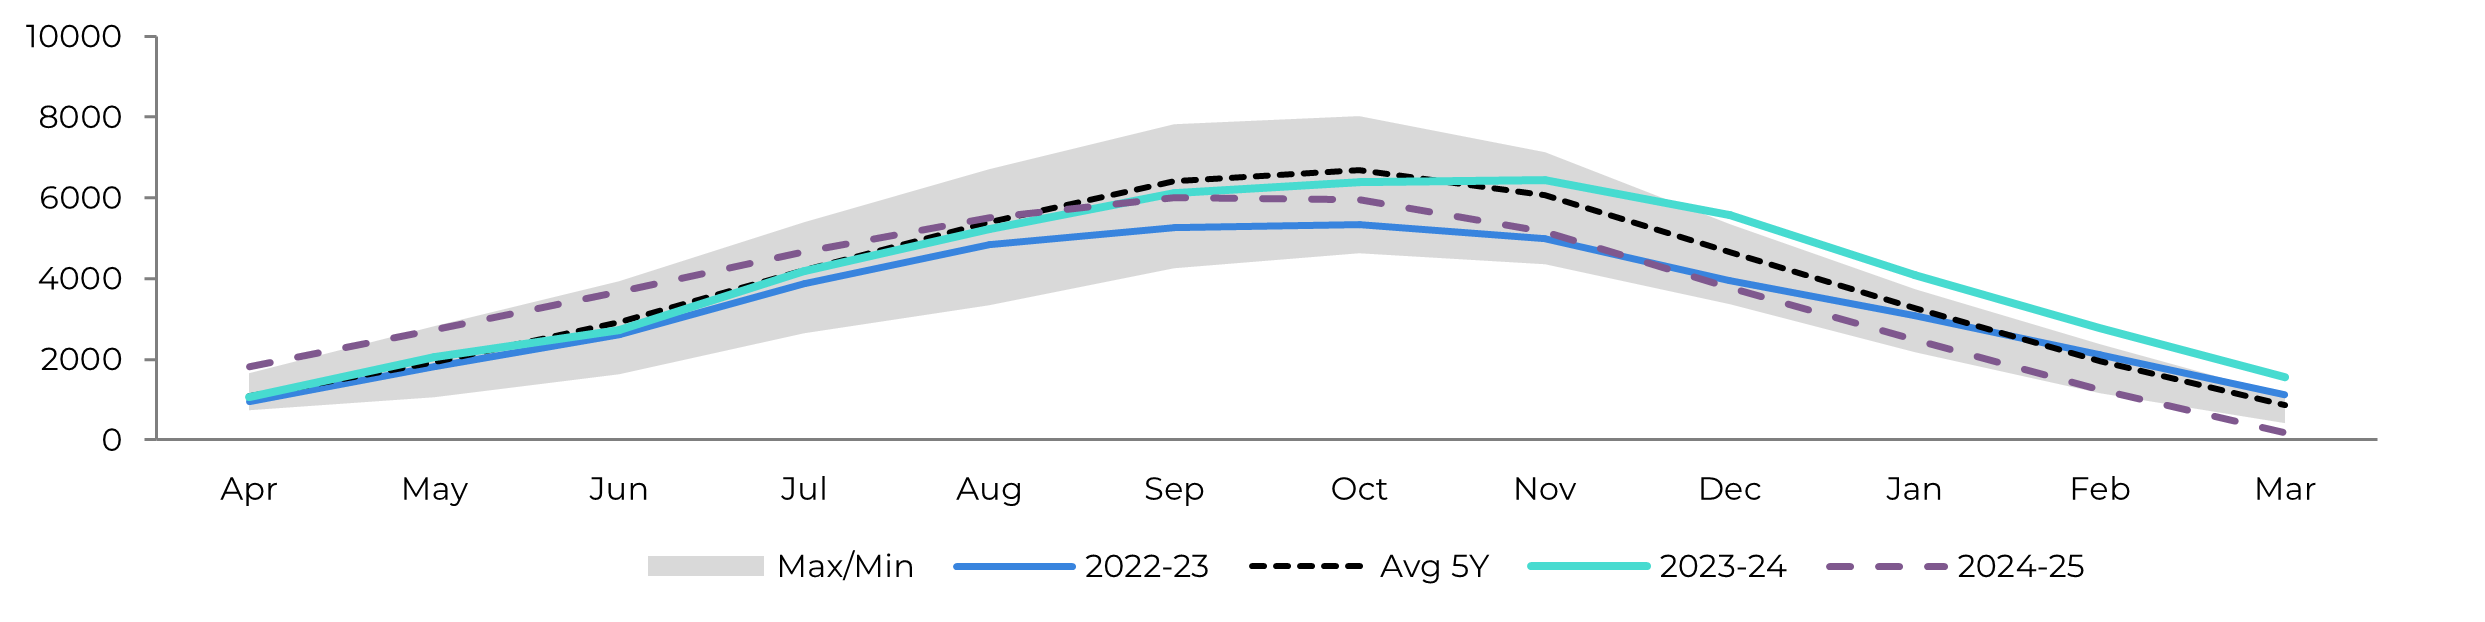
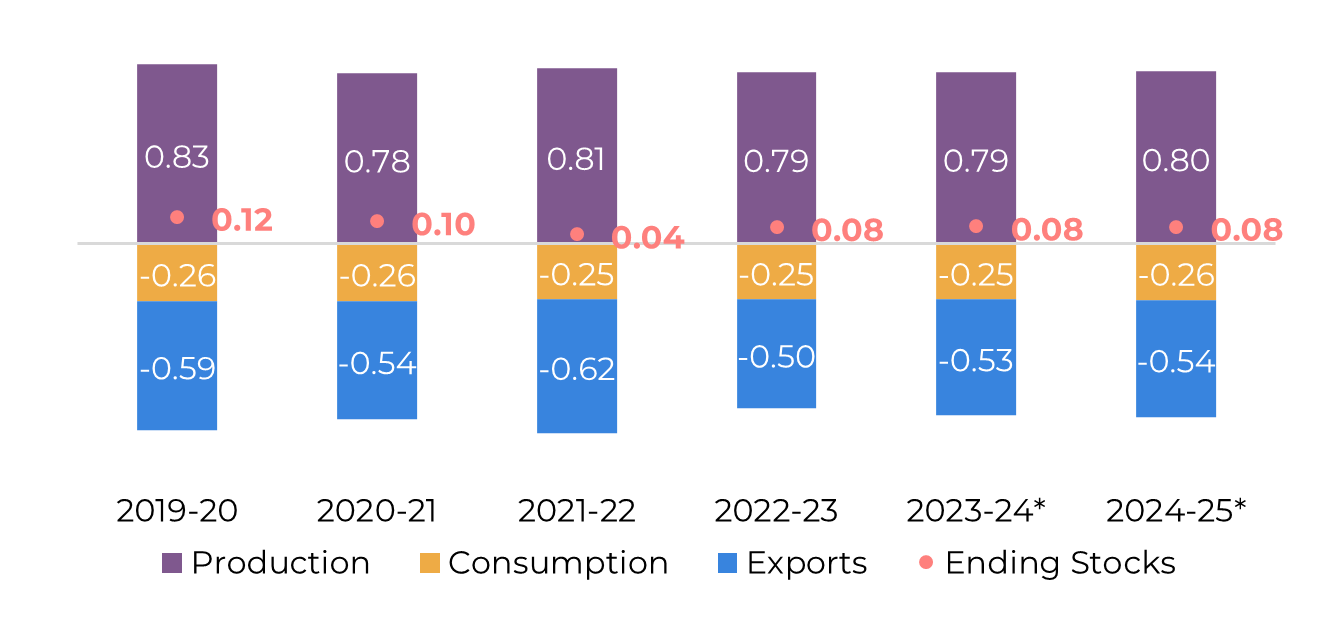
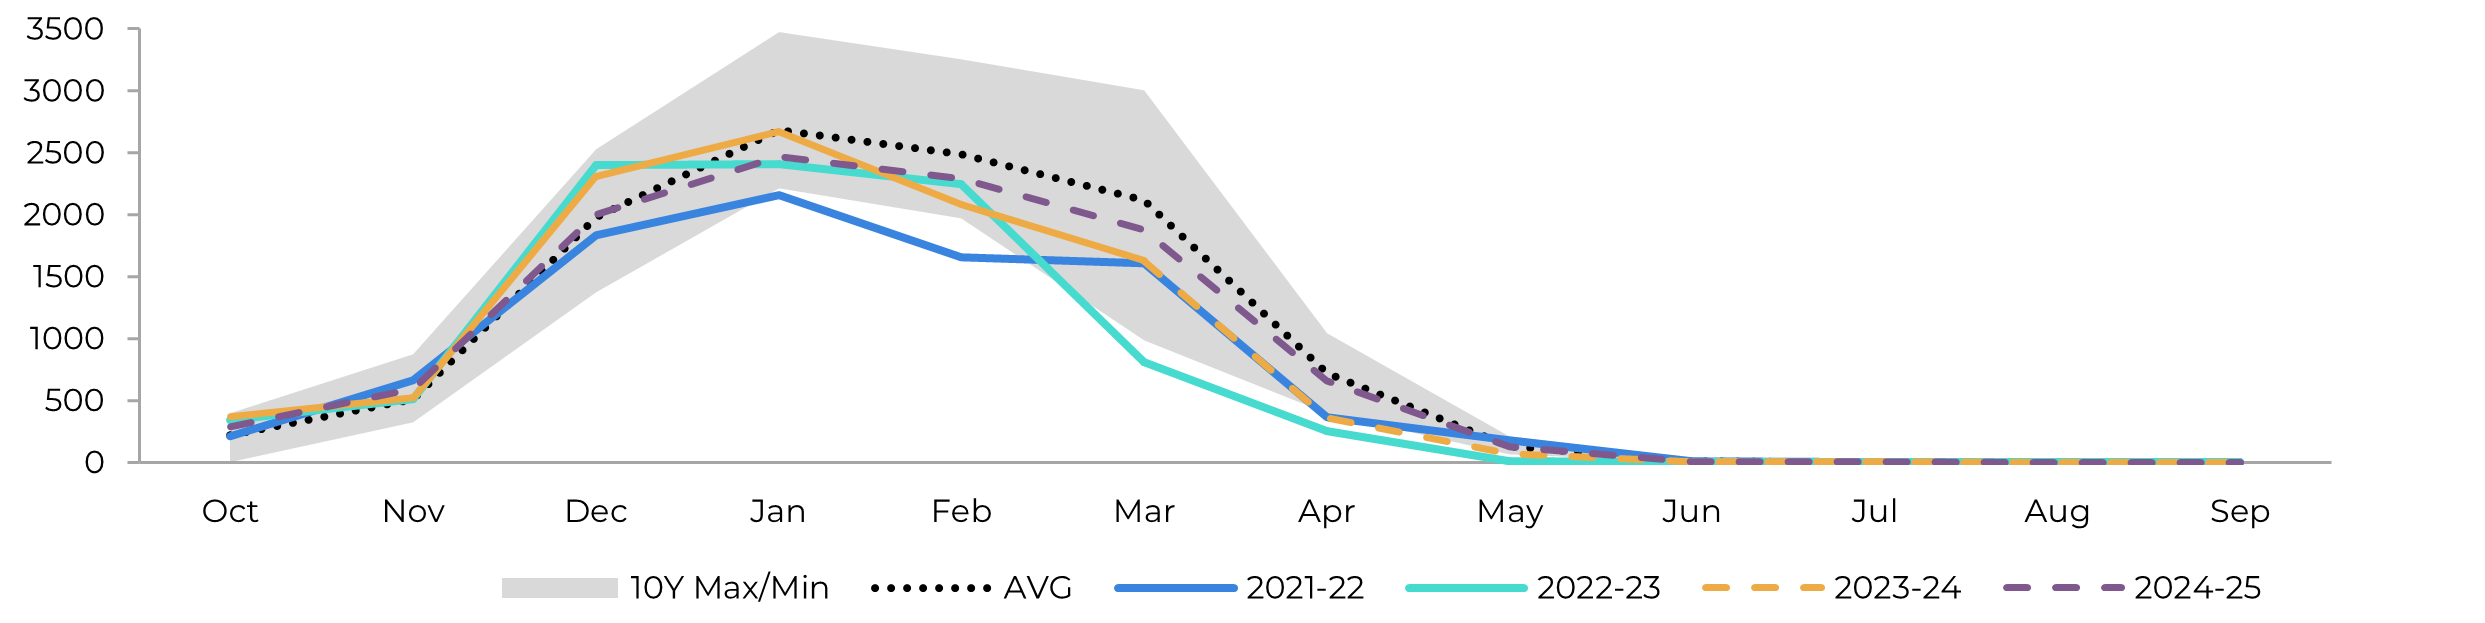
Image 2: Raw's Trade Flow ('000t)
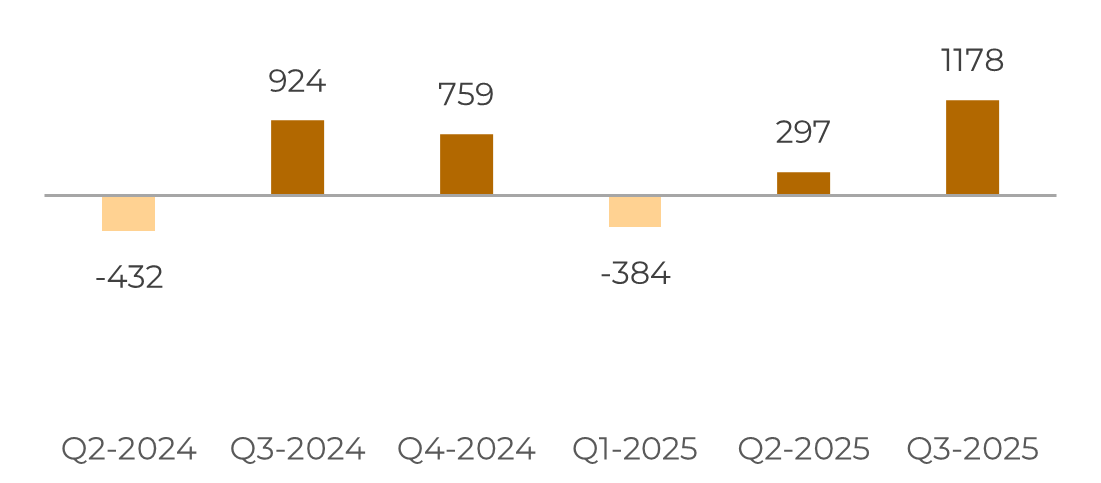
Source: Hedgepoint
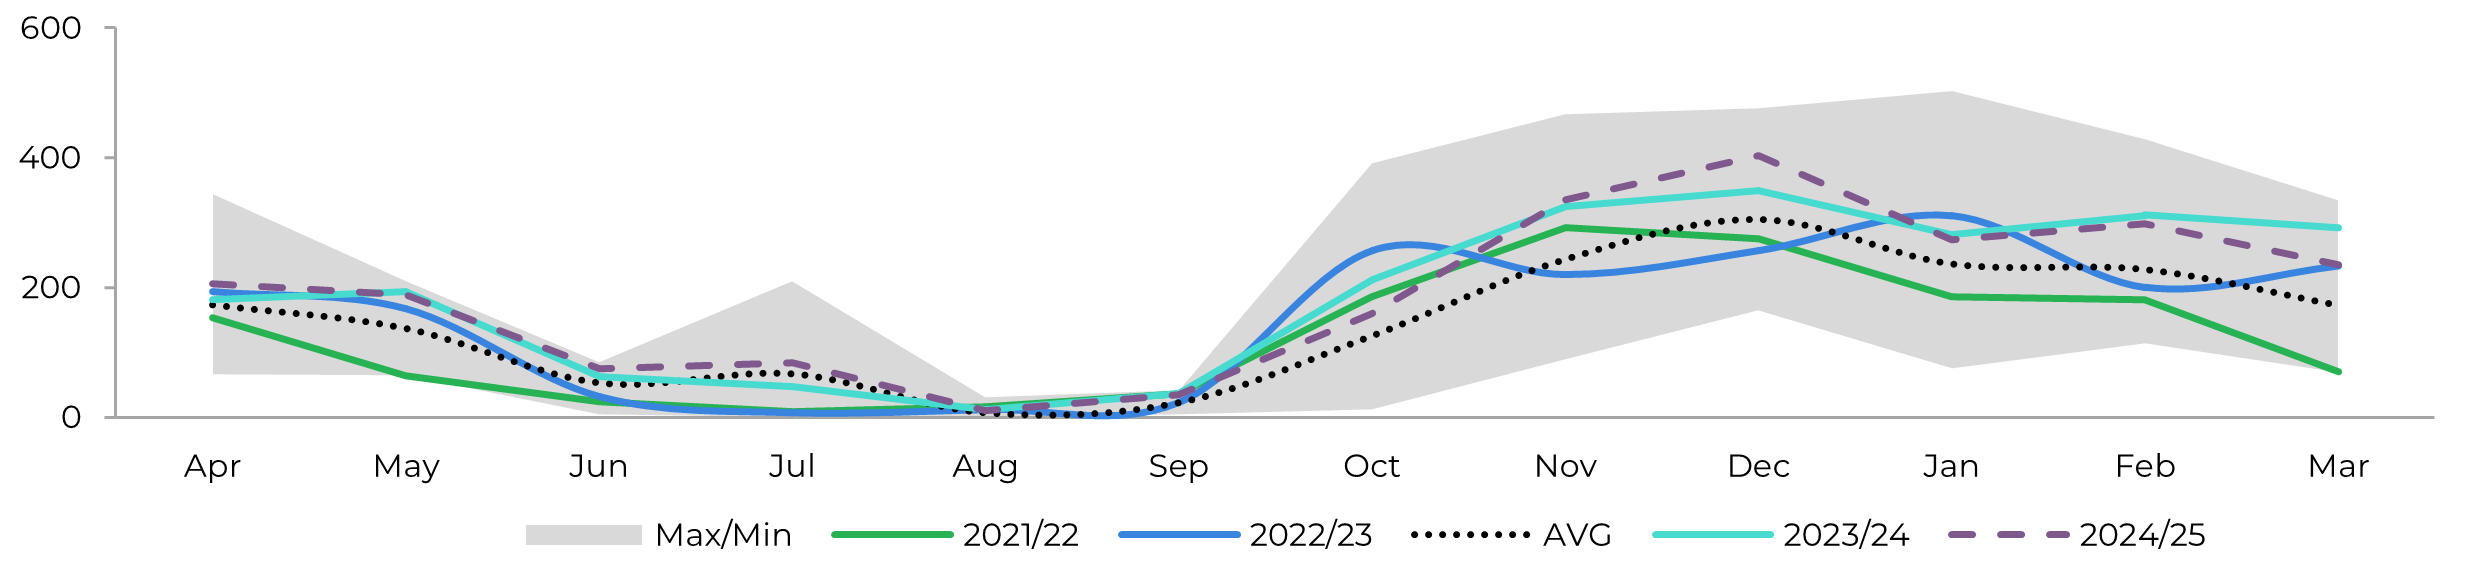
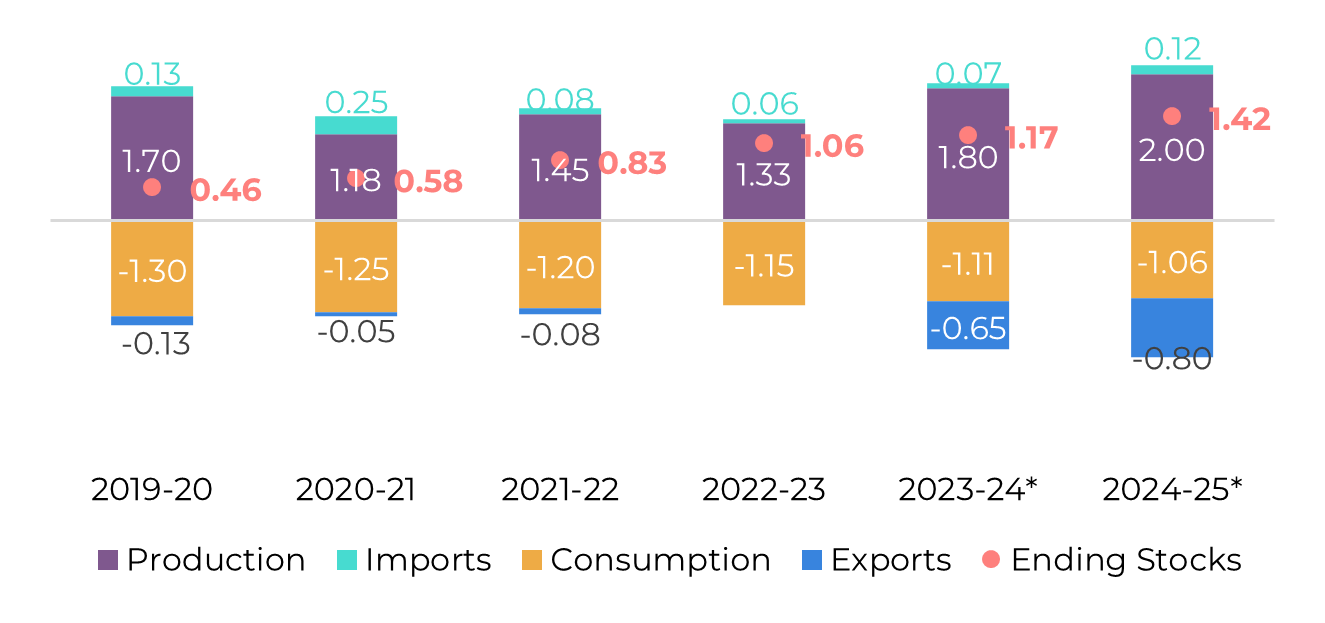
Image 3: White's Trade Flow ('000t)
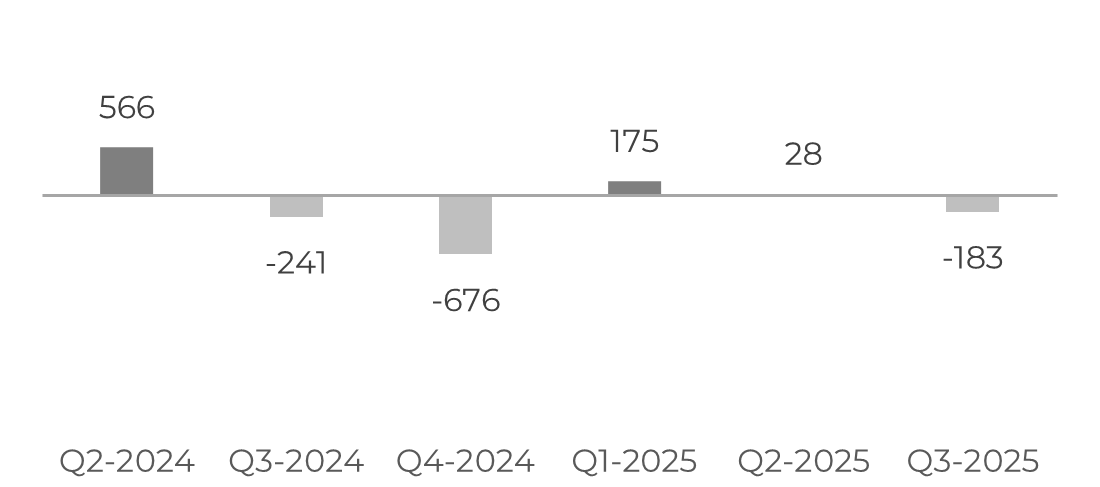
Source: Hedgepoint
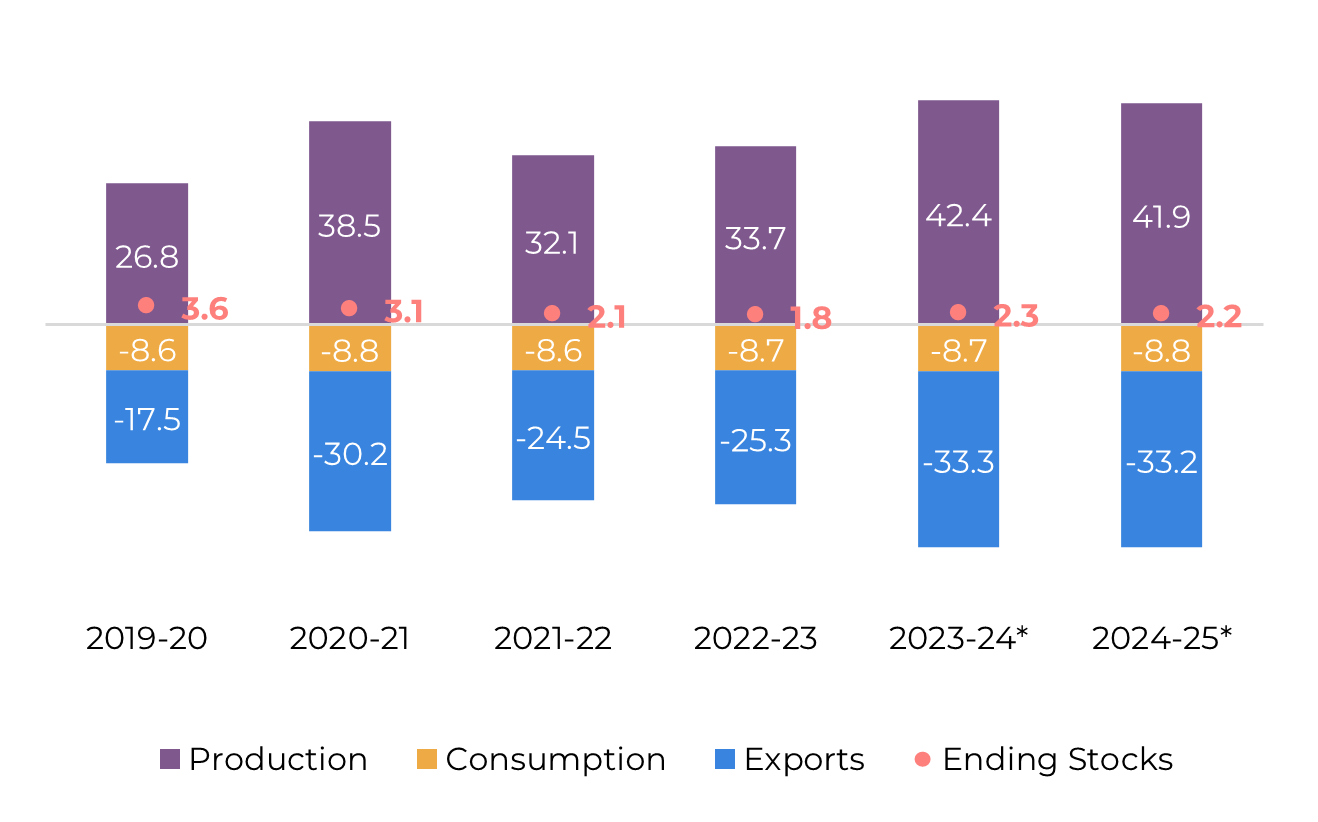
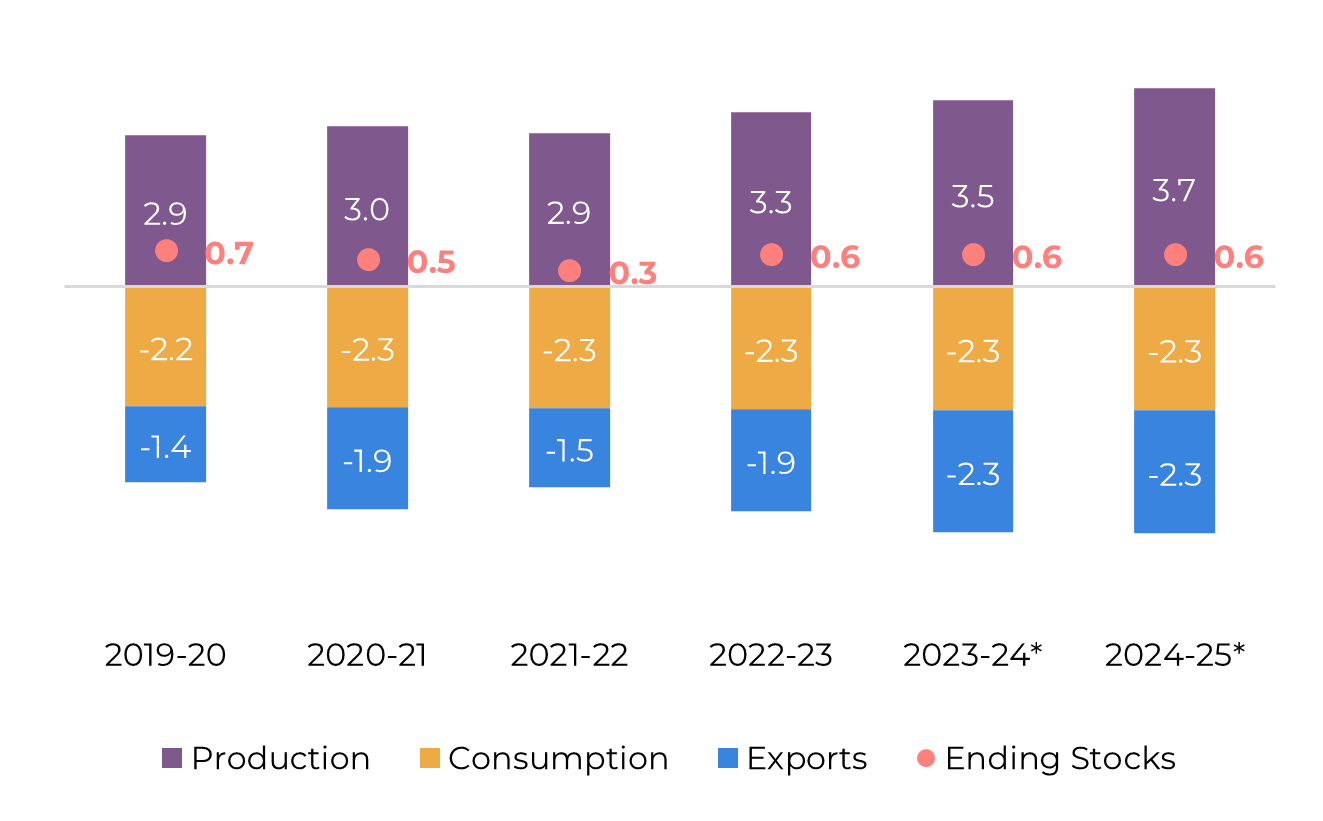
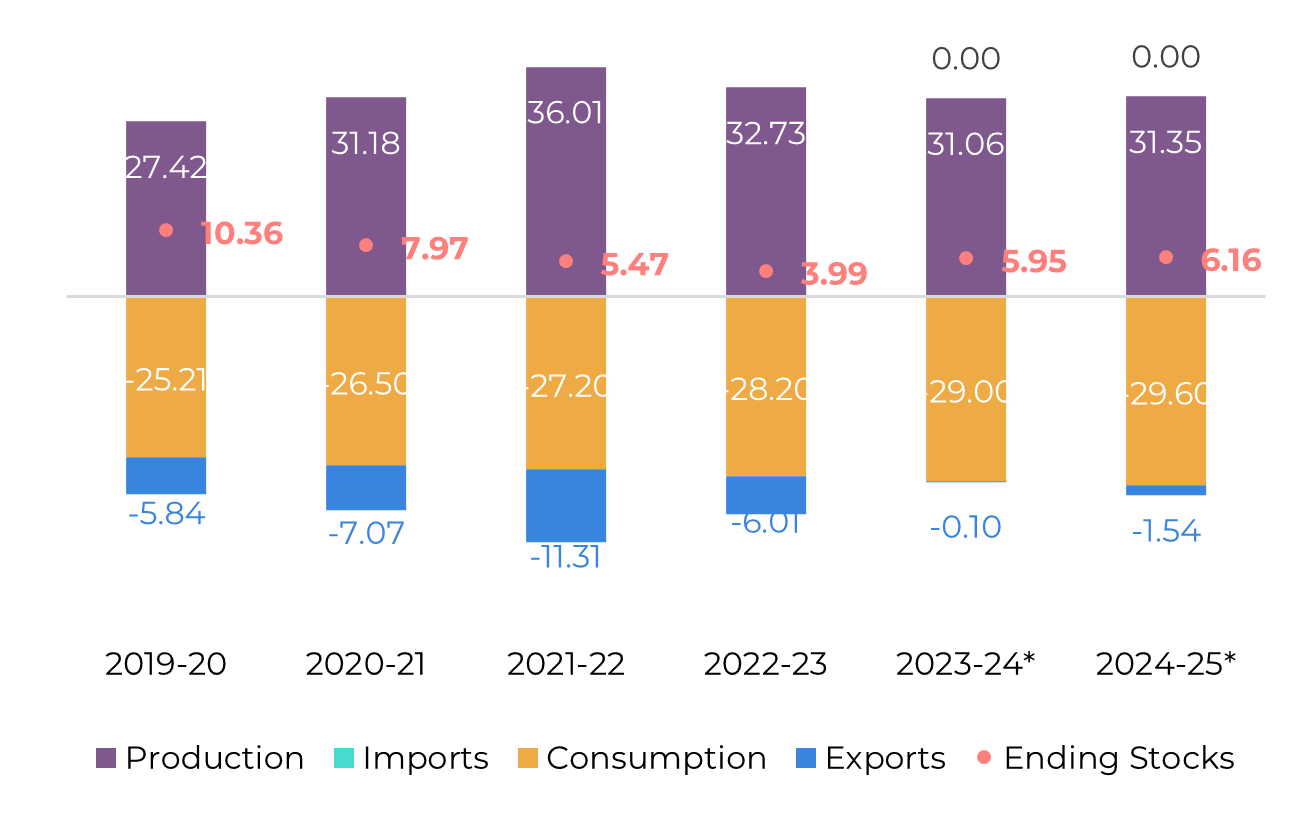
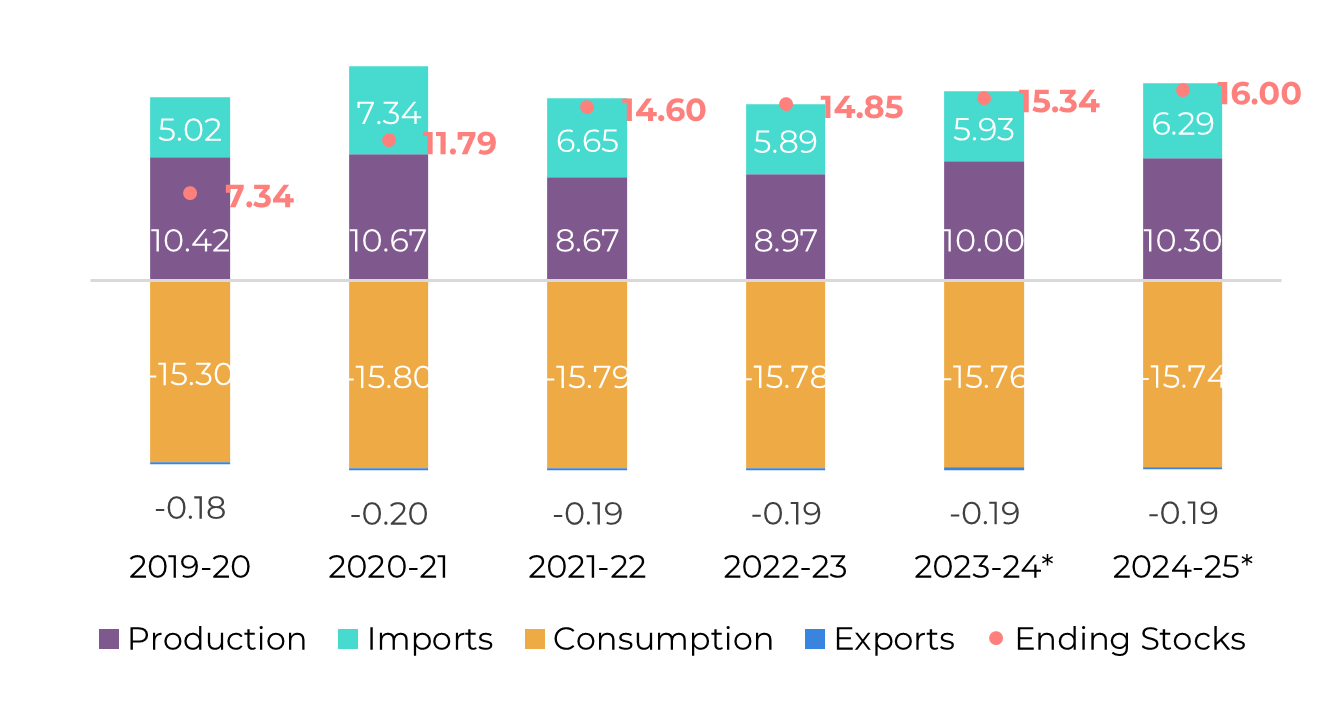
Image 4: Global Supply and Demand Balance (MT RV oct-sep)
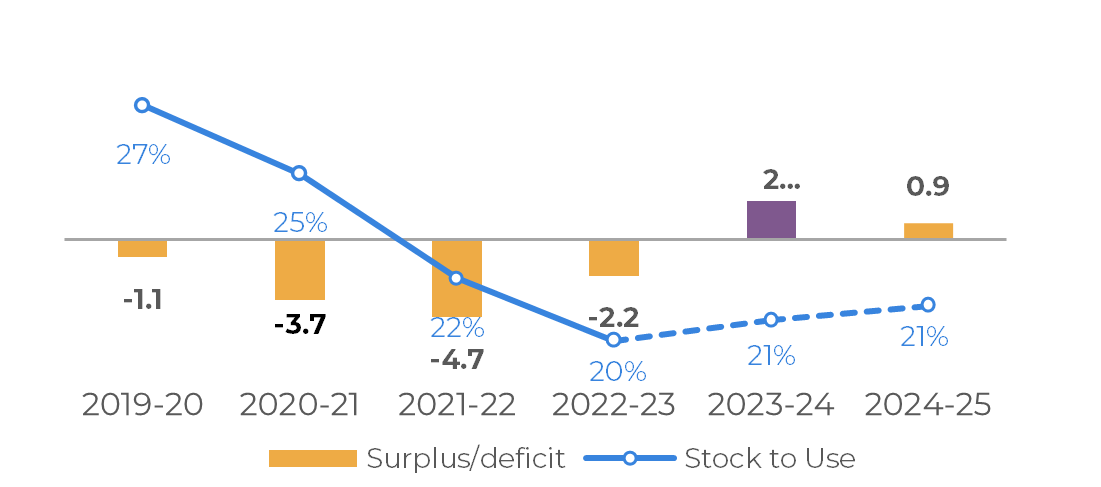
Source: Hedgepoint
Brazil CS
Image 5: Sugar Balance - Brazil CS (Apr-Mar Mt)
Source: Unica, MAPA, SECEX, Hedgepoint
The 23/24 crop season ended breaking many records. Not only was cane volume the highest in history, at 654.5Mt but both subproducts, sugar, and ethanol, reached their biggest production level at 42.4Mt and 33.6B liters respectively.
Brazil has been the main bearish factor behind current prices, having actively participated in past deliveries with a large amount of sugar, offsetting part of the Northern Hemisphere crop failure.
Regarding 24/25, we expect a retraction in raw material due to adverse weather conditions, however, we still expect cane and sugar production to reach their second-best result so far.
Compared to 23/24, the record crop, it will be a big retraction to remain between 605 and 610Mt of cane, but historically, it is a healthy result.
Given the investments made in the crystallization process, one could expect the sugar mix to go up to 52%, inducing a lower impact on the sweetener's volume - only a 600kt retraction. The risk regarding these figureslies in the timing of the new installations: will the new sugar factories (capacity) operate throughout the entire season? This could impact sugar mix. But so far, we remain optimistic in terms of availability and, thus, Brazil is the main bearish player in the coming months.
Image 6: Total Exports - Brazil CS ('000t)
Image 7: Total Stocks - Brazil CS ('000t)
Source: SECEX, Williams, Hedgepoint
Source: Unica,MAPA, SECEX, Williams, Hedgepoint
Brazil CS Ethanol
Image 8: Otto Cycle - Brazil CS (M m³)
Source: ANP, Bloomberg, Hedgepoint
Otto Cycle figures in 23/24 closed with a 4.6% increase compared to the previous season. Fuel consumption volume showed quite some strength between April and May but was rather disappointing during winter. Demand only regained strength by the end of summer. In the end, the year accumulated positive growth, however, in terms of availability, the record crop granted stock increase, leading to a sharp correction in prices and a significant price disparity compared to sugar.
Image 9: Anhydrous Ending Stocks - Brazil CS ('000 m³)
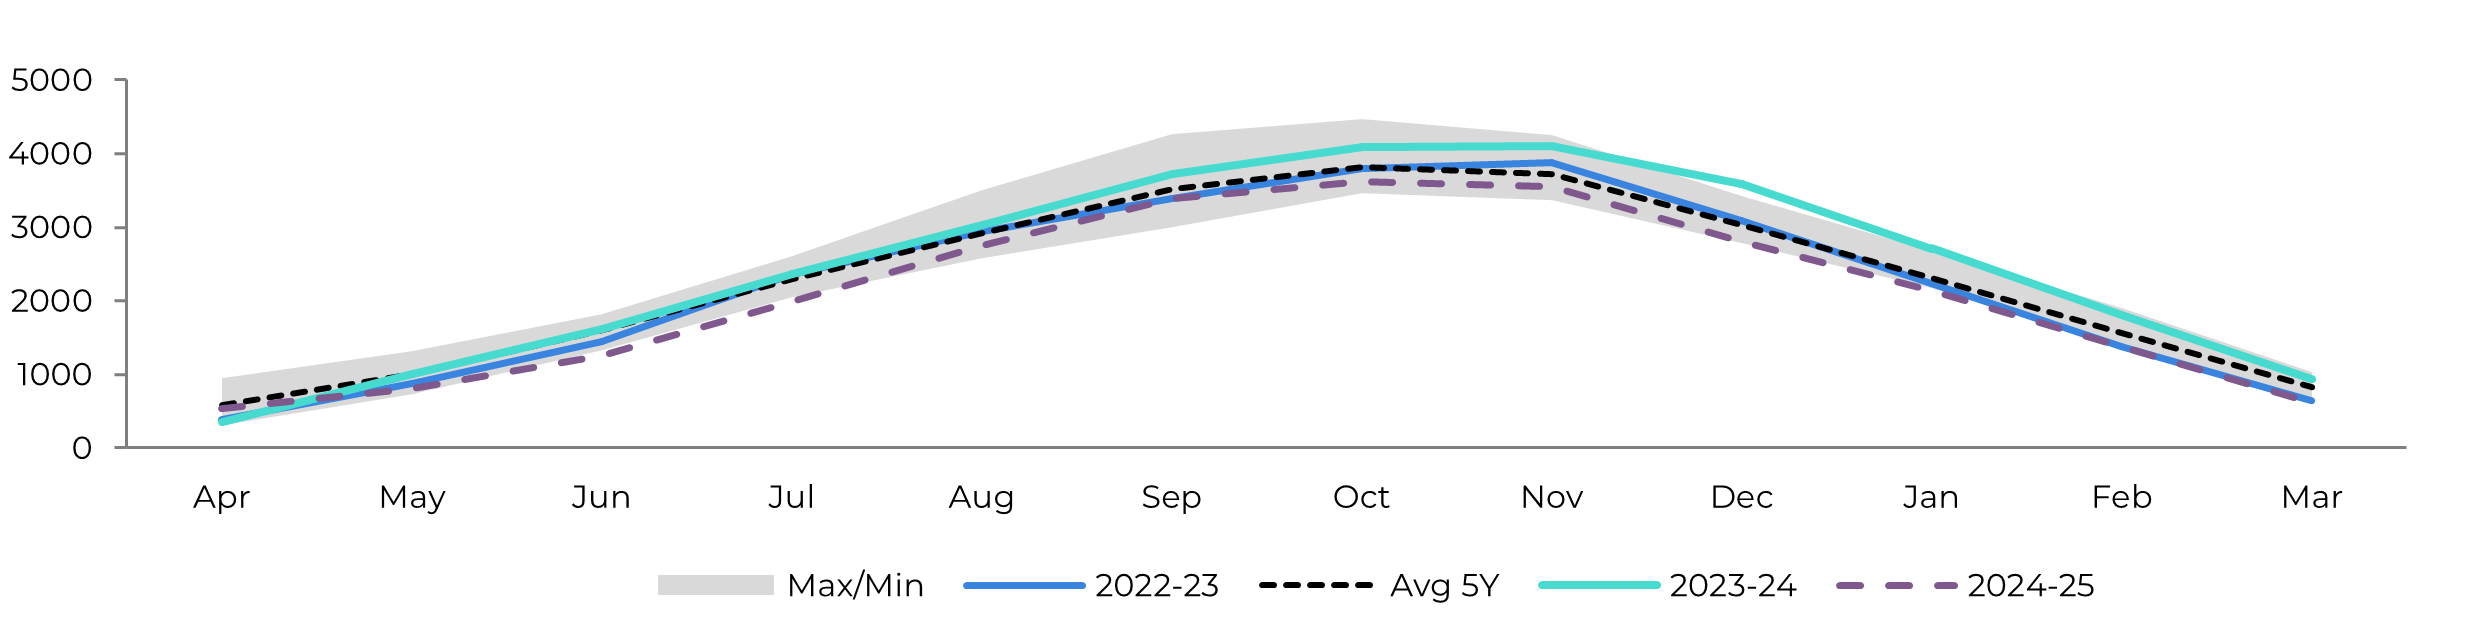
Image 10: Hydrous Ending Stocks - Brazil CS ('000 m³)
Source: Unica, MAPA, ANP, SECEX, Hedgepoint
Source: Unica, MAPA, ANP, SECEX, Hedgepoint
Brazil NNE
Image 11: Sugar Balance - Brazil NNE (Apr-Mar Mt)
Source: MAPA, SECEX, Hedgepoint
During the April-March period, the NNE region reached an export level not seen since 12/13, above 2.3Mt. The majority of the latter volume was of VHP, at nearly 1.8Mt, which contributed to offset some of the Northern Hemisphere's absence.
Looking at the 24/25 season, we remain optimistic. As discussed before, recent rainfall suggests a positive outlook, allowing us to maintain our cane estimate of 63 Mt. Although sucrose content may not see a significant increase due to ongoing rainfall, we anticipate improvements in sugar availability. Mills have invested in crystallization capacity, aiming for a mix approaching 49%, which could result in an estimated sugar production of 3.7 Mt during the period, a 6% improvement compared to 23/24.
Image 12: Total Exports - Brazil NNE ('000t)
Source: SECEX, Hedgepoint
India
Image 13: Sugar Balance - India (Oct-Sep Mt)
Source: ISMA,AISTA, Hedgepoint
During March, India was in the spotlight. While many agencies reported improvements in their 23/24 crop estimate, meteorological estimates point out an above-average monsoon. On the former topic, the recently found availability led to additional export requests (1Mt) and/or higher diversion to ethanol appeals.
Going from a "we will possibly need to import" to a "please let us export or divert raw material" impacted the market in the most bearish way possible, helping raw sugar prices to trade below 20c/lb. In the end, the government obliged, allowing 64.5kt to be exported to the Maldives and another 800kt to be diverted to ethanol.
Ethanol diversion, therefore, reached a total of 2.5Mt, which is not enough to maintain the expected pace of the biofuel program, but will allow an improvement in the 11.6% blending achieved until January 2024. By the end of the season, we expect stocks to recover to the 6Mt level.
For 24/25, weather prediction improvements allow us to expect higher sugar production and ethanol diversion. Regarding biofuel, the country could recover the ethanol program pace by diverting 5.5Mt aiming to achieve the 20% blending mandate. As for sugar, even after this diversion, the country could still export around 1-1.5Mt keeping stocks rather stable.
Image 14: Total Domestic Exports - India ('000t w/o tolling)
Source: ISMA,AISTA, Hedgepoint
Thailand
Image 15: Sugar Balance - Thailand (Dec-Nov Mt)
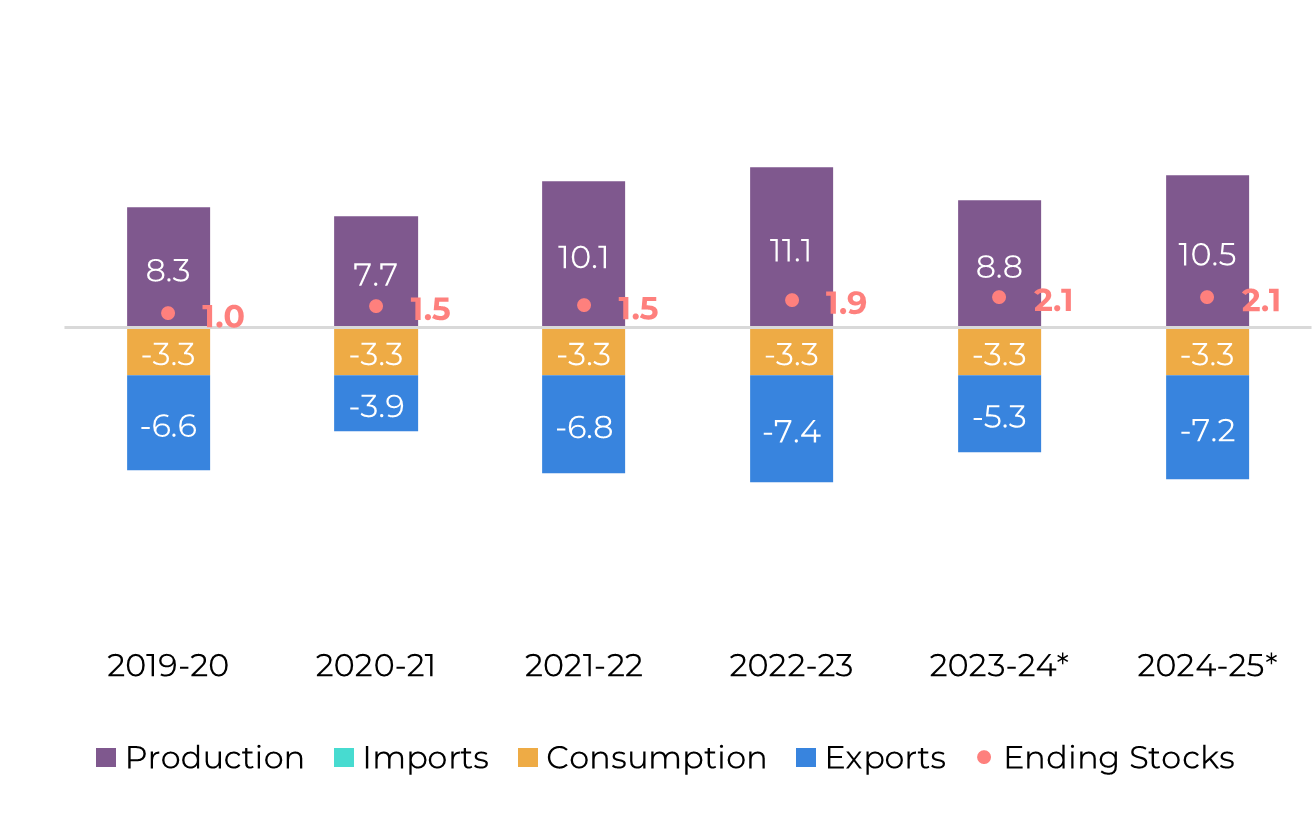
Source: Thai Sgar Millers, Sugarzone, Hedgepoint
Sugar Zone has released the final crushing figures for Thailand's 23/24 season, indicating that the country processed 82 Mt of cane and produced 8.8 Mt of sugar. Optimistically, we expect Thailand to export around 5.3 million metric tons of sugar by the end of September.
Looking ahead to the next season, despite reports of exceptionally high temperatures, Thailand's sugarcane is expected to withstand these conditions given the sufficient water supply. The Thai Meteorological Department forecasts reduced precipitation in May but anticipates a healthy amount of rainfall during June and July, which contributes positively to the recovery expected in the 24/25 season.
Combining these weather conditions with 23/24's final results and sustained competitive prices for sugarcane, we anticipate an increase in cane volume to 98 Mt in the 24/25 season, resulting in an estimated sugar production of 10.50 Mt. It's important to note that this projection remains below the 11Mt achieved in the 2022/2023 season, despite the capacity for 14Mt.
Image 16: Total Exports - Thailand ('000t)
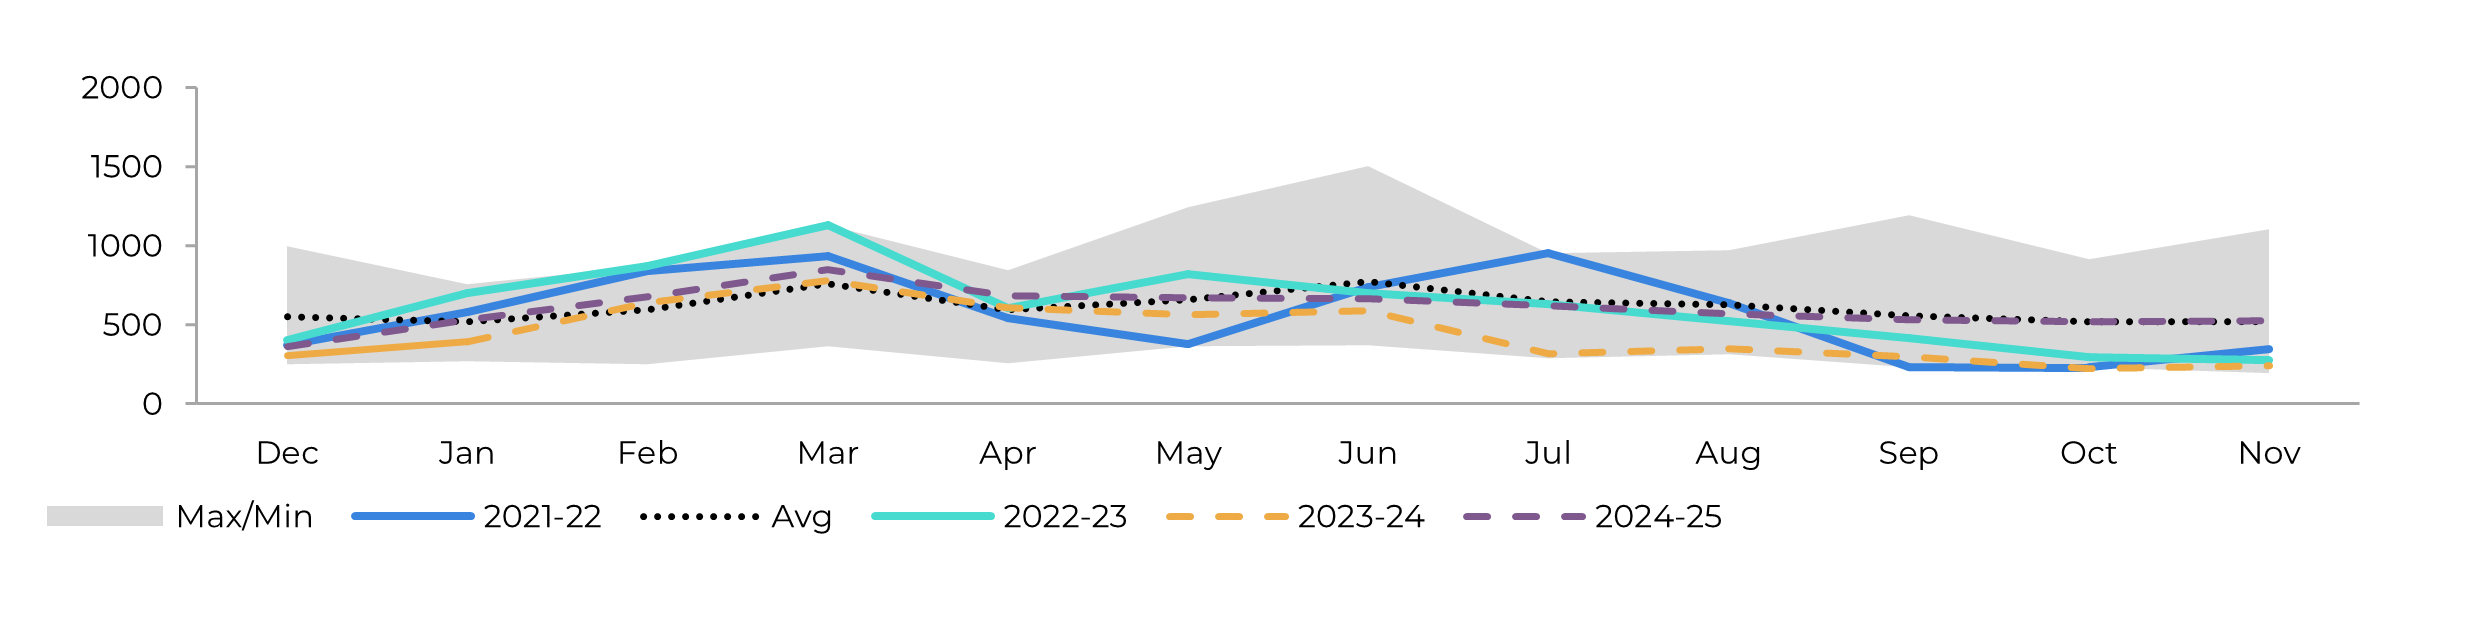
Source: Thai Sgar Millers, Hedgepoint
EU 27+UK
Image 17: Sugar Balance - EU 27+UK (Oct-Sep Mt)
Source: EC, Greenpool, Hedgepoint
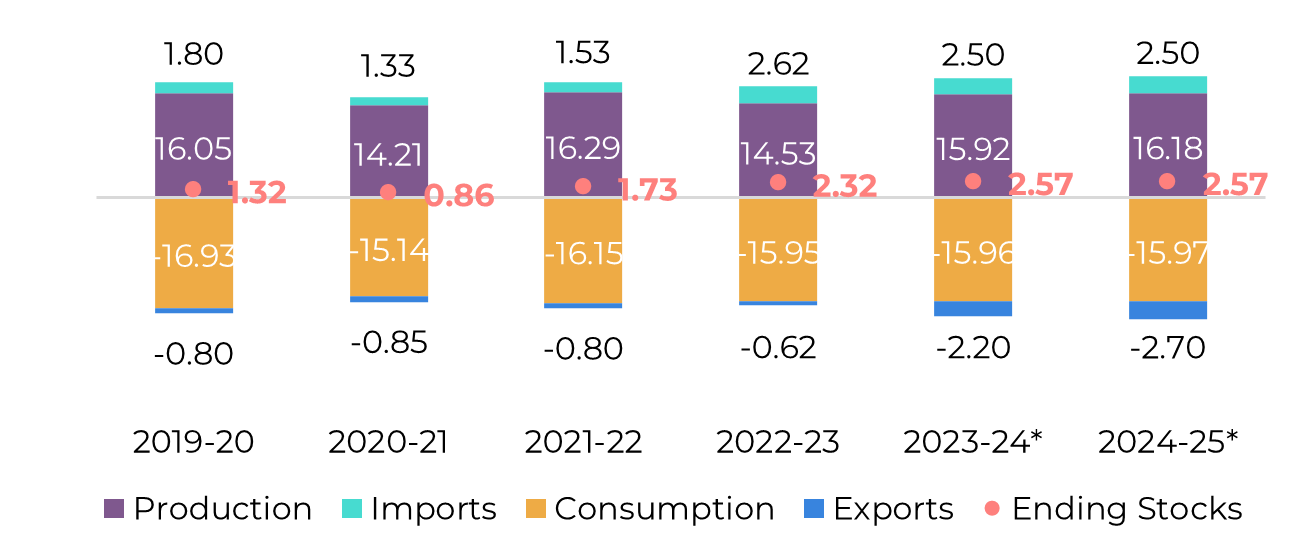
No update: Regarding EU and UK markets, we forecast a recovery in white sugar production, with volumes potentially reaching 15.92 Mt in 23/24, an increase of 9.5% over 22/23. This figure is the result of an increase in the beet area, stimulated by higher prices in 2022, and higher yields.
Mexico
Image 18: Sugar Balance - Mexico (Oct-Sep Mt)
Source: Conadesuca, Greenpool, Hedgepoint
Crop estimates for the 2023/2024 season remain unchanged, indicating an anticipated sharp decline due to adverse weather conditions that affected cane development. With only 4.7 Mt of sugar, export availability has also diminished.
Mexico has crushed 39.4 Mt of cane so far, falling short of Conadesuca's estimate by 900 kt and trailing last season's production by 1.7 Mt. Lower industrial yields, combined with this lower crushing, explain a 500 kt drop in sugar production compared to the 2022/2023 season, resulting in a total of only 3.9 Mt production of the sweetener.
In terms of global trade participation, Mexico has exported only 338 kt thus far, marking a nearly 40% reduction compared to the 22/23 season and a significant 57% drop compared to the 21/22 when the harvest was robust.
It is worth noting that the fall in production has also led to a decrease in domestic sales, with retail prices rising and peaking at the start of the 23/24 crop. Consequently, the reduction in exports and domestic consumption has resulted in lower import volumes compared to the previous season.
Image 19: Total Exports - Mexico ('000t)
Source: Conadesuca, Greenpool, Hedgepoint
USA
Image 20: Sugar Balance - US (Oct-Sep Mt)
Source: USDA, Hedgepoint
The USDA made slight adjustments to their production expectations, with a decrease of 141kt for beet sugar and an increase of 43 kt for cane sugar. The reduction in beet sugar was primarily due to a lower sucrose recovery rate, dropping from 15% to 14.9%. Combining beet and cane, both changes resulted in approximately 100 kt less sugar available. Since import levels remained largely unchanged, with only reallocations, stocks were directly affected by lower availability leading to a decrease in the stock-to-use ratio from 14.3% to 13.4% compared to the previous report.
Looking ahead to the 24/25 season, initial forecasts for beet planted acreage were released by the National Agricultural Statistics Service (NASS), reflecting growers' intentions. Farmers are planning to plant 1.129 million acres of beets, marking a 1.6% increase from the previous year's intentions. However, when compared to 23/24 final acreage, this represents a 0.7% reduction. USDA notes that since final planted acreage could potentially be higher than intentions to offset losses, the 1.6% increase is a reliable indicator of the crop's trajectory.
In terms of cane sugar, USDA predicts that 24/25 will be the second largest crop in recent years, following behind the 20/21 season.
Guatemala
Image 21: Sugar Balance - Guatemala (Oct-Sep Mt)
Source: Cengicaña, Sieca, Azucar.gt,Greenpool, Hedgepoint
Image 22: Total Exports - Guatemala ('000t)
Source: Sieca, Hedgepoint
El Salvador
Image 23: Sugar Balance - El Salvador (Mt Oct-Sep)
Source: Consaa, Sieca, Greenpool,Hedgepoint
The export data for the 22/23 crop season has been released, showing that the country reached 500 kt, which is 18.7% lower than the exports in 2021/22, directly reflecting the decline in production. For the current season, 23/24, production is expected to remain at the same level as in 22/23, allowing exports to maintain a similar pace.
Ukraine
Image 24: Sugar Balance - Ukraine (Mt Sep-Aug)
Source: Ukrsugar, Sugar.ru, Greenpool, Hedgepoint
China
Image 25: Sugar Balance - China (Oct-Sep Mt)
Source: GSMN, CSA, Refinitiv, Greenpool, Hedgepoint
Obs: stocks also account for bonded warehouses volume and imports include syrup and smuggling estimates
Image 26: Total Imports - China ('000t - exc. syrup and smuggling)
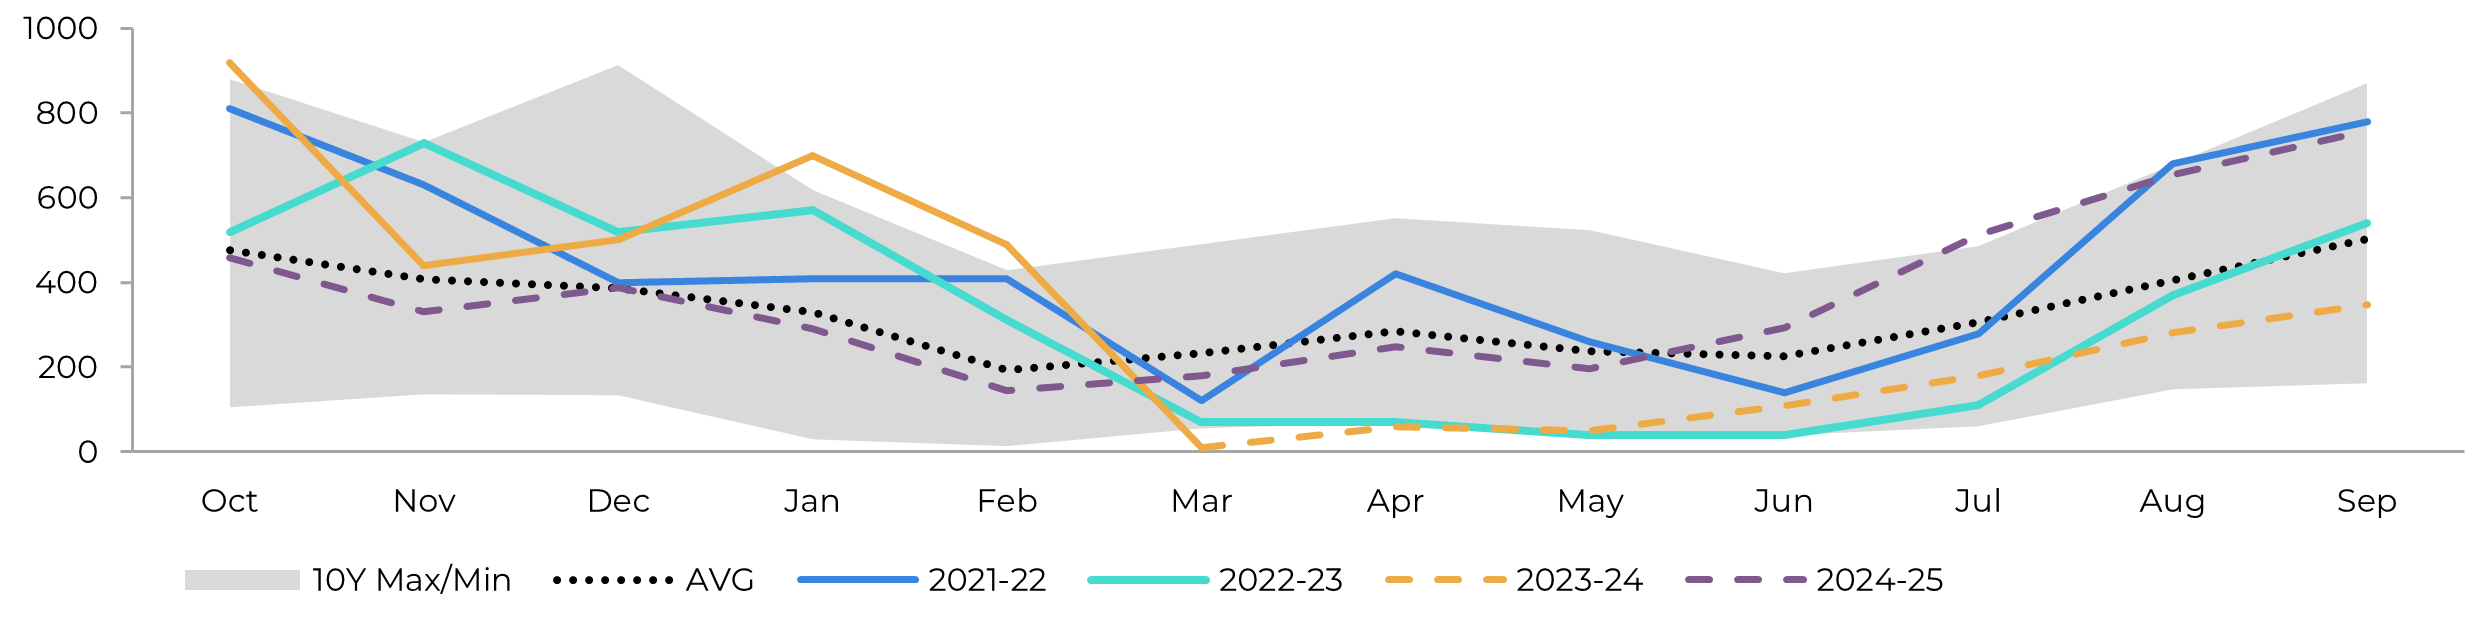
Image 27: Total Production - China ('000t)
Source: GSMM, Hedgepoint
Source: CSA, Refinitiv, Greenpool, Hedgepoint
Weekly Report — Sugar and Ethanol
livea.coda@hedgepointglobal.com
laleska.moda@hedgepointglobal.com
Sugar and Ethanol Desk
murilo.mello@hedgepointglobal.com
vipul.bhandari@hedgepointglobal.com
gabriel.oliveira@hedgepointglobal.com
etori.veronezi@hedgepointglobal.com

