
Sugar and Ethanol Monthly Report - 2024 06 24
"Currently, trade flows indicate a surplus for the 2024 calendar year, while 2025's outlook heavily depends on weather conditions. Therefore, prices are likely to remain within the 17.5-19.5 cents per pound range for some time, with potential technical upside, as traders await weather confirmations. A fundamental-based uptrend could potentially reach 21 cents per pound by the end of 2024 if forecasts suggest availability constraints, especially from Brazil."
S&D and Trade Flow
Currently, trade flows indicate a surplus for the 2024 calendar year, while 2025's outlook heavily depends on weather conditions. Assuming typical patterns, 2025 may also experience oversupply, particularly when Brazil introduces its 2025/26 output to the market. Given the recent La Niña weakening and the Center-South's limited correlation with this climat event’s precipitation patterns, there is insufficient evidence suggesting a significant reduction in cane volume from the region for 2025/26.
The market might witness a price rebound during Brazil's 2024/25 intercrop period, but mills could manage stocks and balance trade flows to mitigate any potential deficit. Thus, while there is room for price support, particularly to attract Indian sugar, the movement may not be as robust as some bullish traders anticipate.
Regarding Indian price parity, current estimates place it around 21.5 cents per pound considering domestic prices. However, this level could adjust once crushing and restocking begin, indicating that prices may not need to be as high to incentivize Indian mills' exports - but remember , government needs to comply! Nonetheless, if domestic prices hold firm, this could provide the necessary upside for Indian exports - indicating a mild effect rather than a strong bullish trend.
However, if weather conditions turn out worse than expected for the Northern Hemisphere's 2024/25 crop development and Brazil's 2025/26 season, the market dynamics could drastically change. But, this is still a speculative scenario, as some might contend that assuming average weather conditions is equally uncertain.
Therefore, prices are likely to remain within the 17.5-19.5 cents per pound range for some time, with potential technical upside, as traders await weather confirmations. A fundamental-based uptrend could potentially reach 21 cents per pound by the end of 2024 if forecasts suggest availability constraints, especially from Brazil.
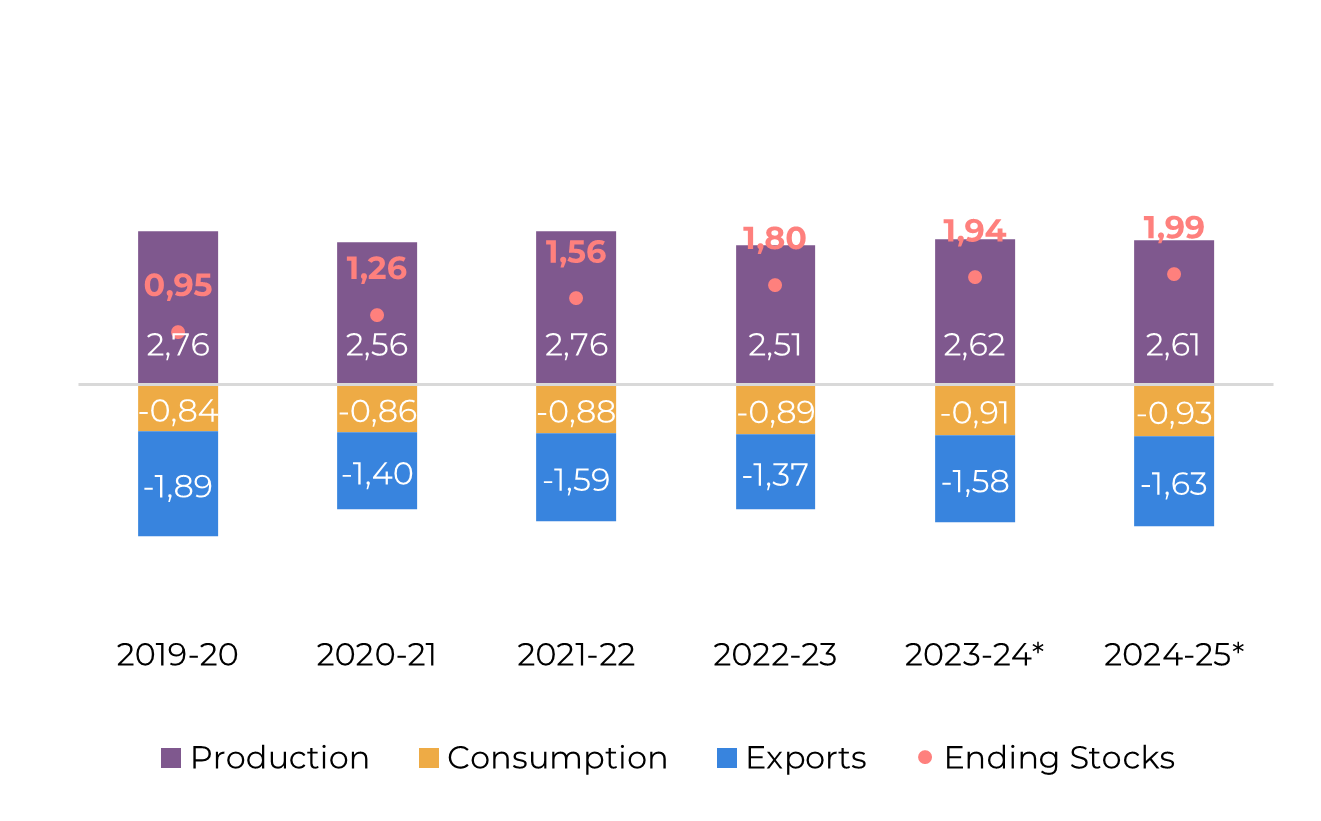
Image 1: Total Trade Flow ('000t)
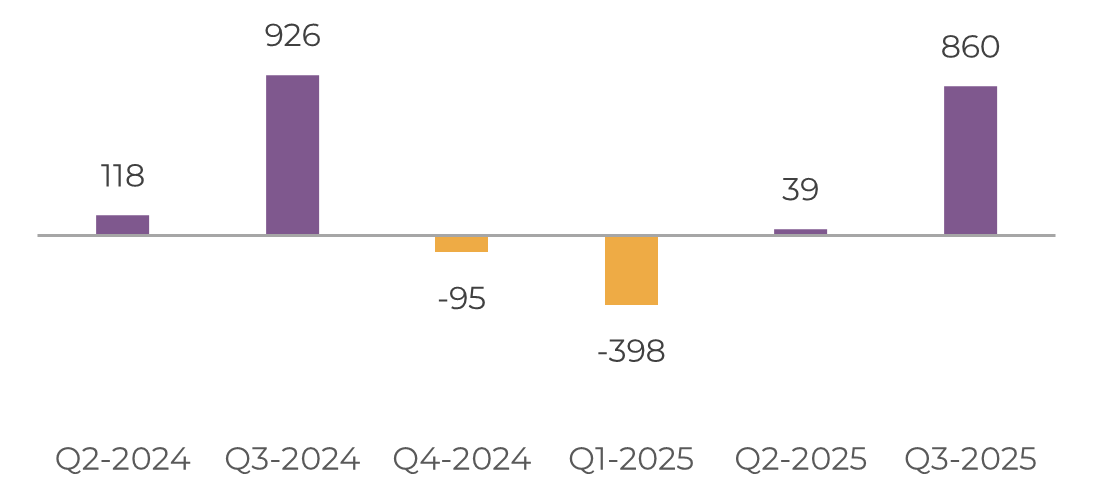
Source: Hedgepoint
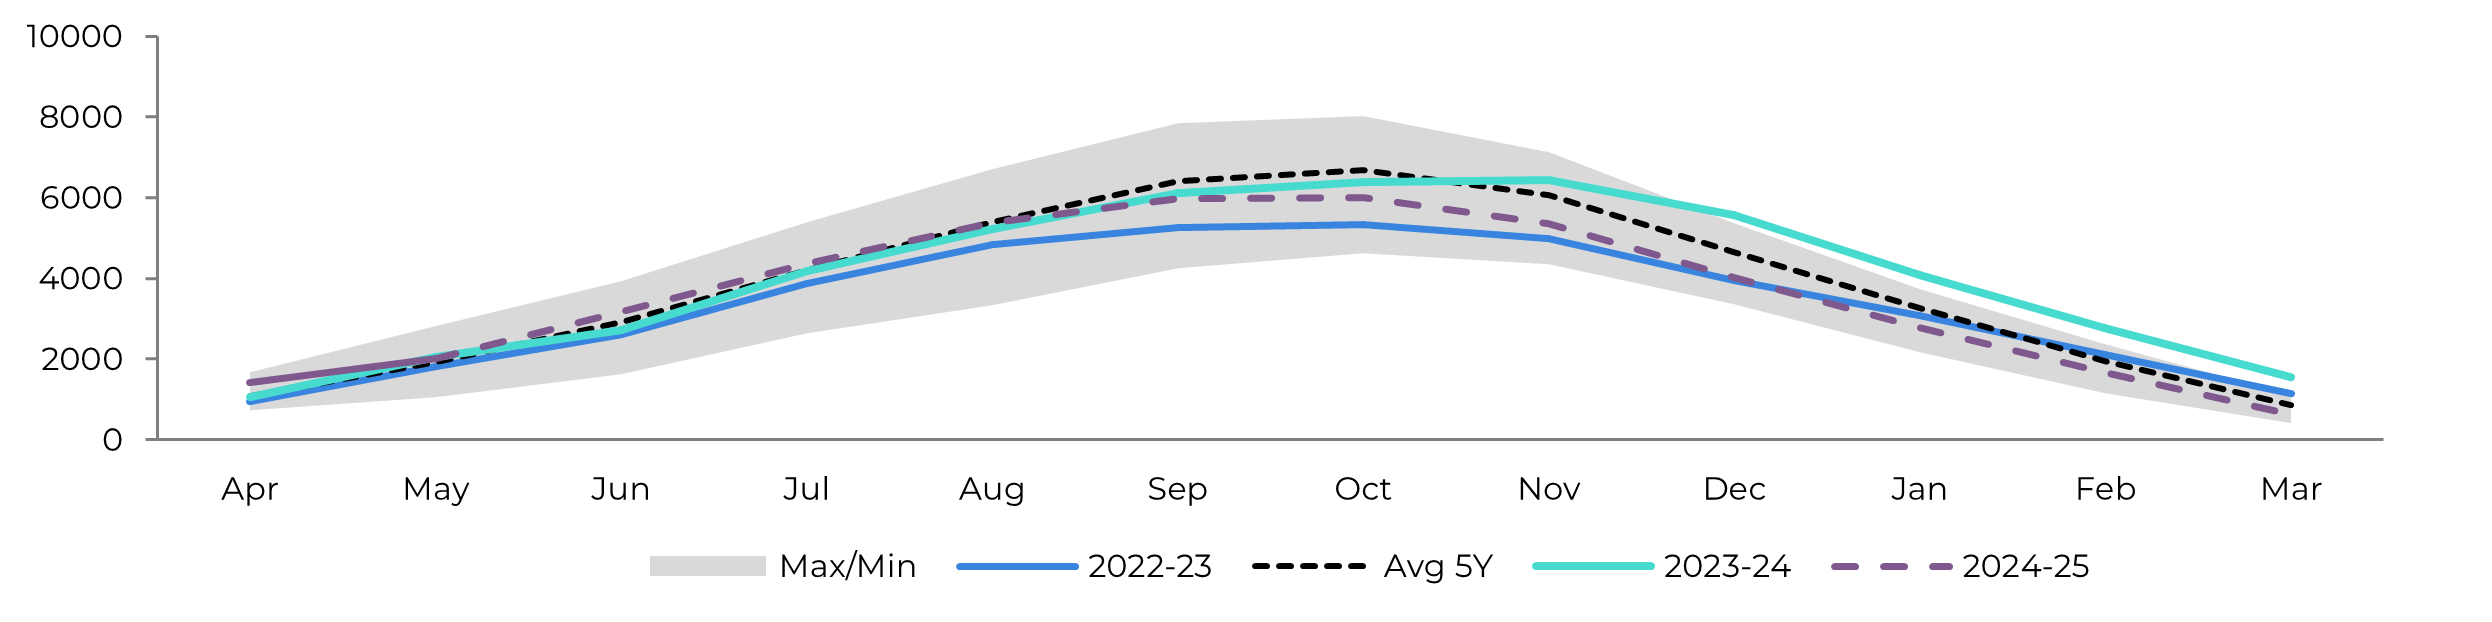
Image 2: Raw's Trade Flow ('000t)
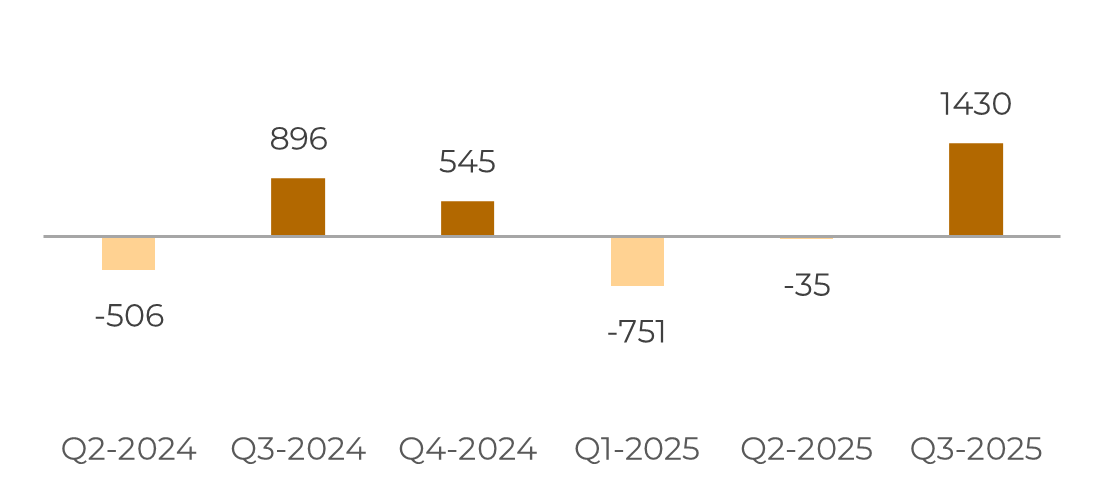
Source: Hedgepoint
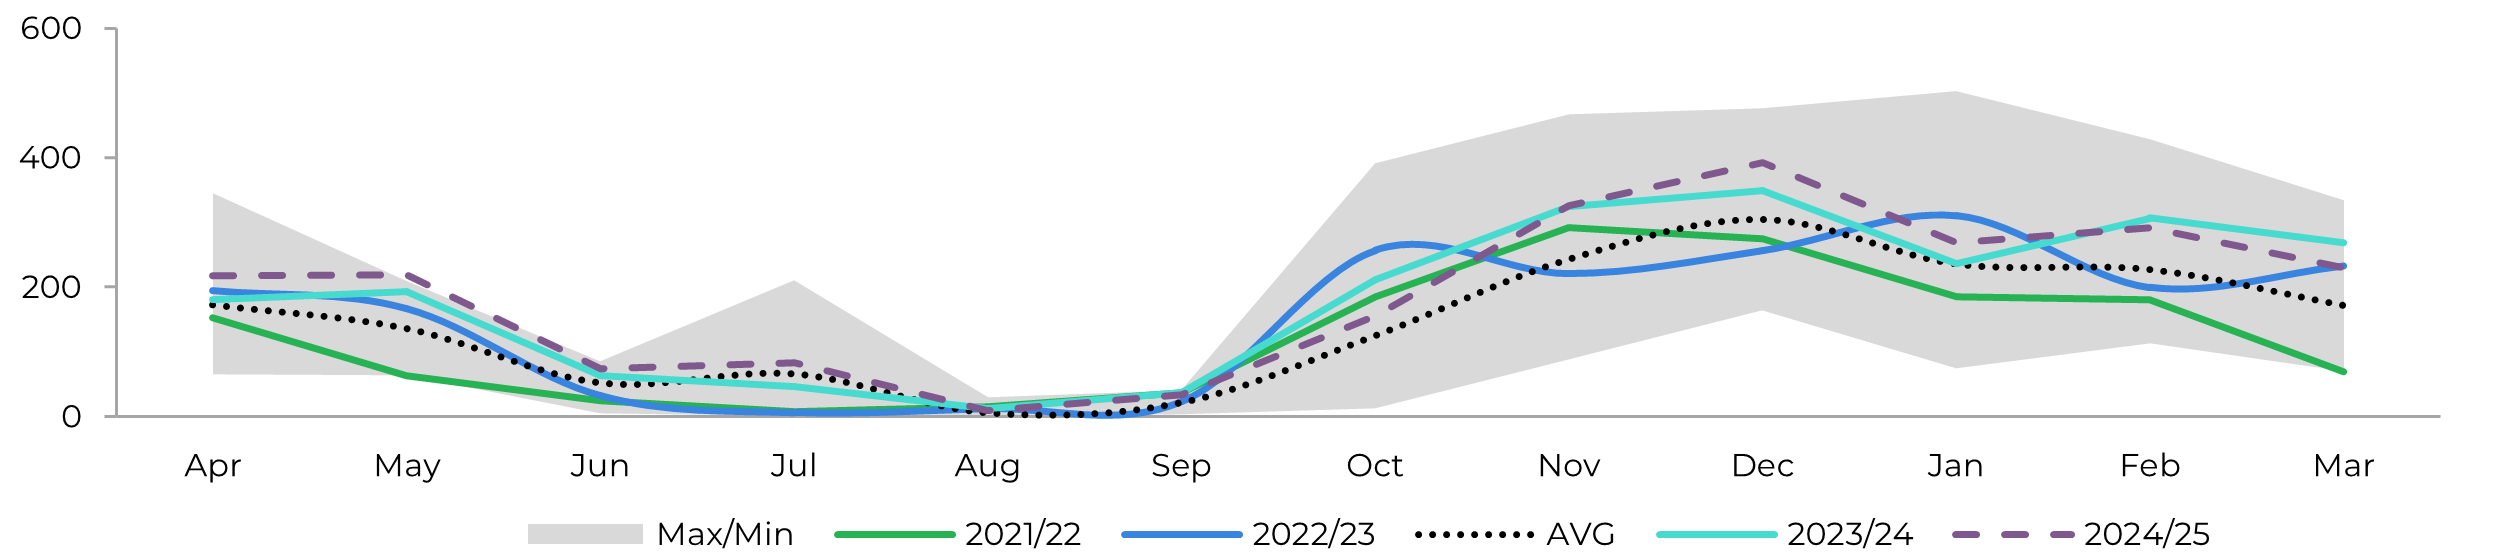
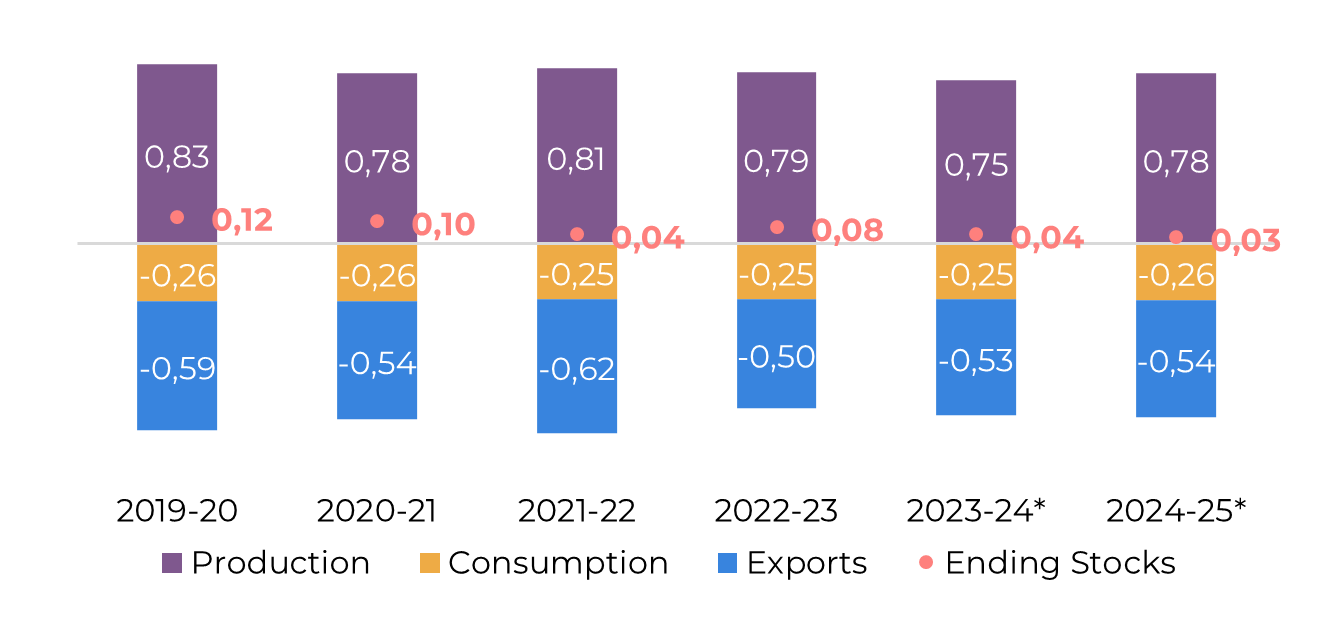
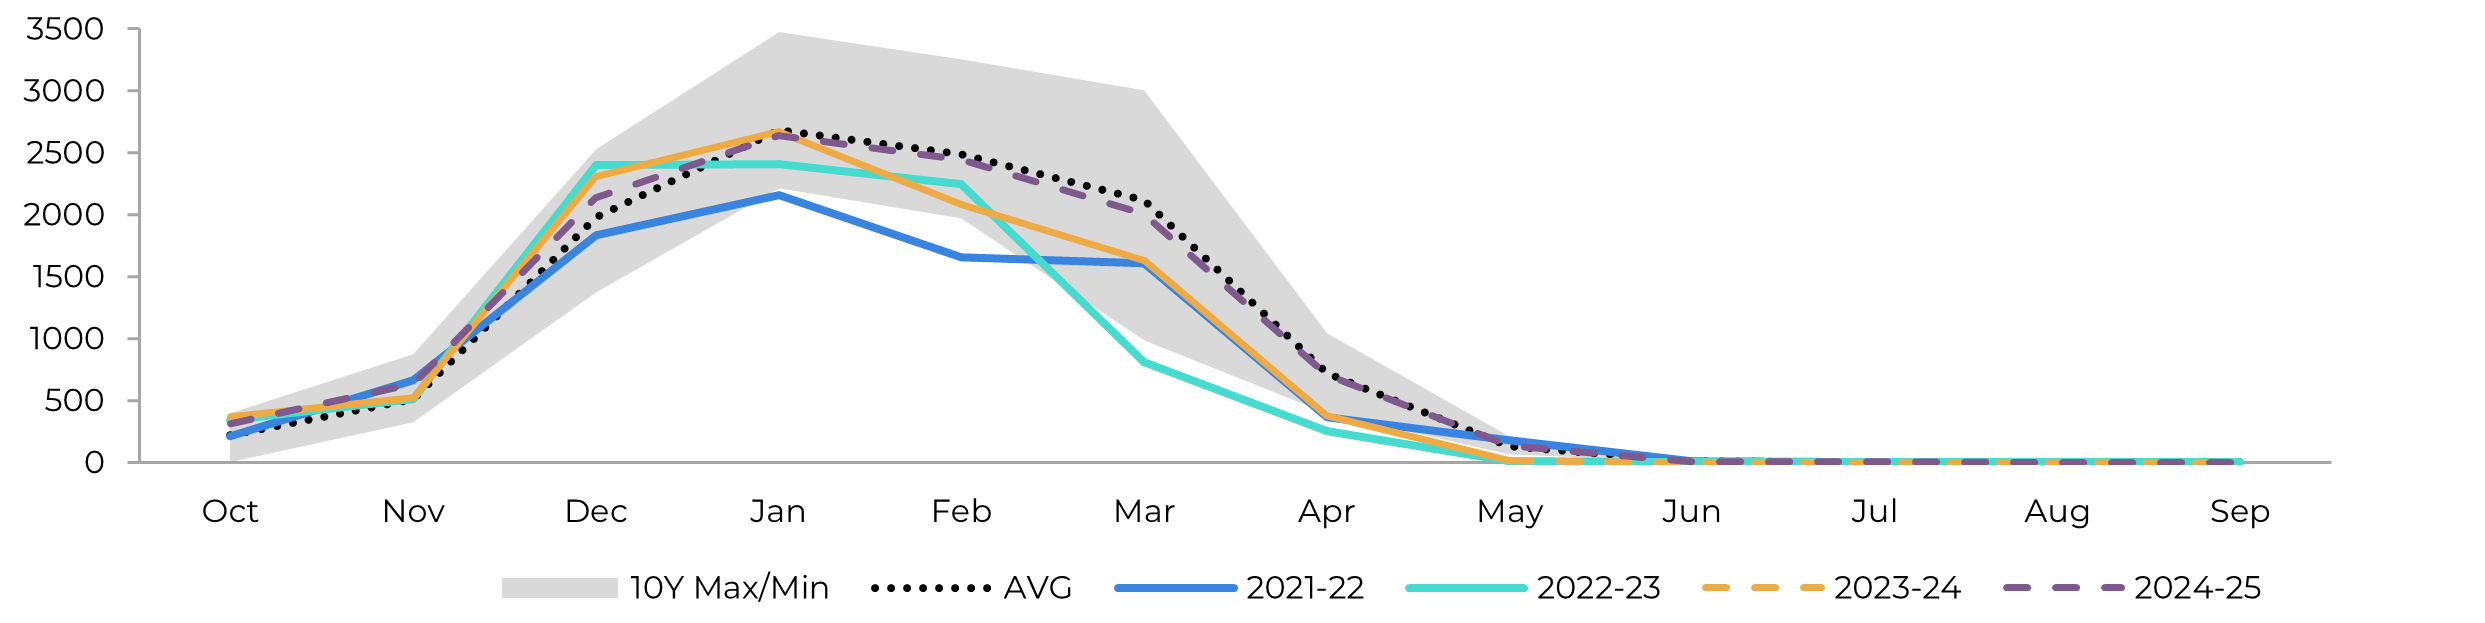
Image 3: White's Trade Flow ('000t)
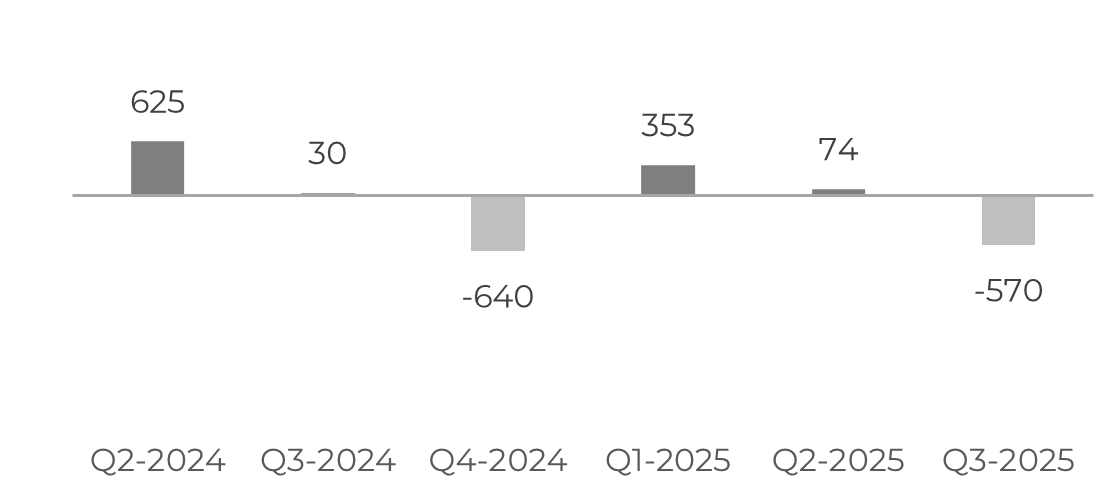
Source: Hedgepoint
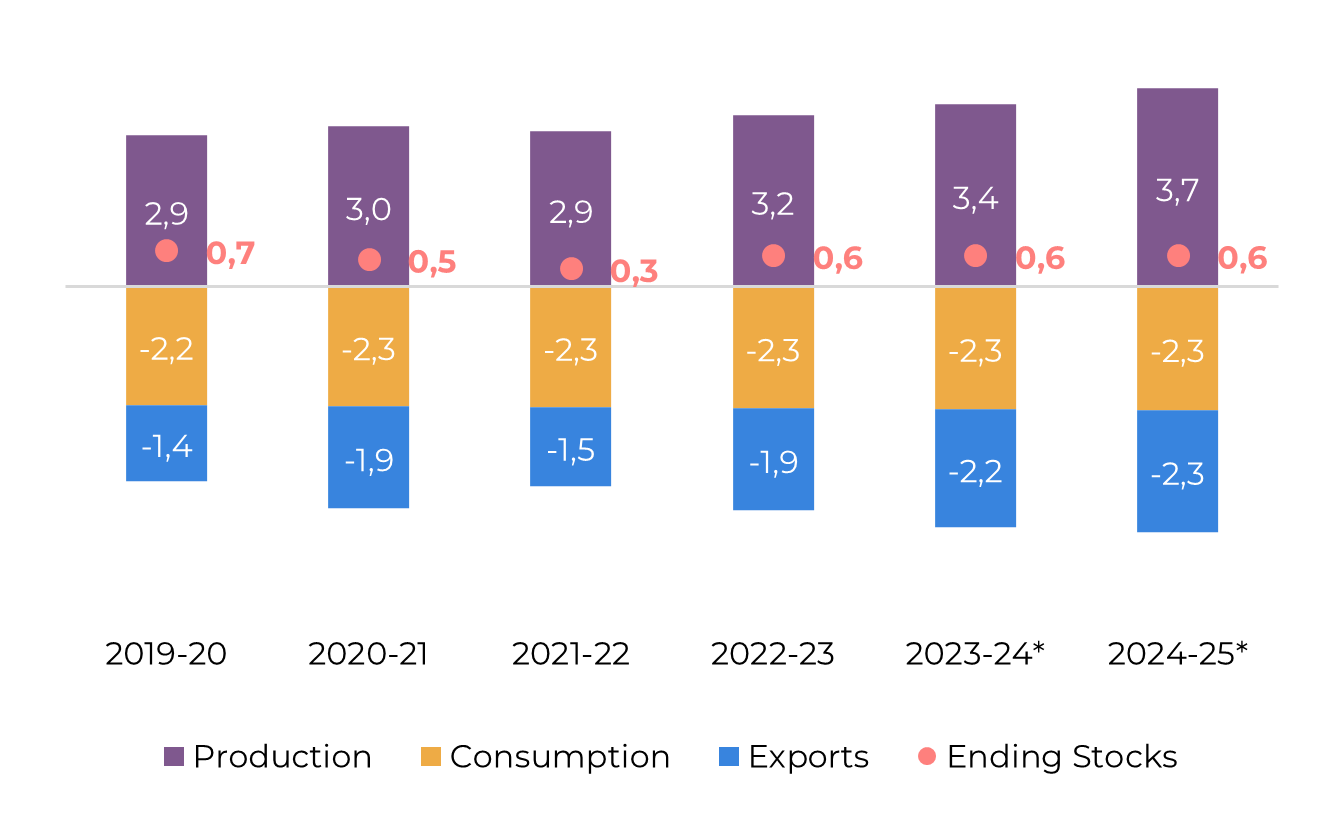
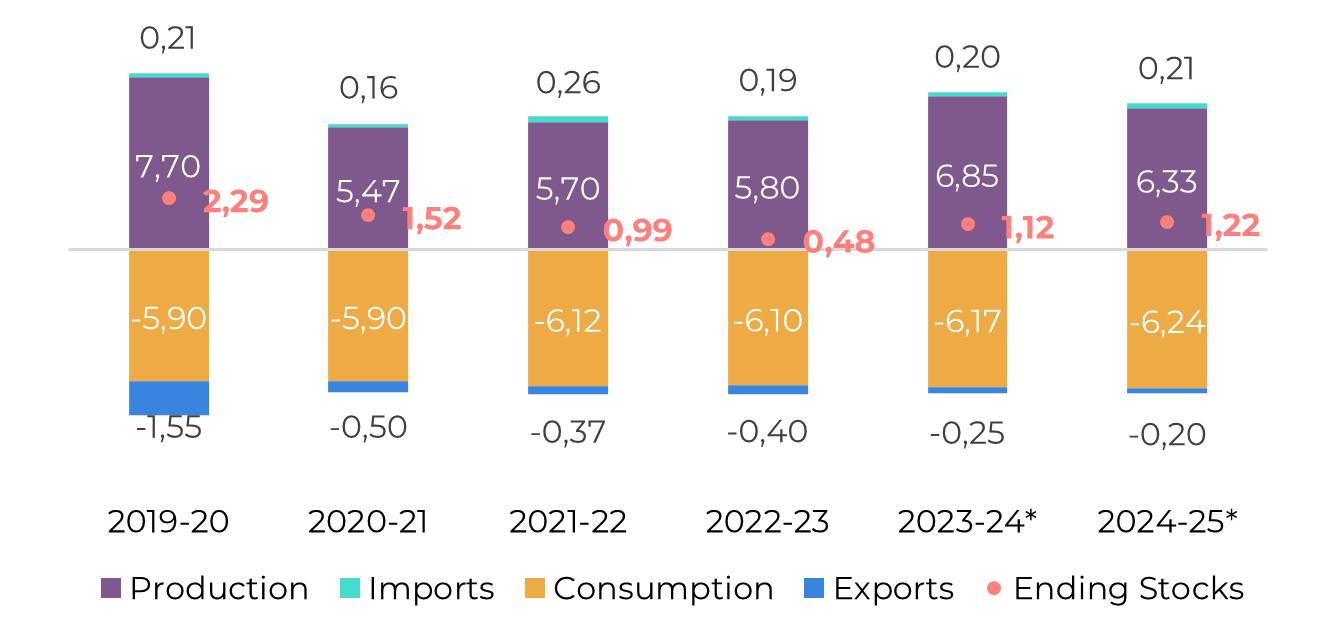
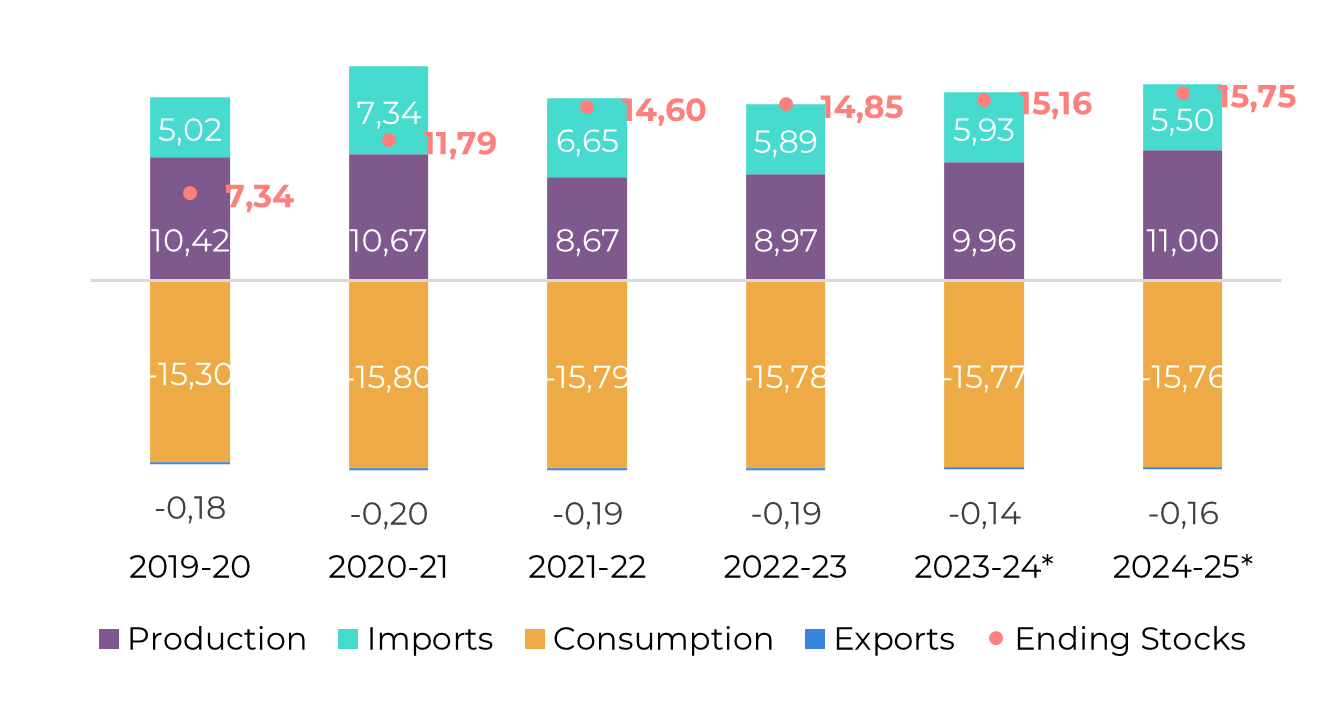
Image 4: Global Supply and Demand Balance (MT RV oct-sep)
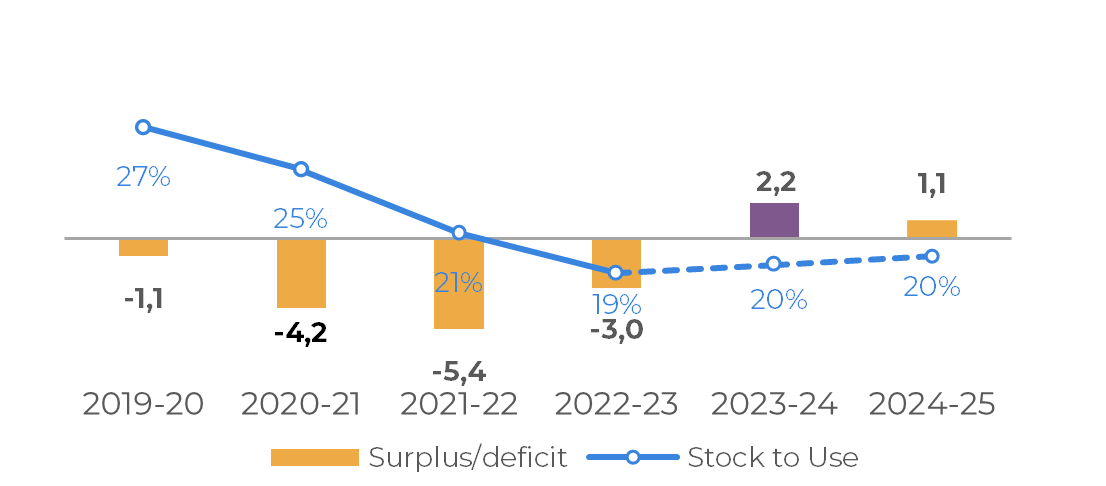
Source: Hedgepoint
Brazil CS
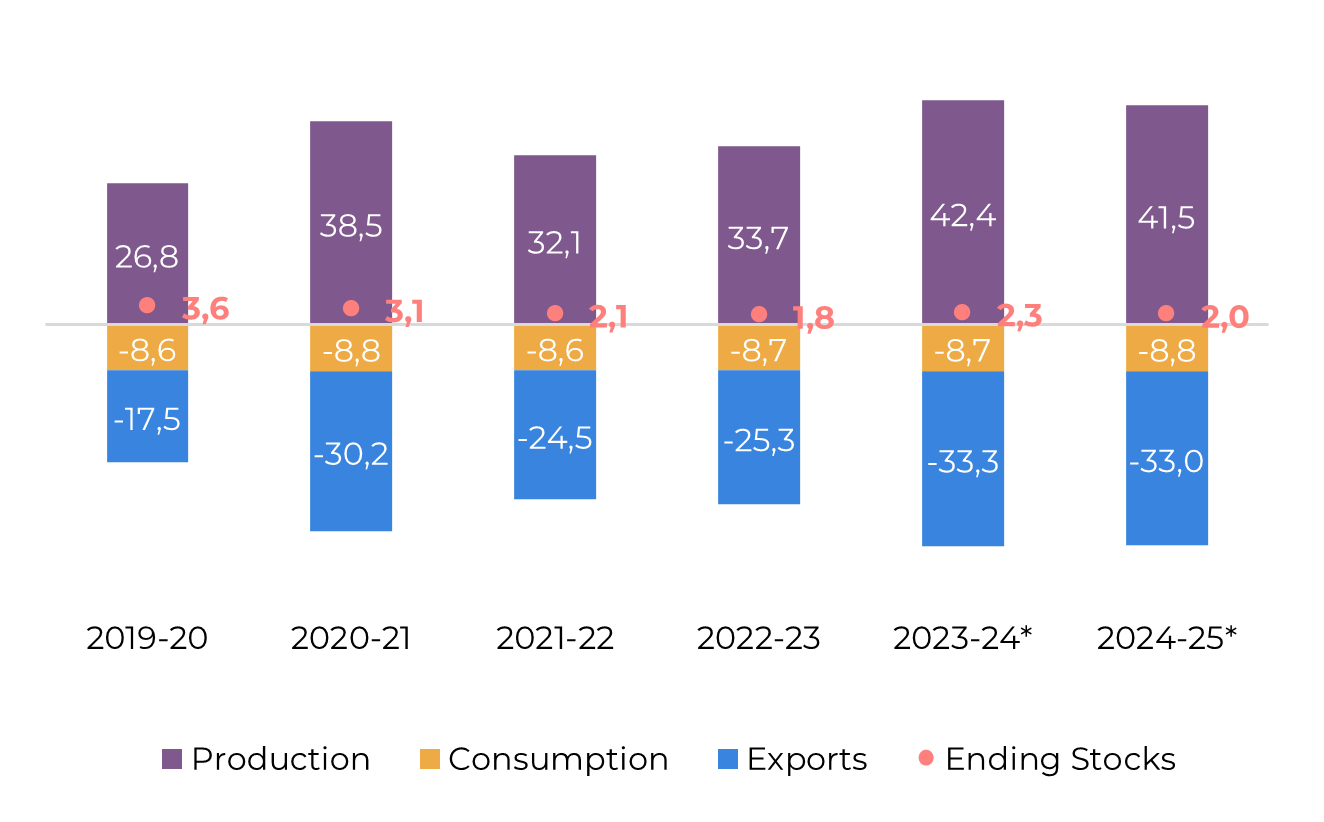
Image 5: Sugar Balance - Brazil CS (Apr-Mar Mt)
Source: Unica, MAPA, SECEX, Hedgepoint
The 2024/25 crop season in Center-South Brazil started robustly, with over 140 Mt of cane crushed between April and May. This volume is 11.2% higher than the previous season and only 3.2% lower than in 2020/21. Despite significant sugar production of over 7.8 Mt, the sugar mix has been surprisingly low compared to expectations. Unica attributes this to many mills processing leftover or underdeveloped cane, likely due to drier-than-average weather since early 2024. The poor quality of the cane is the primary reason for the lower-than-expected sugar mix. Additionally, some speculate that the newly installed crystallization investments might not yet be fully operational this season.
Nevertheless, Brazil is on track for its second-best result in recent history. Even with a nearly 10% drop in TCH, the expansion of the planting area is expected to yield at least 613 Mt of cane. Assuming similar TRS to the 2023/24 season and a reduced sugar mix of 51.2%, Center-South Brazil could still produce 41.5 Mt of sugar and contribute approximately 33 Mt to the international market, particularly during the crop peak in Q3 2024. Effective stock management could prevent the predicted deficit in Q4 2024 and Q1 2025.
Looking ahead to the 2025/26 season, there is some optimism for recovery. Much discussion has centered on weather patterns and the potential impact of La Niña. The latest NOAA report indicates a high probability of La Niña during the Brazilian summer, which could affect cane development. However, the probability has slightly decreased, and the expected intensity of the event has been downgraded. Therefore, it is still too early to predict significant disruptions to cane volume.
Image 6: Total Exports - Brazil CS ('000t)
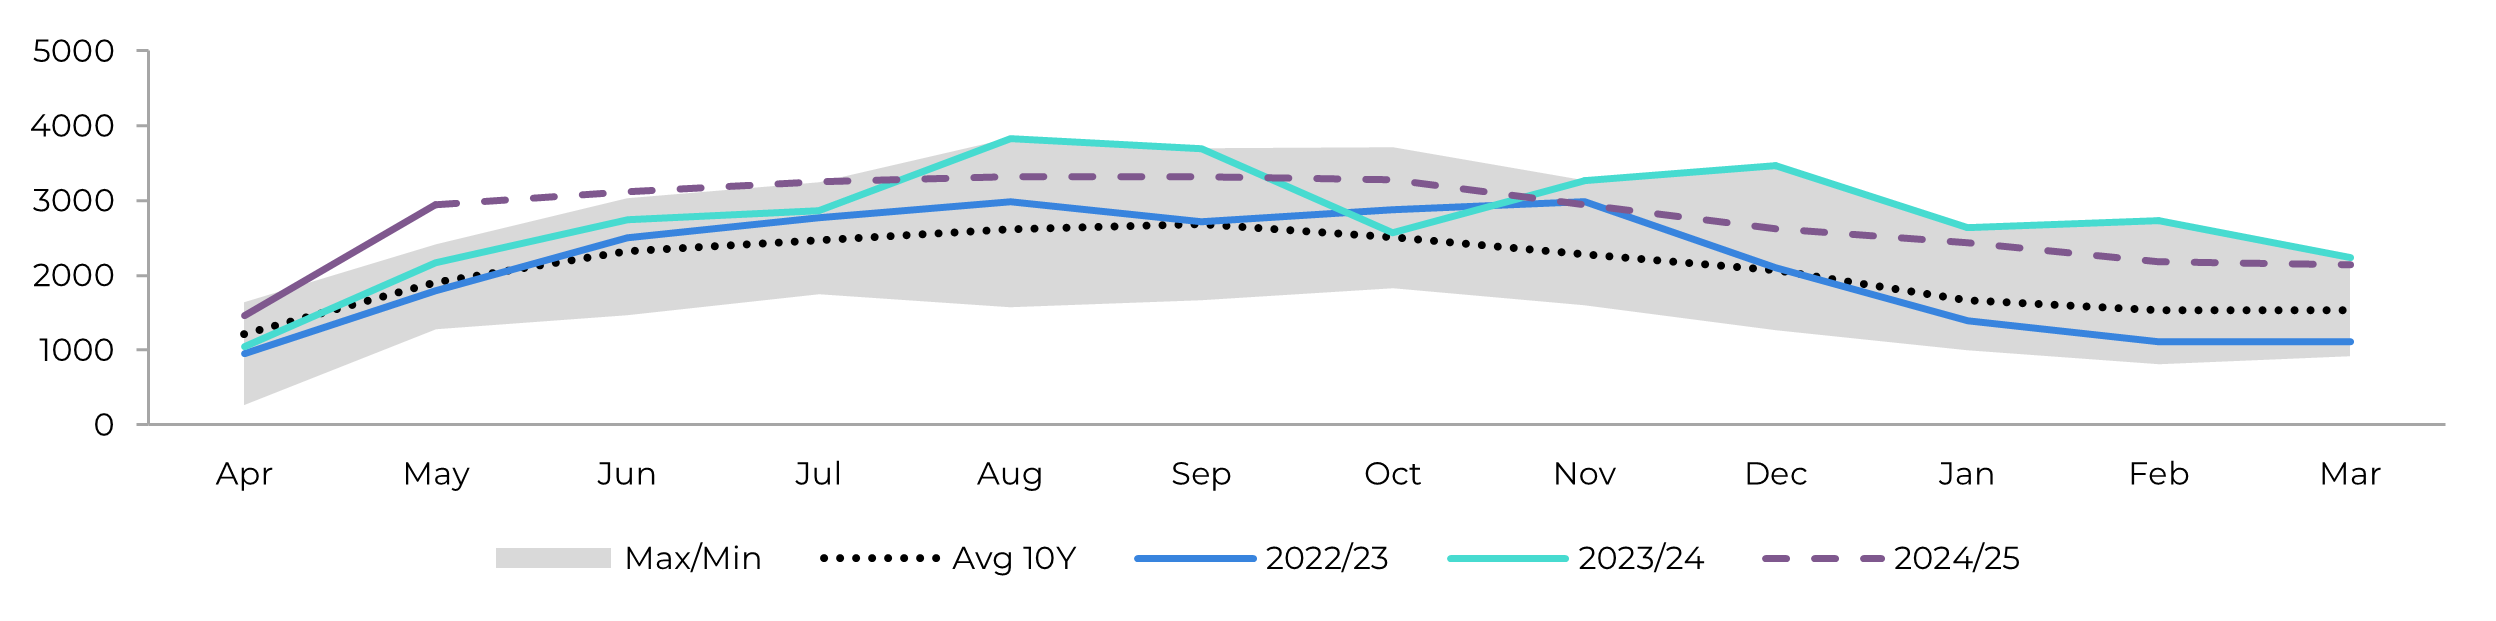
Image 7: Total Stocks - Brazil CS ('000t)
Source: SECEX, Williams, Hedgepoint
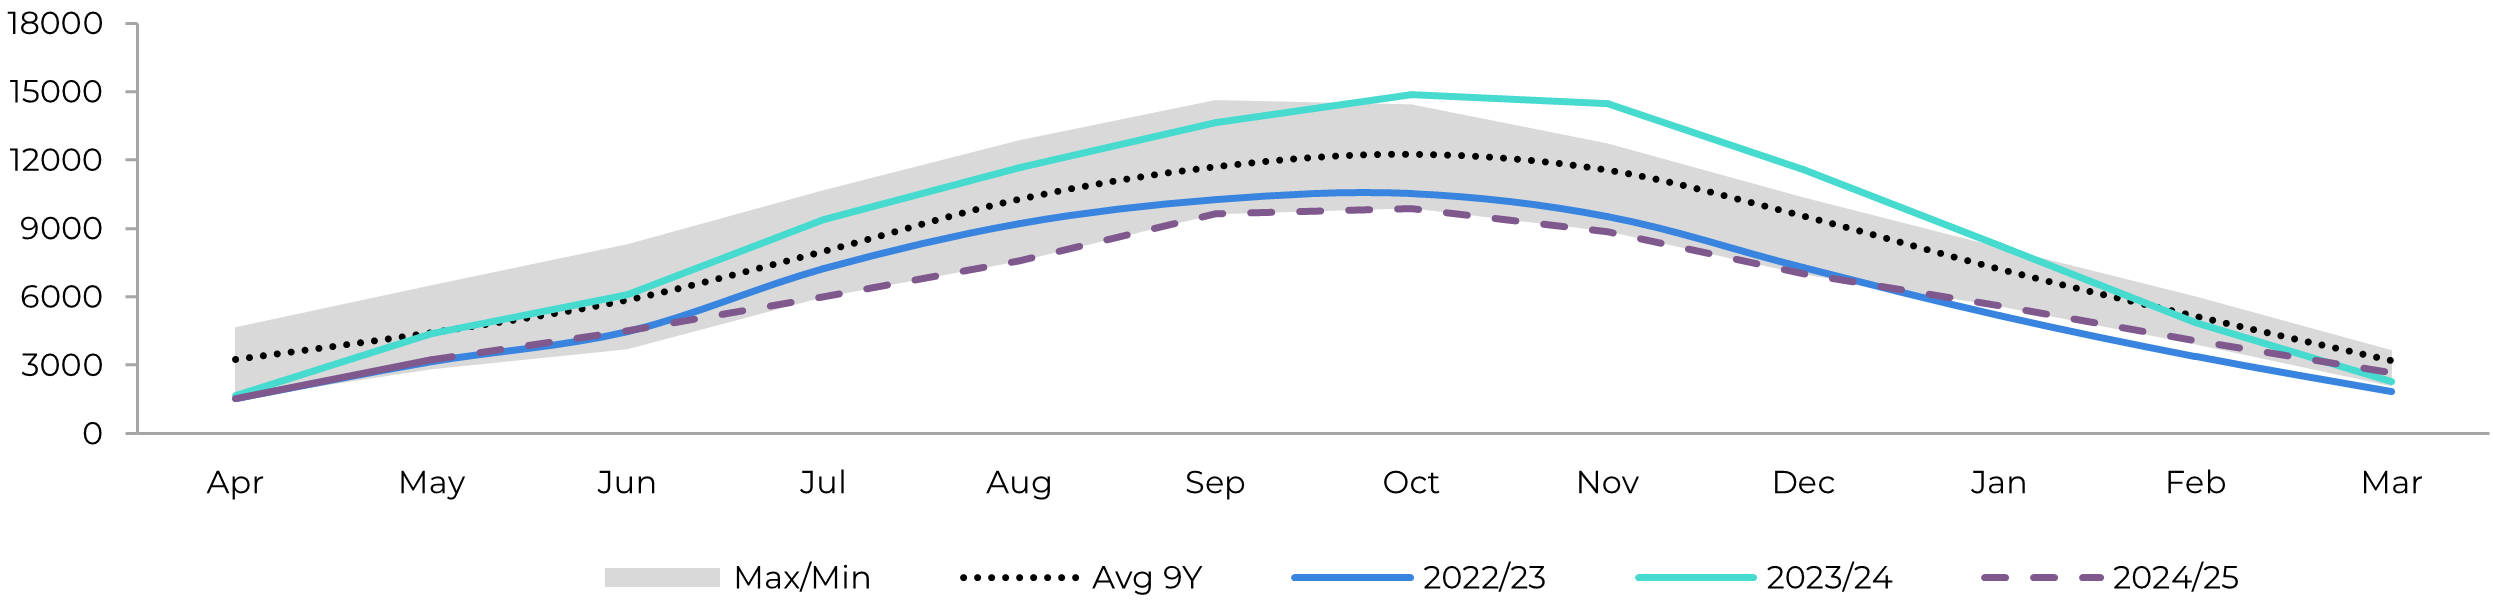
Source: Unica,MAPA, SECEX, Williams, Hedgepoint
Brazil CS Ethanol
Image 8: Otto Cycle - Brazil CS (M m³)
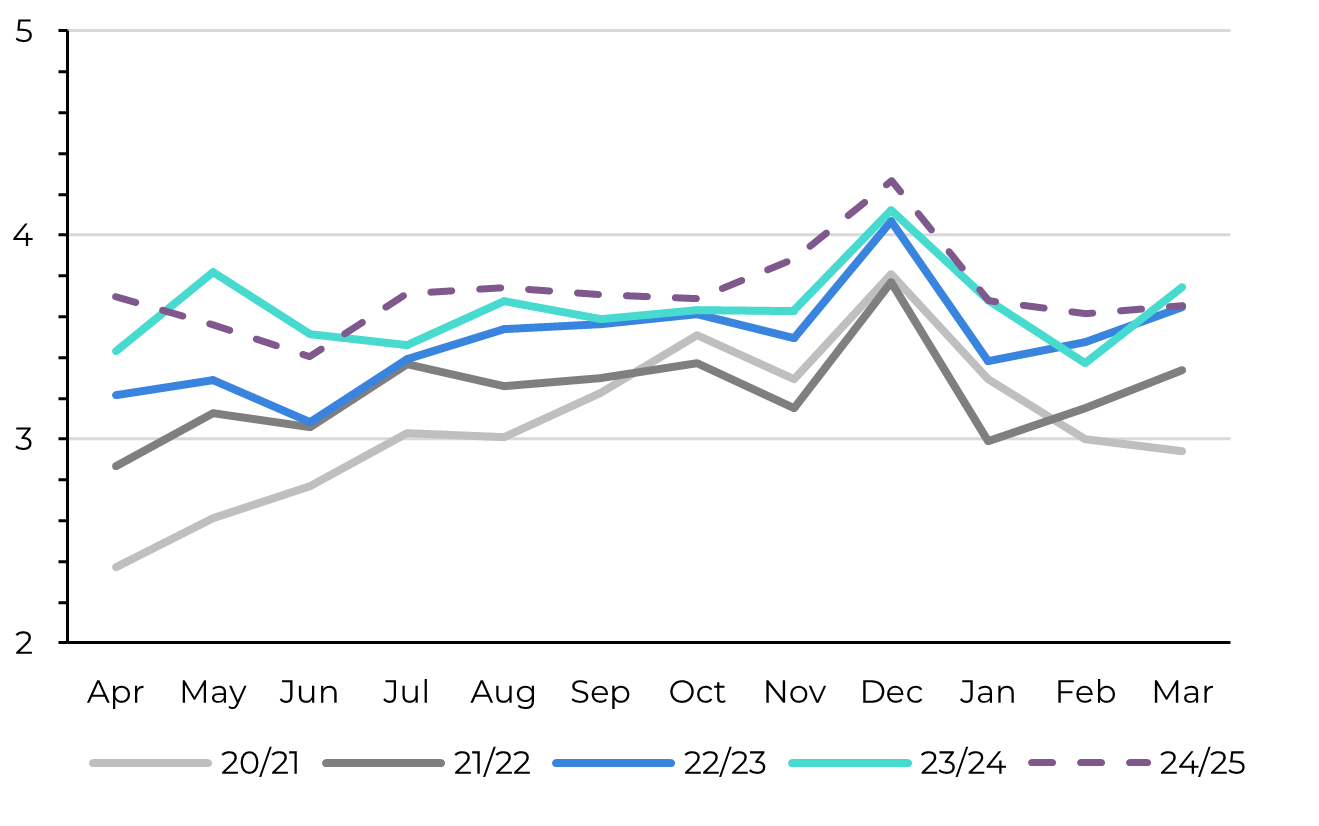
Source: ANP, Bloomberg, Hedgepoint
Fuel demand started strong in April, but what's truly impressive is that hydrous ethanol maintained its share of consumption as high as 38% (considering total volume and not Otto Cycle). This is due to its increased competitiveness at the pump. Domestic sales reached their highest level since 2019/20, totaling 3.7 billion liters by the end of May. This could have supported prices if not for the high end-of-season stock levels seen in 2023/24.
Image 9: Anhydrous Ending Stocks - Brazil CS ('000 m³)
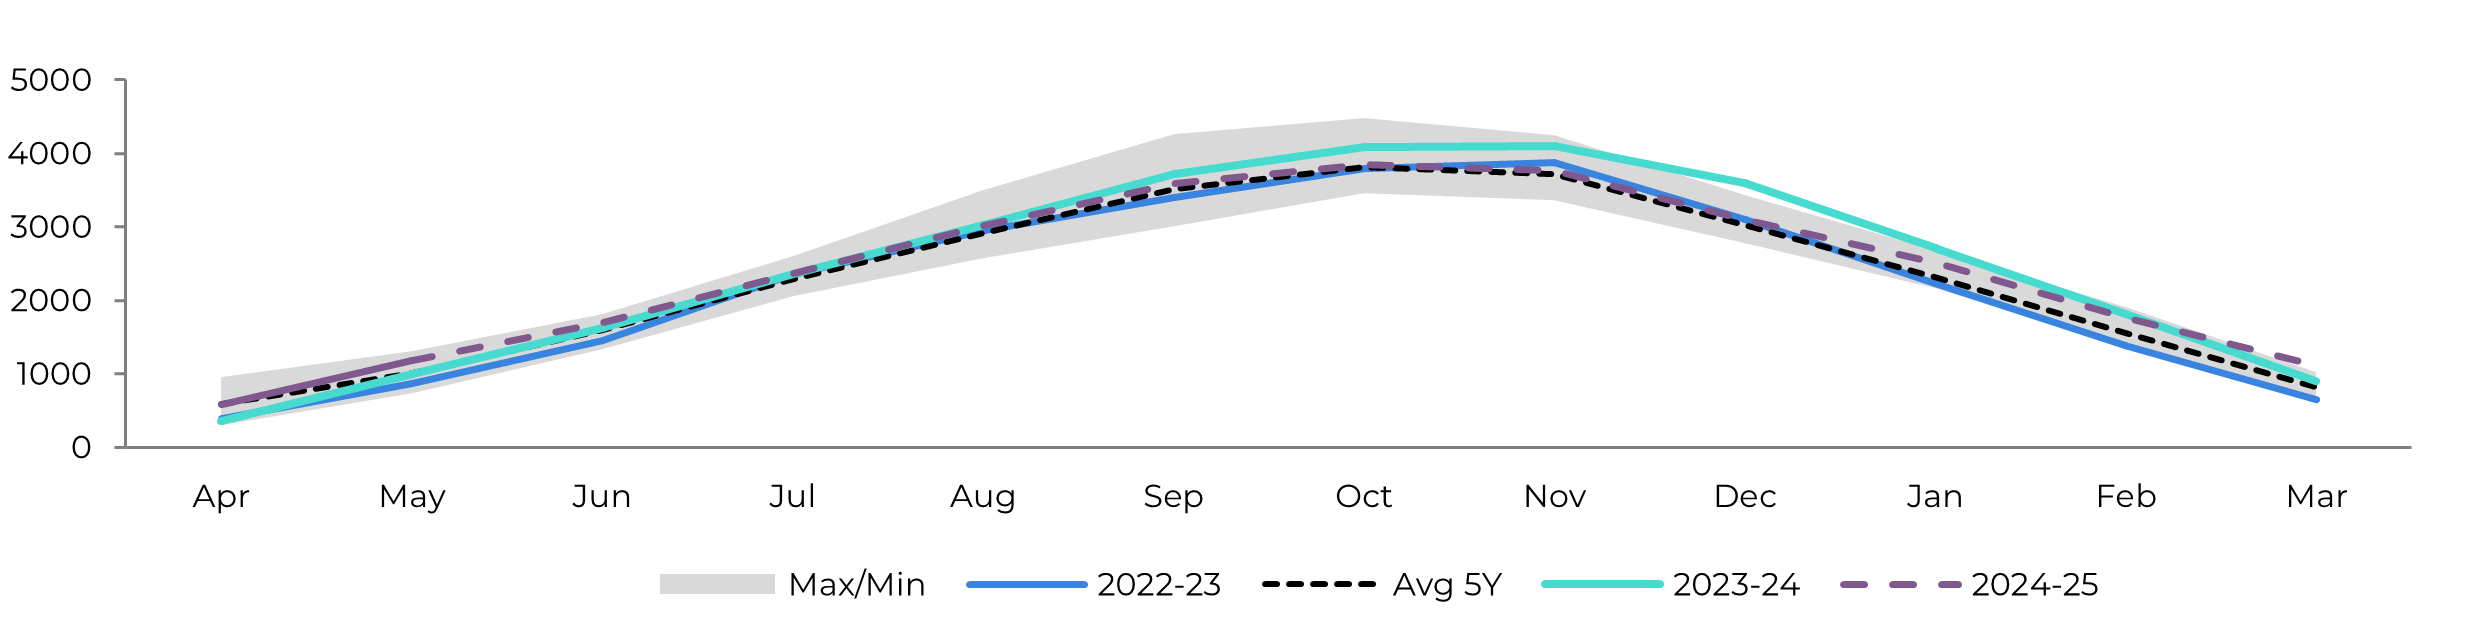
Image 10: Hydrous Ending Stocks - Brazil CS ('000 m³)
Source: Unica, MAPA, ANP, SECEX, Hedgepoint
Source: Unica, MAPA, ANP, SECEX, Hedgepoint
Brazil NNE
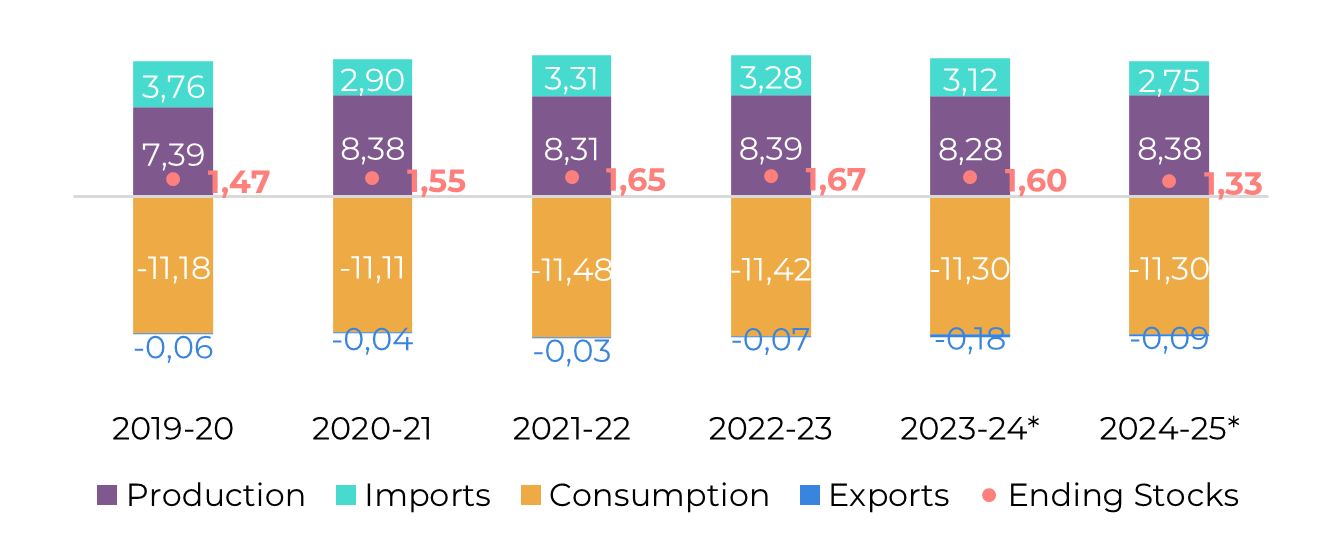
Image 11: Sugar Balance - Brazil NNE (Apr-Mar Mt)
Source: MAPA, SECEX, Hedgepoint
Weather in the North and Northeast is expected to benefit cane development. Specialized agencies predict that the coming months will be rainier and warmer than usual. Therefore, the Brazilian winter could aid end-of-season cane growth but might disrupt crushing in June and July.
Despite this, there is room for optimism about cane availability. We maintain our figures: 63 Mt to be crushed, 127 kg/t (potentially lower if wet weather persists), and a 49% sugar mix, leading to over 3.7 Mt of sugar being produced in the region.
Image 12: Total Exports - Brazil NNE ('000t)
Source: SECEX, Hedgepoint
India
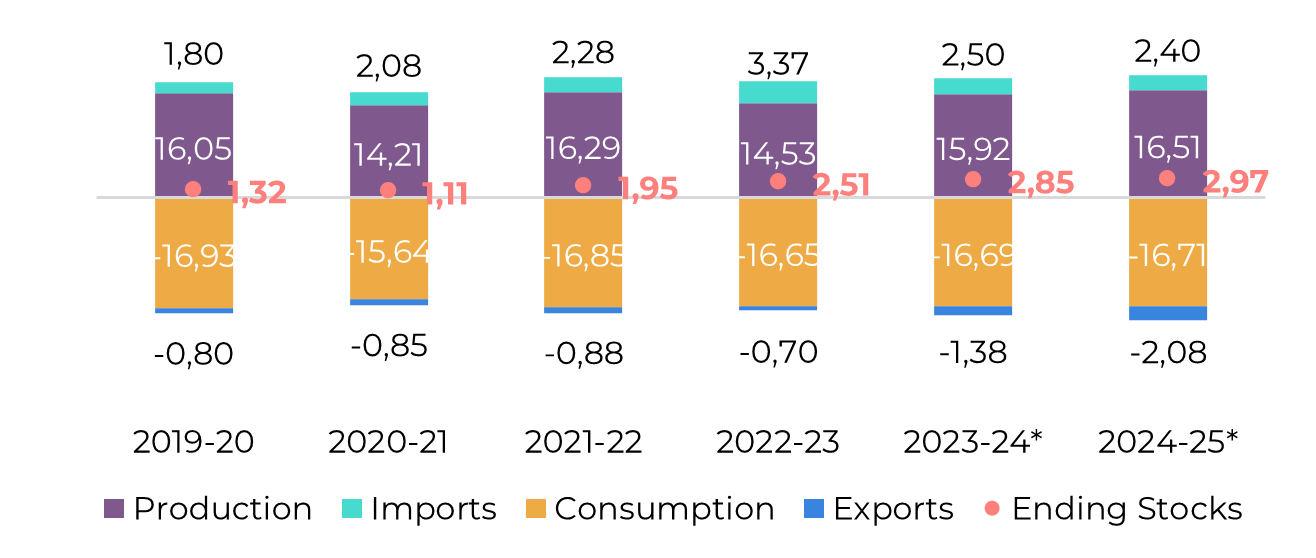
Image 13: Sugar Balance - India (Oct-Sep Mt)
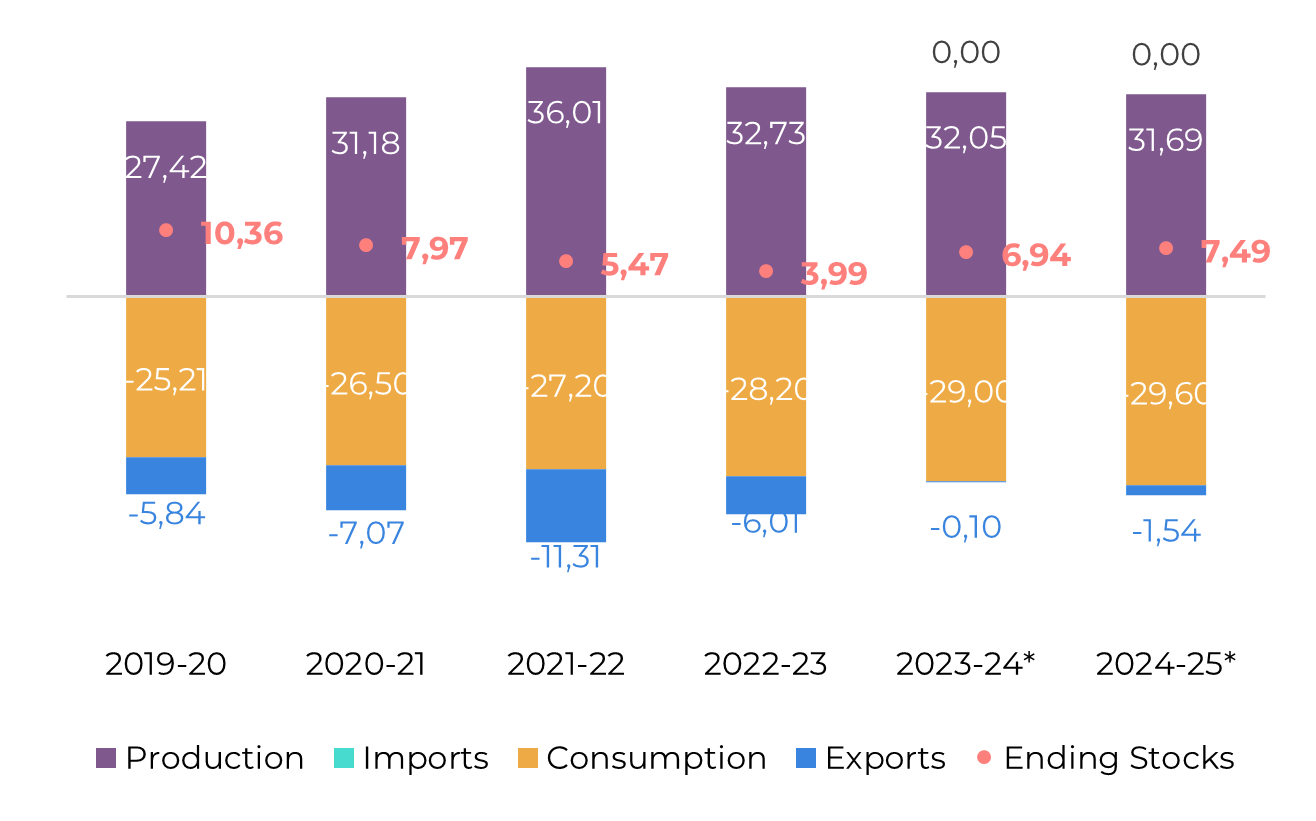
Source: ISMA,AISTA, Hedgepoint
With 31.67 million tons of sugar produced by May 31st and only three mills still operating, India's 2023/24 season is close to its end. According to the National Federation of Cooperative Sugar Factories Limited (NFCSF), total availability should reach 32.1 Mt, just 3.8% lower than the 2022/23 season. This volume is significantly higher than initial estimates by many agencies, which were below 29 Mt. We had maintained our figures at 31.8 million tons for a long time but now feel compelled to revise and update them to 32 Mt.
Considering that sugar remains the most lucrative crop for the average farmer, a sharp drop in the area seems unlikely. Therefore, we remain skeptical and have a higher gross production expectation. With a marginal 2% drop in the area but a recovery in cane yield due to favorable weather, we expect total production to reach 37.2 Mt. With 5.5 Mt being diverted to the ethanol program, which should be the government's priority, sugar production would reach 31.7 Mt, a healthy result.
With this availability, India can replenish stocks to a three-month consumption level and still allow for 1.5 Mt of exports. However, the latter depends on price dynamics and government quota releases.
In terms of prices, one might expect that the current export parity estimated at 21.5 cents per pound, considering domestic prices, would correct marginally once the country starts crushing and restocking, meaning prices wouldn't need to be that high to attract Indian mills. However, if domestic prices remain resilient, that level could be the upside needed for Indian exports. Currently, our 2025 surplus accounts for the 1.5 million tons of sugar from India, and, therefore, a slight upside during Brazilian intercrop.
Image 14: Total Domestic Exports - India ('000t w/o tolling)
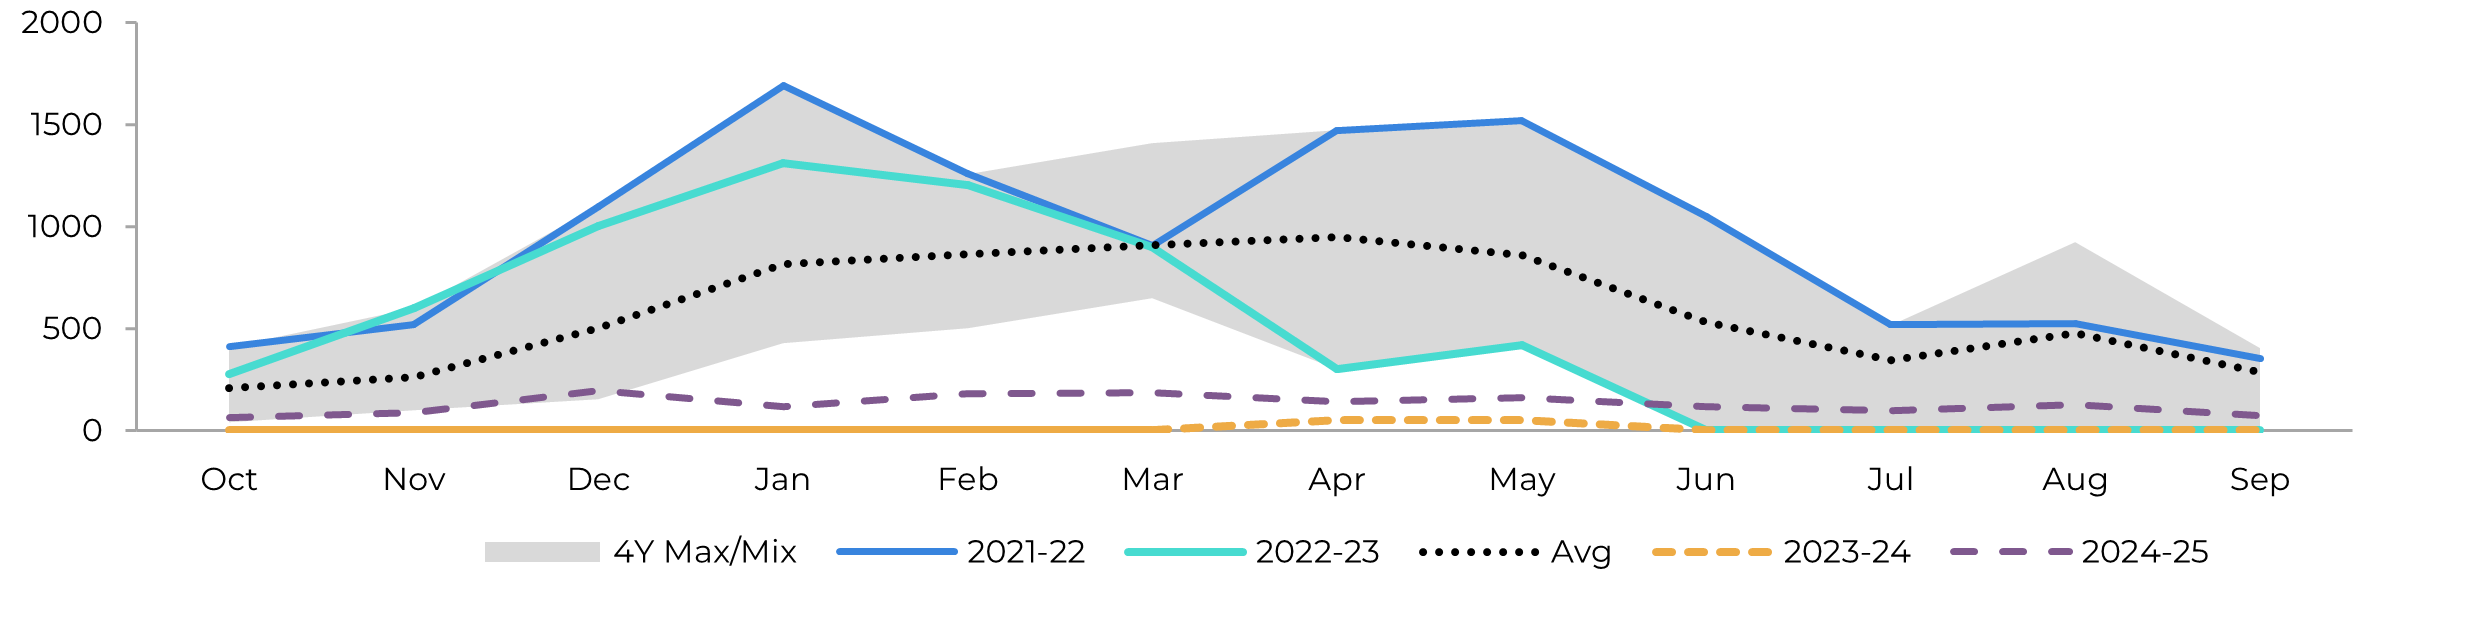
Source: ISMA,AISTA, Hedgepoint
Thailand
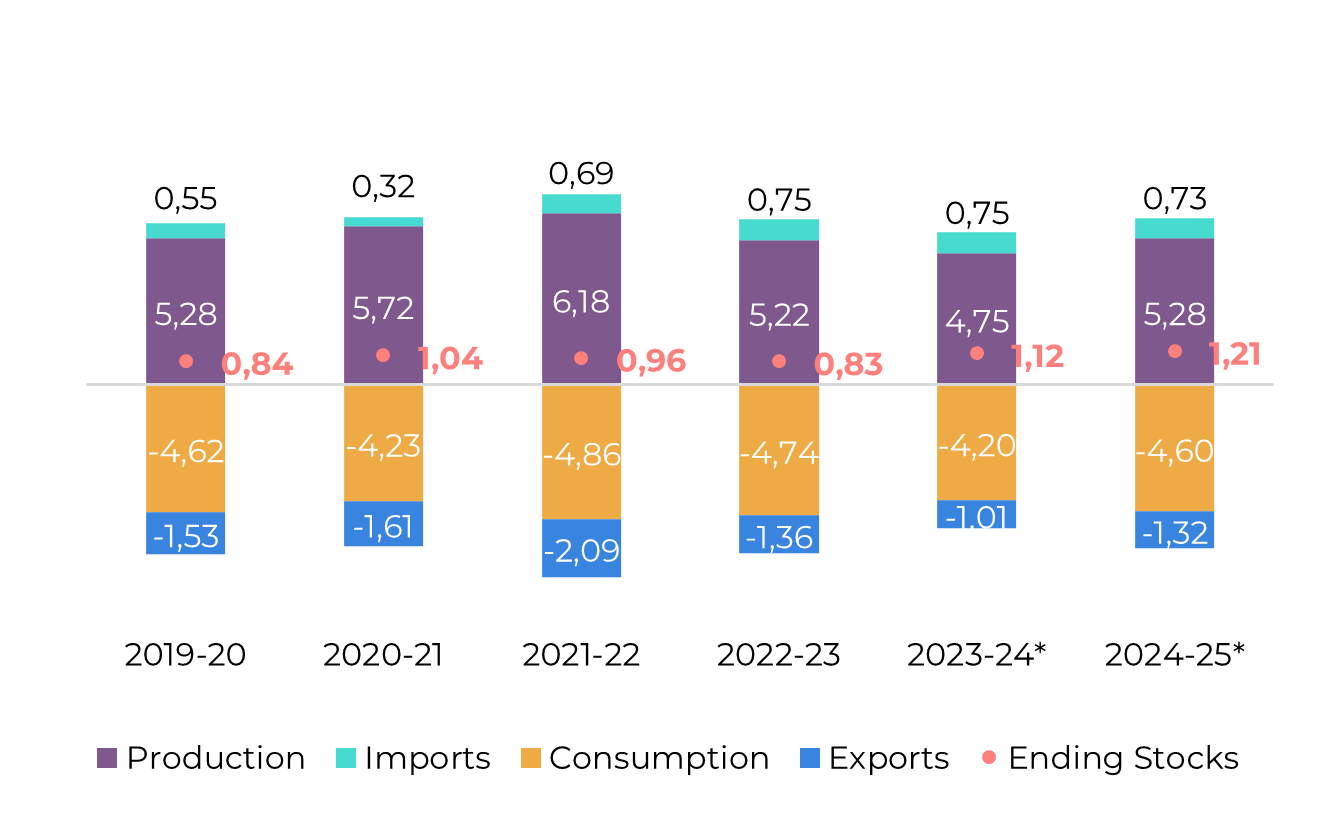
Image 15: Sugar Balance - Thailand (Dec-Nov Mt)
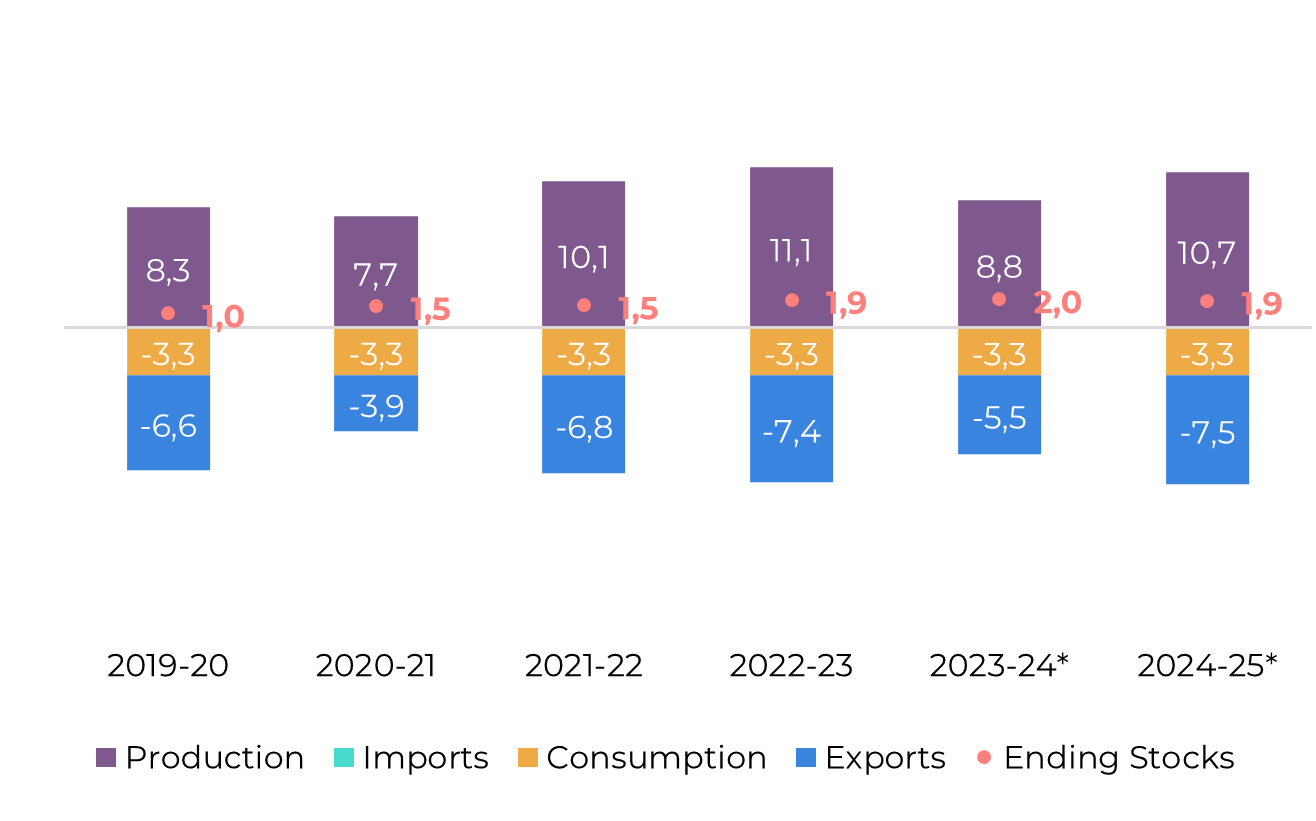
Source: Thai Sgar Millers, Sugarzone, Hedgepoint
Although precipitation in cane areas during May was confirmed to be below average, this period is not crucial for cane development. The Thai Meteorological Department anticipates a healthy amount of rainfall in June and July, which is a much more important development window and reinforces the recovery expected in the 2024/25 season.
Considering these favorable weather conditions along with the final results of the 2023/24 season and sustained competitive prices for sugarcane, we have revised our cane availability estimate upwards from 98 Mt to 100 Mt for the 2024/25 season. This adjustment results in an estimated sugar production of 10.70 Mt, a 200 kt increase from our previous figure. It's important to note that this projection remains below the 11 Mt achieved in the 2022/2023 season, despite a capacity for 14 Mt. Additionally, this estimate still depends on weather developments during the main development period from June to September.
With higher production, we can also expect greater participation in trade flows. For the 2023/24 season, we have kept our figures unchanged at 5.5 Mt. However, for the next season, the country could reach 7.5 Mt. The inverted curve to H25 might result in seasonality patterns very similar to those of the 2022/23 season.
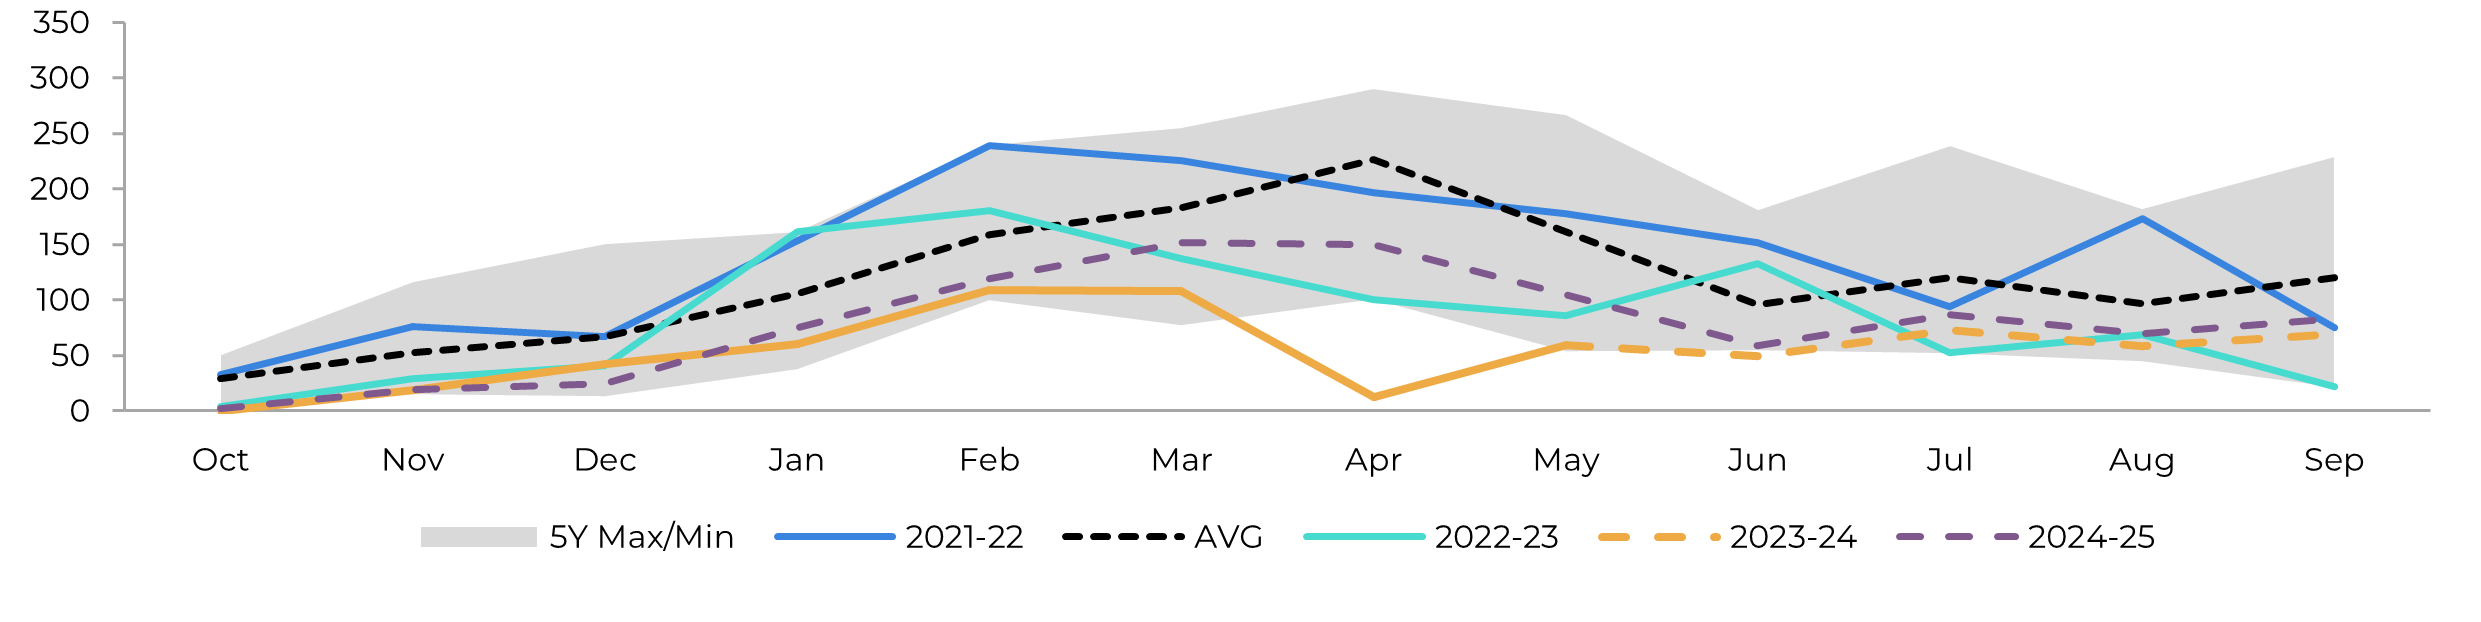
Image 16: Total Exports - Thailand ('000t)
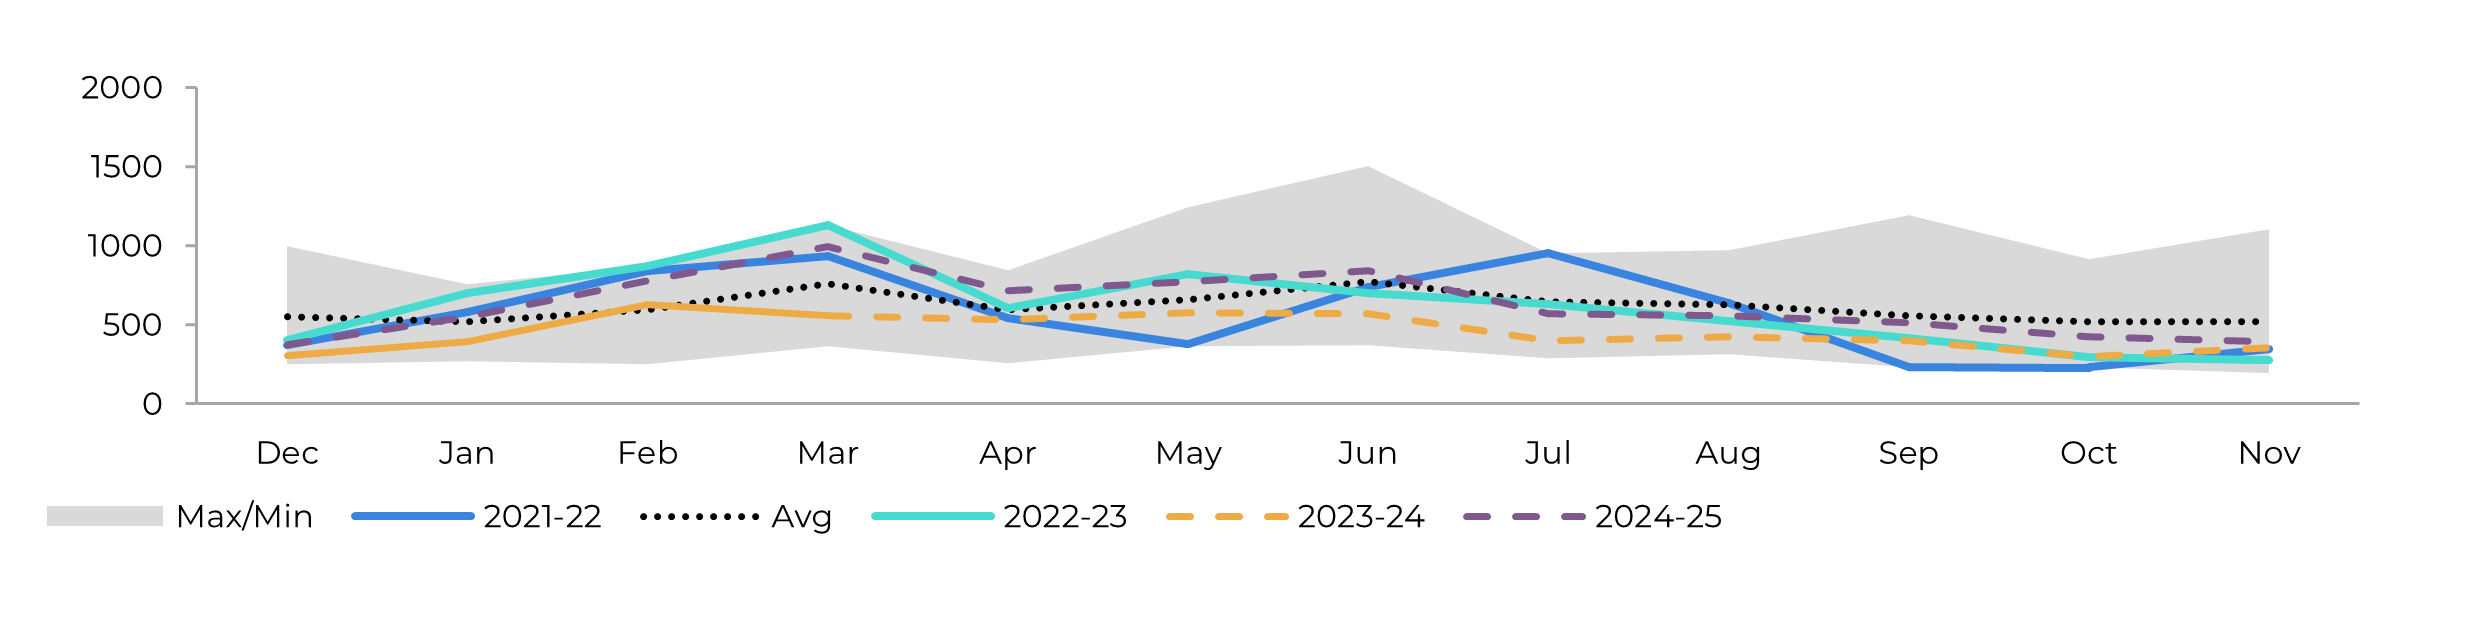
Source: Thai Sgar Millers, Hedgepoint
EU 27+UK
Image 17: Sugar Balance - EU 27+UK (Oct-Sep Mt)
Source: EC, Greenpool, Hedgepoint
Regarding the EU and UK, little has changed fundamentally, but our figures have been adjusted due to how we were accounting for the UK.
Mexico
Image 18: Sugar Balance - Mexico (Oct-Sep Mt)
Source: Conadesuca, Greenpool, Hedgepoint
Crop estimates for the 2023/2024 season remain unchanged, indicating an anticipated sharp decline due to adverse weather conditions affecting cane development. With only 4.7 Mt of sugar, export availability has also diminished. The country has crushed 45.8 million tons of cane, falling short of Conadesuca's estimate and generating a lower sugar output — 4.68Mt compared to the expected 4.75 Mt and 5.2 Mt from the previous year. With only three mills still operating, there is a possibility of reaching the 4.75 Mt expectation. However, we have slightly reduced our export estimate to 1 Mt, as poor results in April and May suggested our earlier figures were overly optimistic.
For the 2024/2025 season, Conagua expects wetter-than-average weather, which could benefit cane development, especially in June and July. Although excess rain can cause some damage, higher precipitation is welcomed after an extremely dry period. Therefore, we can expect cane volume and sugar production to recover in 2024/25, leading to higher sugar availability and diversified suppliers.
Image 19: Total Exports - Mexico ('000t)
Source: Conadesuca, Greenpool, Hedgepoint
USA
Image 20: Sugar Balance - US (Oct-Sep Mt)
Source: USDA, Hedgepoint
In the June World Agricultural Supply and Demand Estimates (WASDE), U.S. sugar production forecasts for the 2023/24 and 2024/25 seasons were slightly lowered compared to the previous month. This adjustment reflects decreased production of beet sugar and Florida cane sugar, respectively.
Alongside these marginal changes, the agency continued its trend of reducing imports from Mexico and increasing the "high-tier tariff/other" category for the 2023/24 crop season. However, with Mexico's expected recovery, we could expect a different trend in 2024/25. However, WASDE also decreased the anticipated volume of imports from Mexico for the upcoming season and increased the tariff rate quota (TRQ).
Guatemala
Image 21: Sugar Balance - Guatemala (Oct-Sep Mt)
Source: Cengicaña, Sieca, Azucar.gt,Greenpool, Hedgepoint
Looking ahead to the 2024/25 season, current weather forecasts indicate Guatemala will maintain a similar production level, but increased stocks suggest higher export potential.
Image 22: Total Exports - Guatemala ('000t)
Source: Sieca, Hedgepoint
El Salvador
Image 23: Sugar Balance - El Salvador (Mt Oct-Sep)
Source: Consaa, Sieca, Greenpool,Hedgepoint
Between Nicaragua, Guatemala, and El Salvador, the latter recorded the worst year-over-year result. Producing only 754 kt, the country faced a 4% drop compared to 2022/23. For the 2024/25 season, current weather predictions suggest a recovery for El Salvador. The country could return to the 780 kt level next year, maintaining stable exports. However, this remains approximately 50 kt lower than its capacity reached in 2019/2020.
Russia
Image 24: Sugar Balance - Russia (Mt Sep-Aug)
Source: Ikar, Sugar.ru, Greenpool, Hedgepoint
Thus, while our estimates remain unchanged, it's important to acknowledge the weather as a risk factor, with a downward trend anticipated.
China
Image 25: Sugar Balance - China (Oct-Sep Mt)
Source: GSMN, CSA, Refinitiv, Greenpool, Hedgepoint
Obs: stocks also account for bonded warehouses volume and imports include syrup and smuggling estimates
Image 26: Total Imports - China ('000t - exc. syrup and smuggling)
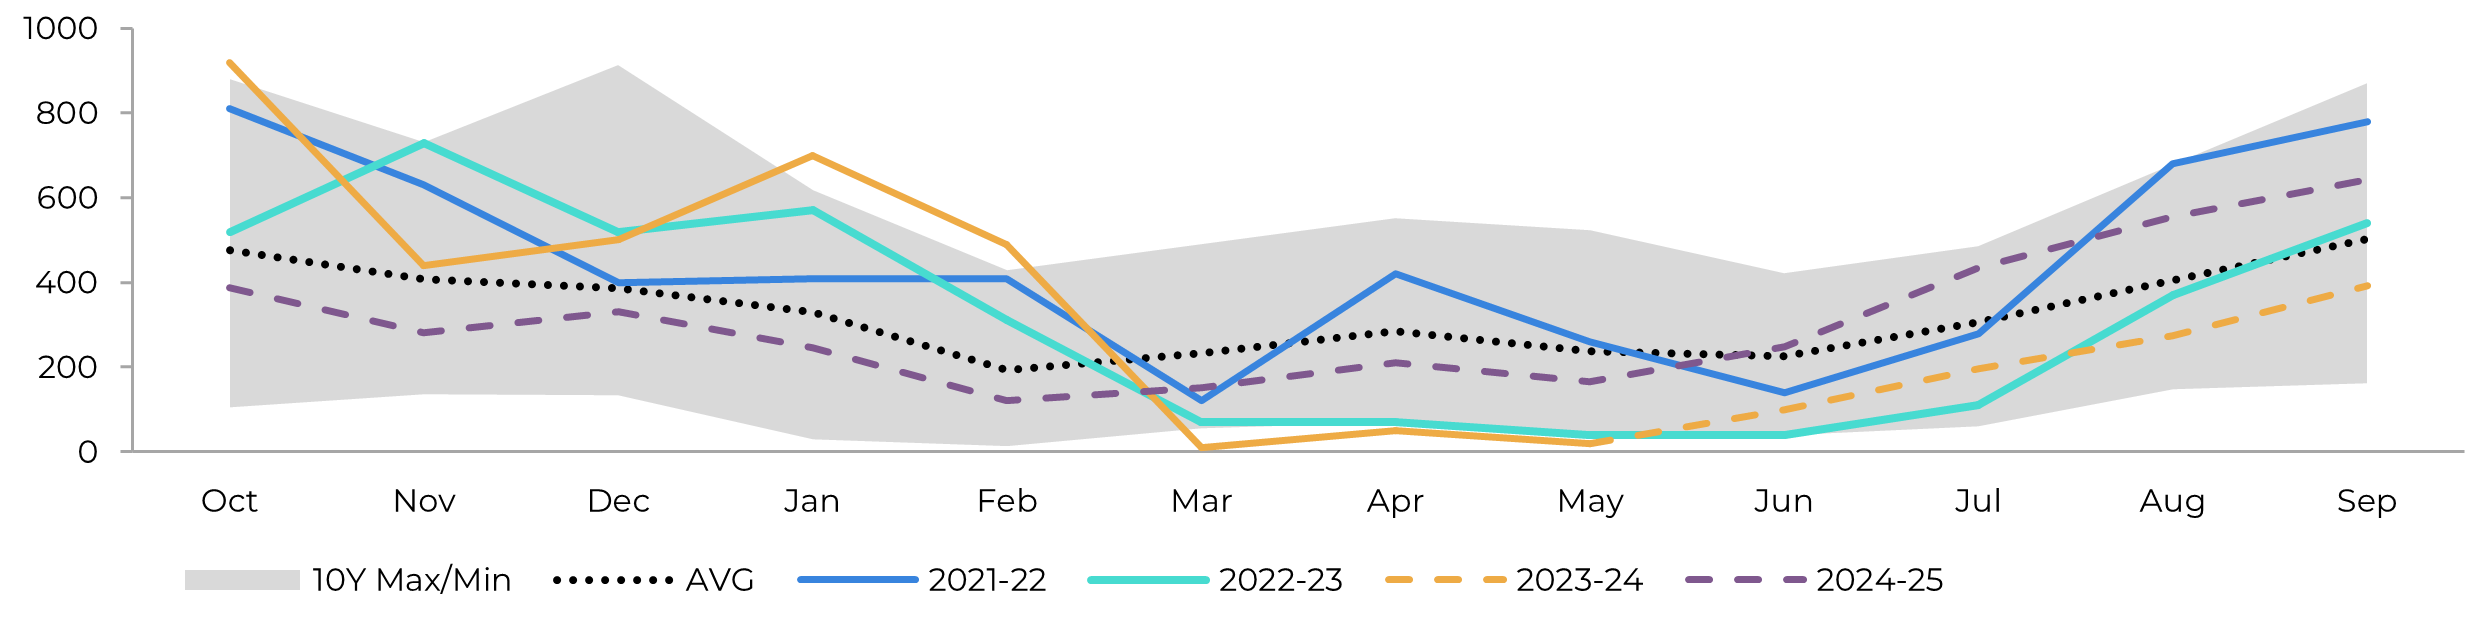
Image 27: Total Production - China ('000t)
Source: GSMM, Hedgepoint
Source: CSA, Refinitiv, Greenpool, Hedgepoint
Weekly Report — Sugar and Ethanol
livea.coda@hedgepointglobal.com
natalia.gandolphi@hedgepointglobal.com
Sugar and Ethanol Desk
murilo.mello@hedgepointglobal.com
vipul.bhandari@hedgepointglobal.com
gabriel.oliveira@hedgepointglobal.com
etori.veronezi@hedgepointglobal.com
jose.torreao@hedgepointglobal.com
Disclaimer


Contact us
Check our general terms and important notices.
We have updated our Terms & Conditions to reflect improvements to our platform, data handling practices, and the overall experience we provide to our clients.