
S&D and Trade Flow Update - 2024 08 20
"We are at a pivotal point where the market appears to have reached its bottom . In previous reports, we've highlighted 17.5 c/lb as a significant support level, not reaching Indian export parity and with Chinese arbitrage beginning to open in producing states. As a result, we anticipate that prices may recover in the coming weeks and stabilize, depending on the pace of the Brazilian Center-South crop pace."
S&D and Trade Flow
We are at a pivotal point where the market appears to have reached its bottom . In previous reports, we've highlighted 17.5 c/lb as a significant support level, not reaching Indian export parity and with Chinese arbitrage beginning to open in producing states. As a result, we anticipate that prices may recover in the coming weeks and stabilize, depending on the pace of the Brazilian Center-South crop pace.
While there's been widespread talk of a potential sudden death , it's important to note that the region's TCH remains robust. However, when comparing with previous seasons, we could see a sharper correction in yields between August and September. Depending on the extent of this reduction, we might need to revise our cane estimates downward from 620Mt. For now, we have chosen to keep our estimates unchanged until further confirmation. That said, even if we were to lower the region's sugar production to between 41.3Mt and 40.5Mt, a surplus would still exist, though it would be less pronounced.
This trend could lead to additional tightness, reinforcing the expected support for sugar prices during the Center-South’s intercrop period. Prices would need to return to Indian export parity, at least 18.5 c/lb. Given all the underlying factors, it’s reasonable to expect prices to move back to 19 c/lb when TCH start showing signs of weakness, with the potential to breach 20 c/lb during the intercrop. However, it remains challenging to discuss levels approaching the highs seen in 2023.
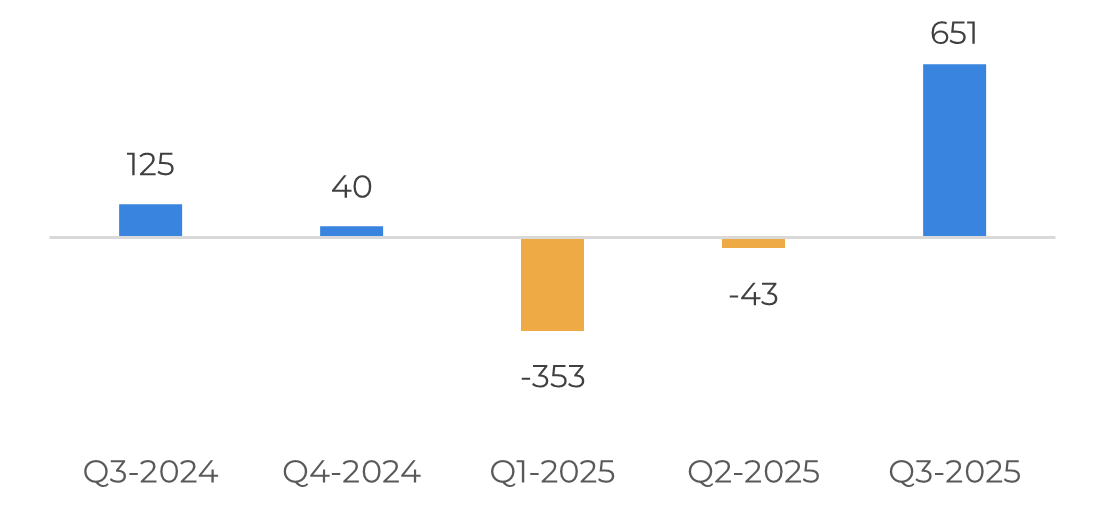
Image 1: Total Trade Flow ('000t)
Source: Hedgepoint
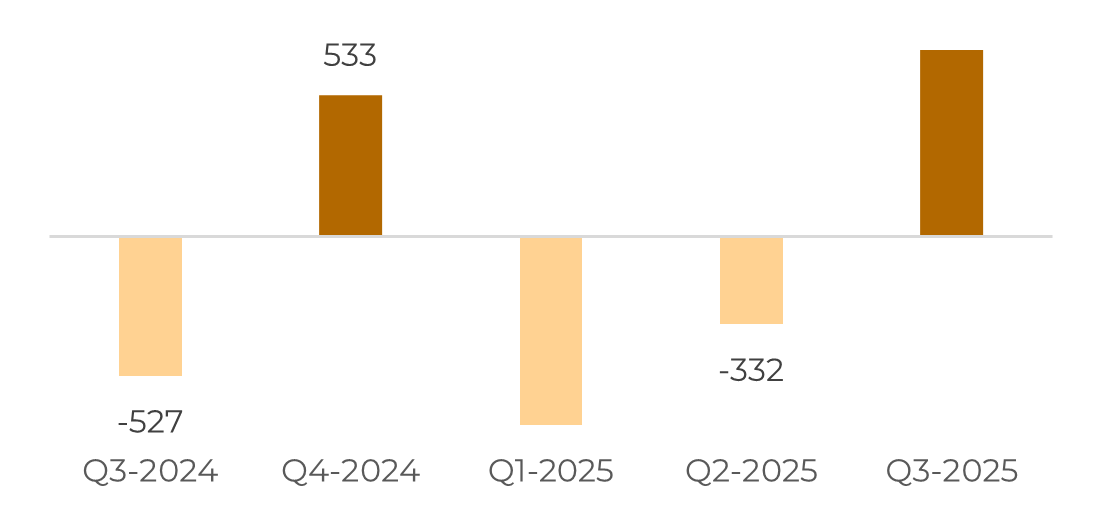
Image 2: Raw's Trade Flow ('000t)
Source: Hedgepoint
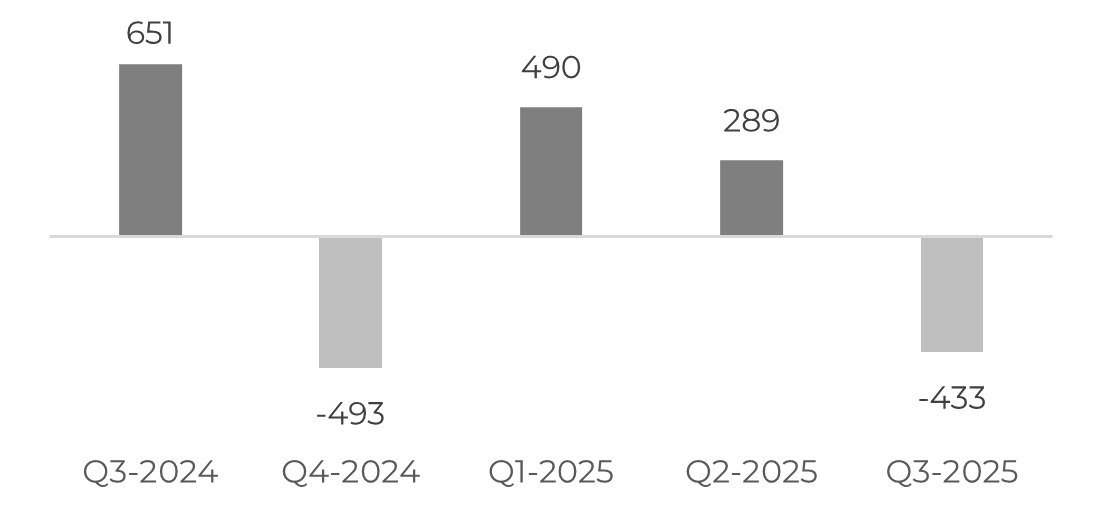
Image 3: White's Trade Flow ('000t)
Source: Hedgepoint
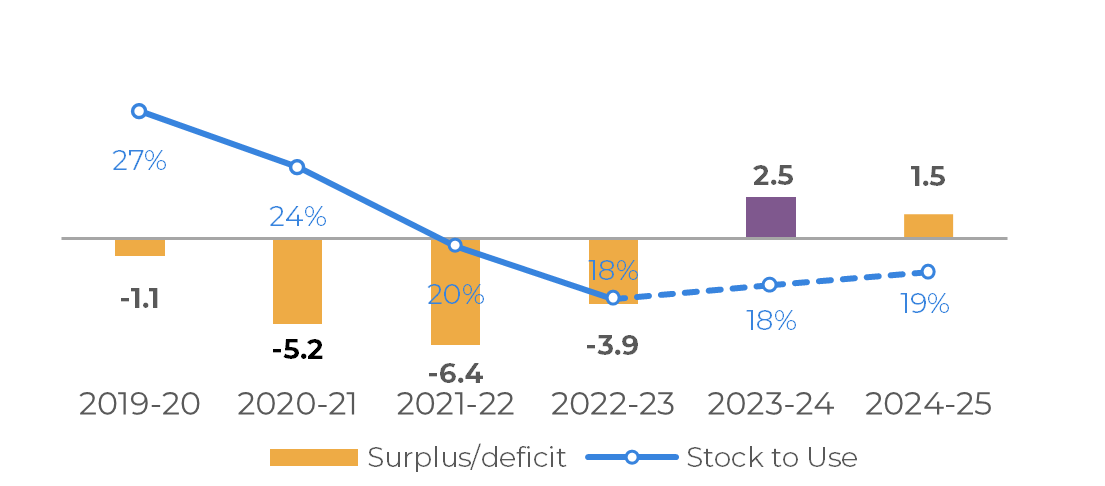
Image 4: Global Supply and Demand Balance (MT RV oct-sep)
Source: Hedgepoint
Brazil CS
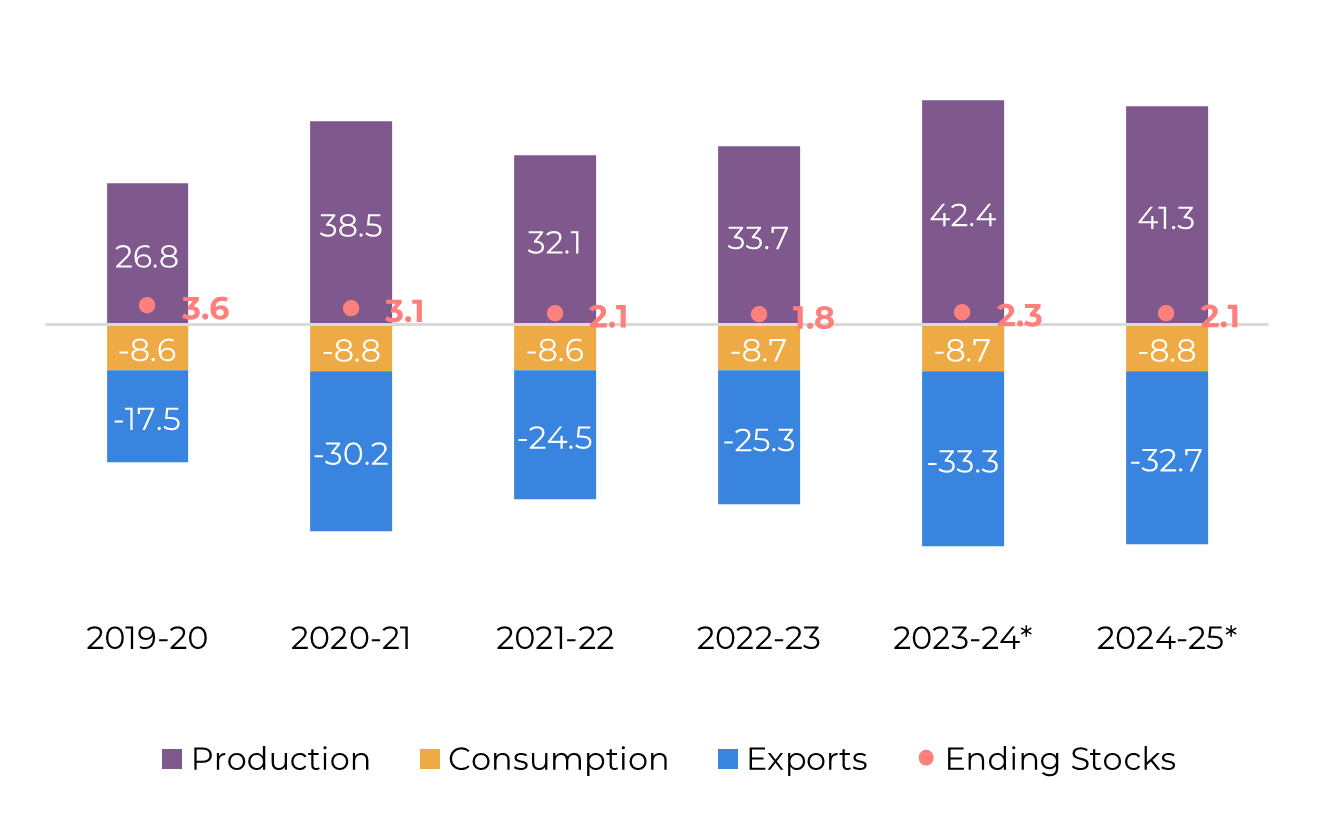
Image 5: Sugar Balance - Brazil CS (Apr-Mar Mt)
Source: Unica, MAPA, SECEX, Hedgepoint
The 2024/25 Center-South sugarcane season has followed a strong trajectory since its start, with an impressive 332.8 million tons crushed by the end of July. This marks a 6.7% increase compared to the previous season, 2023/24, driven largely by a quicker start and dry weather conditions. However, there is growing concern among market participants about a potential slowdown, as many anticipate that yields could begin to show stress between August and September due to the hotter, drier weather experienced during the cane's development stage.
hectare) compared to last season. This projection assumes a sharper decline in the index going forward, similar to what was observed in the 2016/17 season, the last year impacted by El Niño. Depending on the actual area growth for the next crop, which could range between 2.5% and 4.5%, the total cane production is expected to fall between 608 million tons and 620 million tons. According to Conab’s report, the area growth in Center-South for 2024/25 is projected at 4.5%, suggesting that production could lean towards the higher end of the range, closer to 620 million tons, especially considering some leftover cane.
Regarding cane quality, a noteworthy trend is the higher concentration of reducing sugars (RS), such as glucose and fructose, in the total recoverable sugar (TRS). This has been reported by many mills and is one reason behind the lower sugar mix. Several reductions in sugar mix expectations have been noted, and with a projected mix of 50.2% for the season, sugar production could range between 40.5 million tons and 41.3 million tons. While we remain optimistic about reaching the upper end of this range, it is crucial to closely monitor TCH levels.
If production trends towards the 40.5 million ton mark, we could see a longer inter-crop period, which may provide some price support. However, it's important to note that trade flows would still suggest a surplus, shifting market discussions from a 1 million ton surplus between Q3 2024 and Q3 2025 to something closer to 300 thousand tons. Consequently, the price range could adjust from 17-19 cents per pound to 18-21 cents per pound, depending on the duration of the inter-crop period.
Image 6: Total Exports - Brazil CS ('000t)

Image 7: Total Stocks - Brazil CS ('000t)
Source: SECEX, Williams, Hedgepoint

Source: Unica,MAPA, SECEX, Williams, Hedgepoint
Brazil CS Ethanol
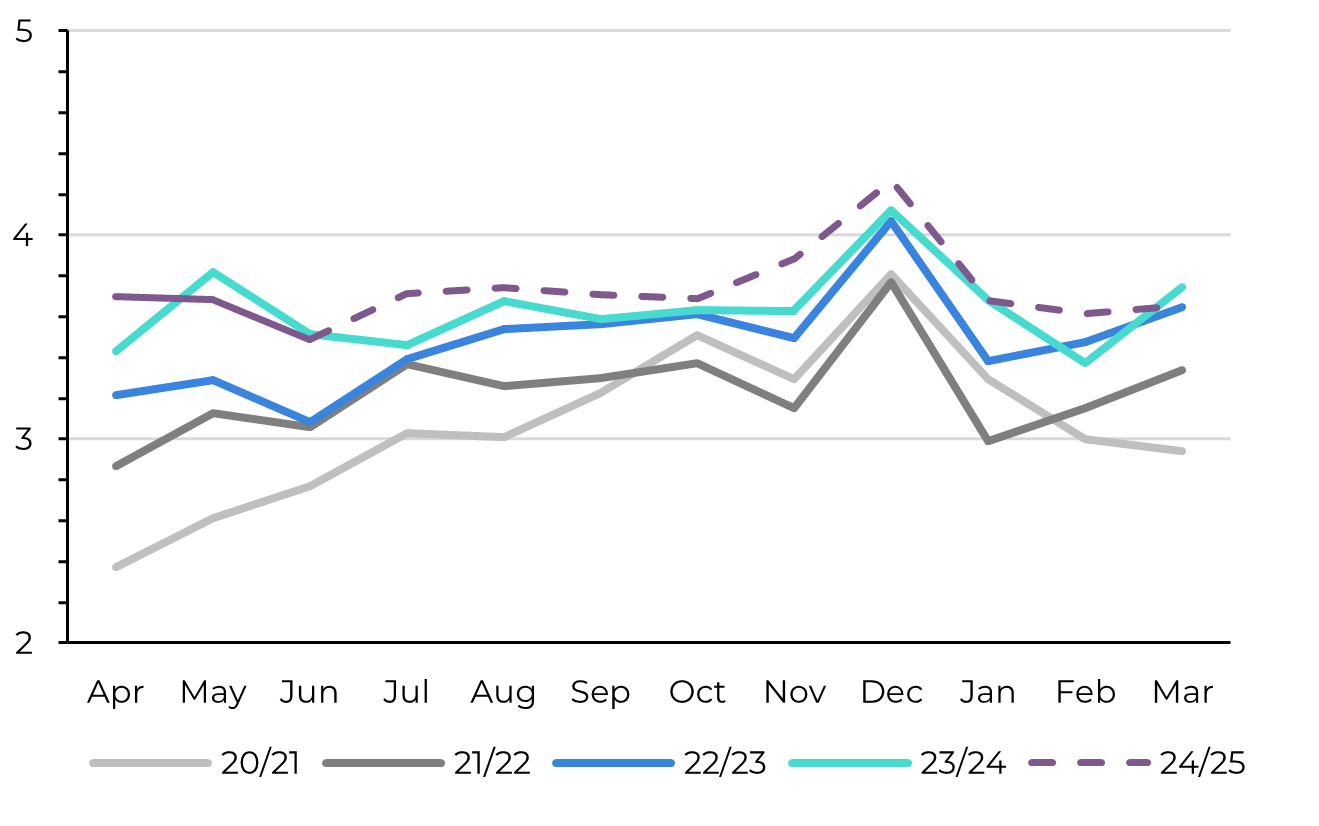
Image 8: Otto Cycle - Brazil CS (M m³)
Source: ANP, Bloomberg, Hedgepoint
Hydrous demand has been robust during the first three months of the season. According to ANP data, hydrous ethanol accounted for 37% of total fuel demand in June (calculated based on total volume, not just the Otto cycle), and this share has been consistently high since the beginning of the year, largely attributed to the pump parity shifting in favor of ethanol last July. However, because of a lower-than-expected sugar mix - primarily due to quality issues - ethanol prices haven't responded as strongly they could have, hovering around 15 cents per pound.
Image 9: Anhydrous Ending Stocks - Brazil CS ('000 m³)

Image 10: Hydrous Ending Stocks - Brazil CS ('000 m³)
Source: Unica, MAPA, ANP, SECEX, Hedgepoint

Source: Unica, MAPA, ANP, SECEX, Hedgepoint
Brazil NNE
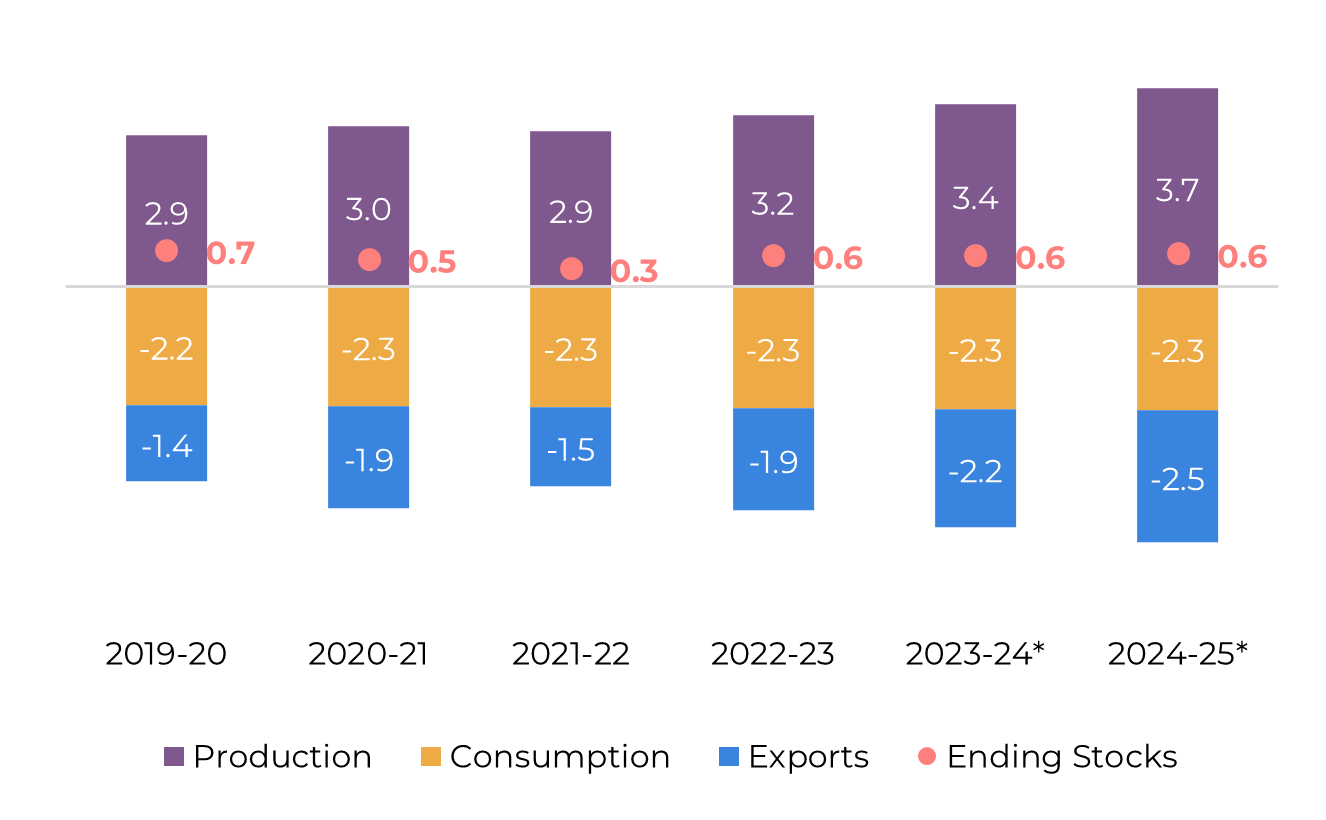
Image 11: Sugar Balance - Brazil NNE (Apr-Mar Mt)
Source: MAPA, SECEX, Hedgepoint
With some mills resuming operations, the North-Northeast (NNE) region has already produced 78 thousand tons (kt) of sugar, an increase of more than 25% over last year, when production did not begin before June. This year, some cane was processed as early as April and May. However, key regions like Alagoas are expected to officially begin their 2024/25 crop season only next week.
On the export front, the NNE region maintained strong momentum during the intercrop period, achieving nearly 25% growth between April and July. According to SECEX, 603 kt of sugar were exported, with 458 kt being raw sugar and 144 kt white sugar. The U.S. remains a key trading partner, receiving about 14% of these exports, or roughly 87 kt, compared to 16%, or 67 kt, during the same period last year.
Image 12: Total Exports - Brazil NNE ('000t)

Source: SECEX, Hedgepoint
India
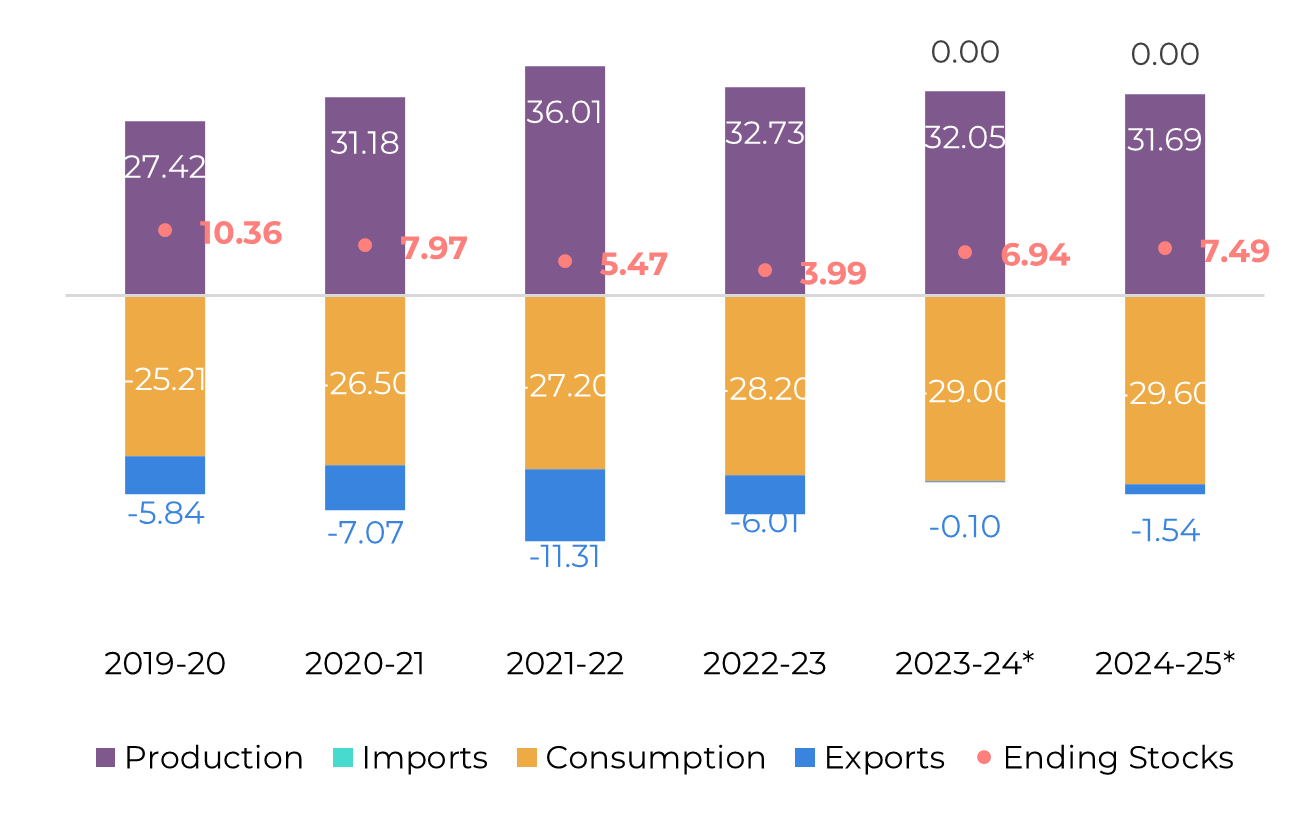
Image 13: Sugar Balance - India (Oct-Sep Mt)
Source: ISMA,AISTA, Hedgepoint
At the end of June, ISMA (Indian Sugar Mills & Bio-Energy Manufacturers Association) released its estimates for the 2024/25 sugar season, which the market viewed as optimistic. Earlier in the year, there were discussions of a potential 20% reduction in sugarcane acreage, but that figure has now been significantly revised to a 6% decrease, with the area estimated at approximately 5.61 million hectares based on satellite imagery from late June 2024.
In their press release, ISMA projected gross sugar production (before diversion) for the 2024/25 season at around 33.3 million tons . After accounting for a 5.5-million-ton diversion, the net sugar production would be 27.8 million tons. The agency also noted that, with an expected higher opening stock of around 9 million tons and domestic consumption projected at 29 million tons, the country would still end the season with higher-than-normal stocks, exceeding the typical 2.5 months' reserve of 5.5 million tons.
Although we have observed these figures, we remain confident that the country has the potential to increase production. Sugarcane continues to be the most profitable crop in the nation, and the favorable monsoon season has supported cane’s development. The primary concern is the potential for an increased spread of disease, namely red-hot, and adverse weather conditions in the future. Nonetheless, we have maintained our production estimate at 31.7 million tons, which is nearly 4 million tons higher than ISMA’s projection and allows us to call 1.5 million tons of exports.
Image 14: Total Domestic Exports - India ('000t w/o tolling)

Source: ISMA,AISTA, Hedgepoint
Thailand
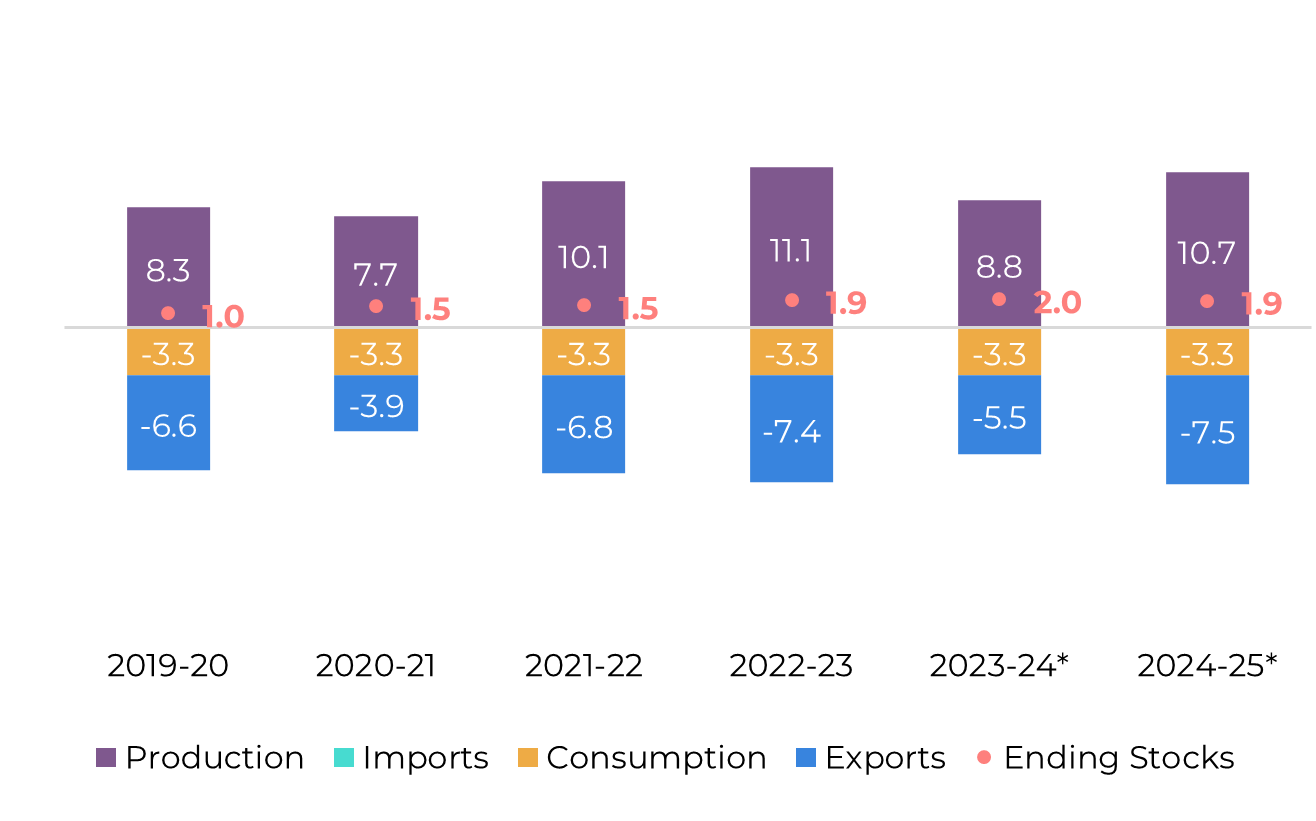
Image 15: Sugar Balance - Thailand (Dec-Nov Mt)
Source: Thai Sgar Millers, Sugarzone, Hedgepoint
Since the beginning of the 2023/24 season, Thailand has exported approximately 3.5 million tons of sugar, which is 35% lower than the 5.2 million tons exported by the end of June last year. These figures are in line with expectations, as the reduction in Thailand's sugar production is accompanied by a similar decline in exports.
We are entering the key window for next season's cane development. In July, above-average rainfall was recorded in Thailand's main cane-growing regions—northeast, north, and central part of the country. Looking ahead, the Thai Meteorological Department’s 3-month outlook for August to October forecasts below-normal rainfall in parts of the east and northeast in August, normal rainfall in September, and above-average rainfall in October.
This weather pattern should support cane development, making it feasible to achieve our 10.7-million-ton sugar production estimate, based on 100 million tons of cane. Consequently, Thailand could return to exporting over 7.5 million tons of sugar, contributing to a more comfortable trade flows.
Image 16: Total Exports - Thailand ('000t)

Source: Thai Sgar Millers, Hedgepoint
EU 27+UK
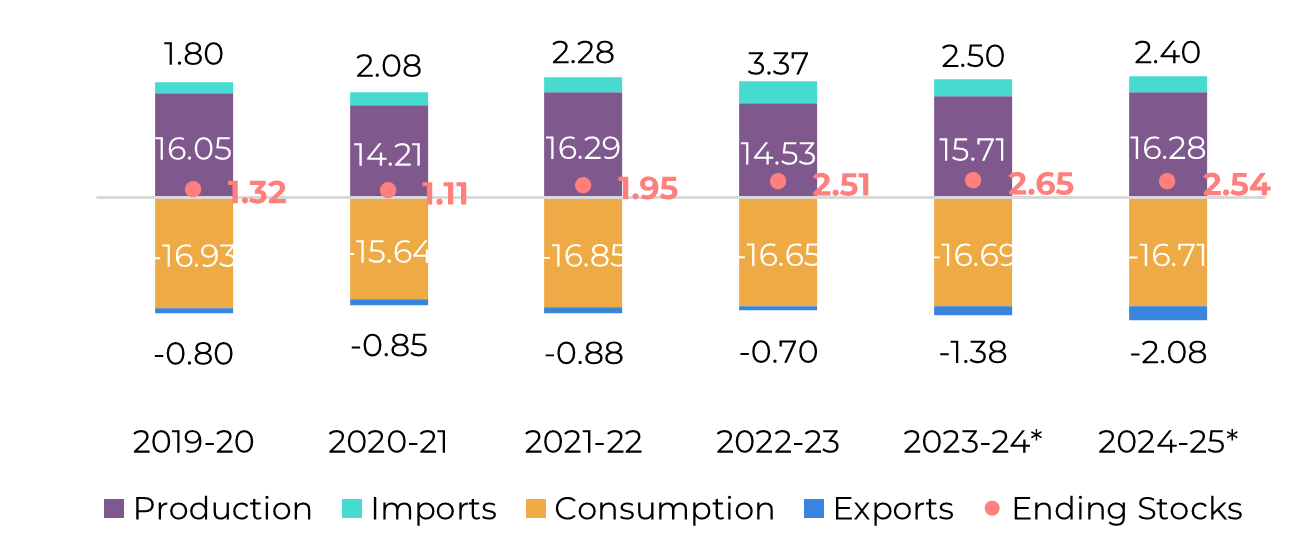
Image 17: Sugar Balance - EU 27+UK (Oct-Sep Mt)
Source: EC, Greenpool, Hedgepoint
The European Commission has released its initial estimates for the 2024/25 crop season, which are largely in line with our own projections, though we have made slight revisions. Including our estimates for the UK, we anticipate a 5.4% increase in planted area and a nearly 2% decrease in beet yields, which is 1.2% below the 5-year average. This would result in a net production of 16.3 million tons, a 3.6% increase over last year, primarily driven by the expanded area.
Mexico
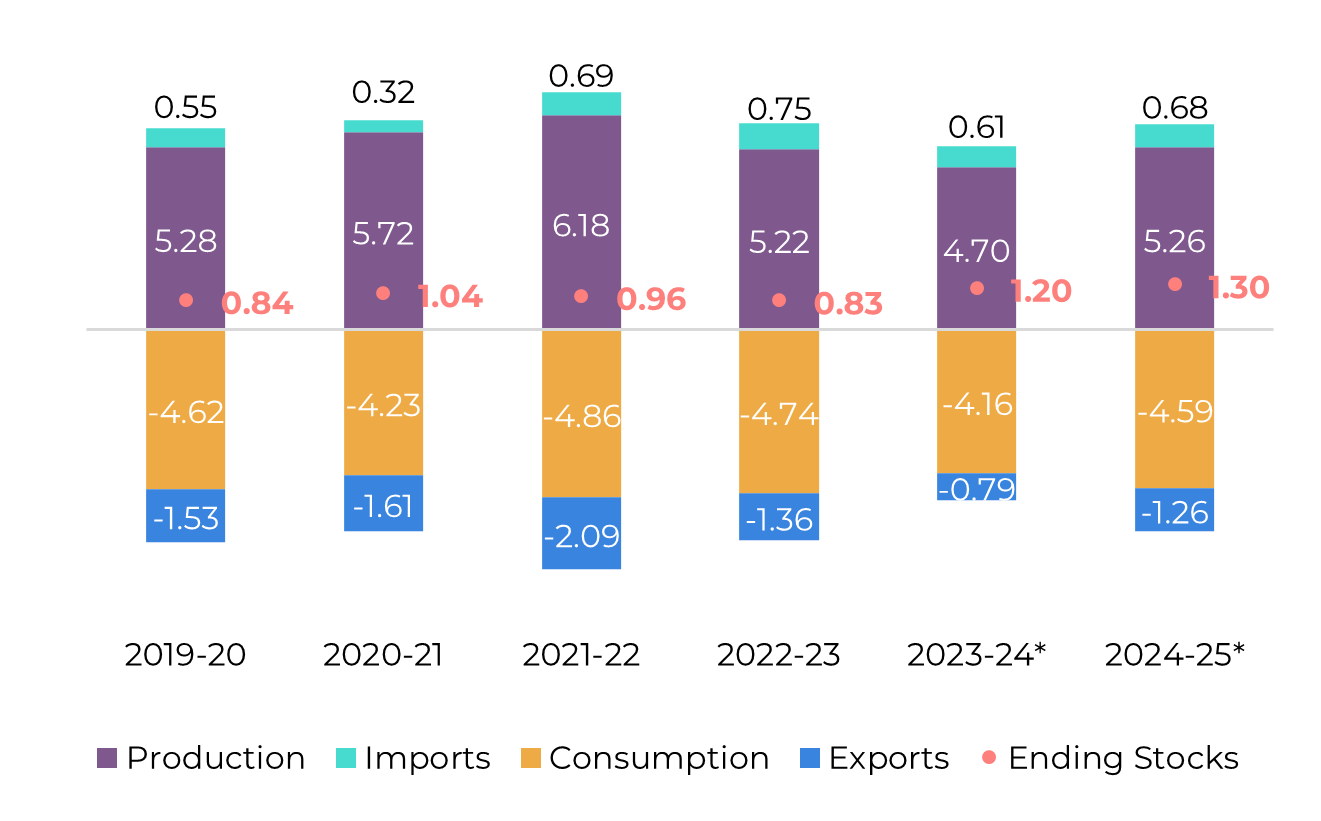
Image 18: Sugar Balance - Mexico (Oct-Sep Mt)
Source: Conadesuca, Greenpool, Hedgepoint
Mexico's 2023/24 crushing season has ended, with sugar production reaching approximately 4.7 million tons, aligning closely with expectations but representing a 10% decrease from the previous season. This decline is primarily due to a reduced planted area . Compared to the 2022/23 season, the area decreased by 7.8% to 743 thousand hectares, which is also lower than the initial estimate of 798 thousand hectares. Additionally, yields were affected by last year's drought, dropping by 2.3% to just 6.3 tons of sugar per hectare.
Looking ahead to the next season, weather conditions will be crucial for assessing the potential for recovery. According to Conagua, national accumulated rainfall in July 2024 was 153.3 mm, which is 21.8% above the national average (1991-2020) of 125.9 mm, resulting in a surplus of 27.4 mm. During the month, most of the country saw above-average rainfall, particularly in the Central Plateau, western, northeastern, and southern regions, with significant increases in San Luis Potosí and Veracruz – key sugar producing states. This is promising for cane development, which coupled to the fact that 2024 has experienced a 5.9% higher cumulative rainfall compared to the average, allow us to expect some recovery.
Image 19: Total Exports - Mexico ('000t)

Source: Conadesuca, Greenpool, Hedgepoint
USA
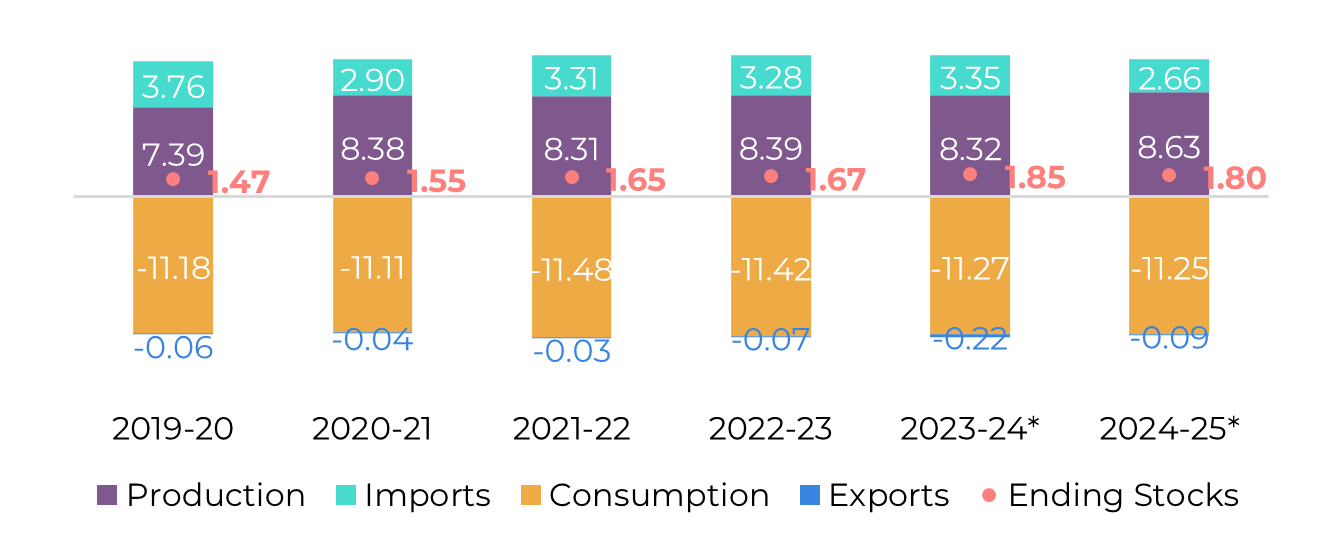
Image 20: Sugar Balance - US (Oct-Sep Mt)
Source: USDA, Hedgepoint
In the August World Agricultural Supply and Demand Estimates (WASDE), U.S. sugar production forecasts for the 2023/24 and 2024/25 seasons were slightly increased from the previous month. This update is due to higher imports and increased Florida cane sugar production for the current season, despite a decrease in beet sugar output. For 2023/24, the total use was reduced, resulting in higher ending stocks. This higher stock level contributed to the increased output forecast for 2024/25, alongside record-high domestic production.
Beet sugar supply is expected to reach 4.8 million metric tons, an all-time high, while cane sugar is forecasted at 3.7 million metric tons. Consequently, the stocks-to-use ratio for 2024/25 is projected to be as high as 15.9% at the end of the season.
As a result, the U.S. may require fewer imports than previously anticipated. The agency estimates imports for 2024/25 at 2.6 million metric tons, a 20.5% reduction from the 3.3 million metric tons projected for 2023/24. This shift might indicate a more bearish outlook.
Guatemala
Image 21: Sugar Balance - Guatemala (Oct-Sep Mt)
Source: Cengicaña, Sieca, Azucar.gt,Greenpool, Hedgepoint
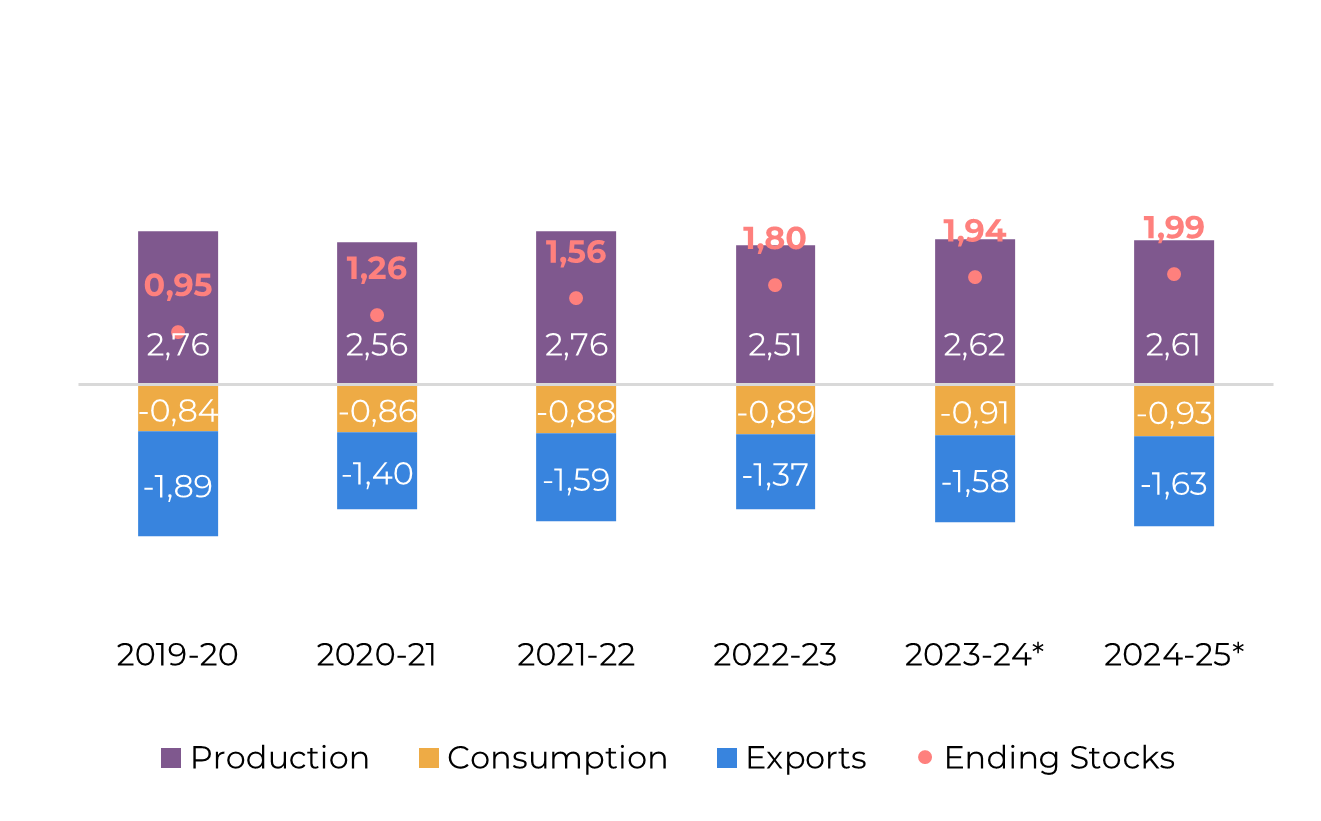
Looking ahead to the 2024/25 season, current weather forecasts indicate Guatemala will maintain a similar production level, but increased stocks suggest higher export potential.
Image 22: Total Exports - Guatemala ('000t)

Source: Sieca, Hedgepoint
El Salvador
Image 23: Sugar Balance - El Salvador (Mt Oct-Sep)
Source: Consaa, Sieca, Greenpool,Hedgepoint
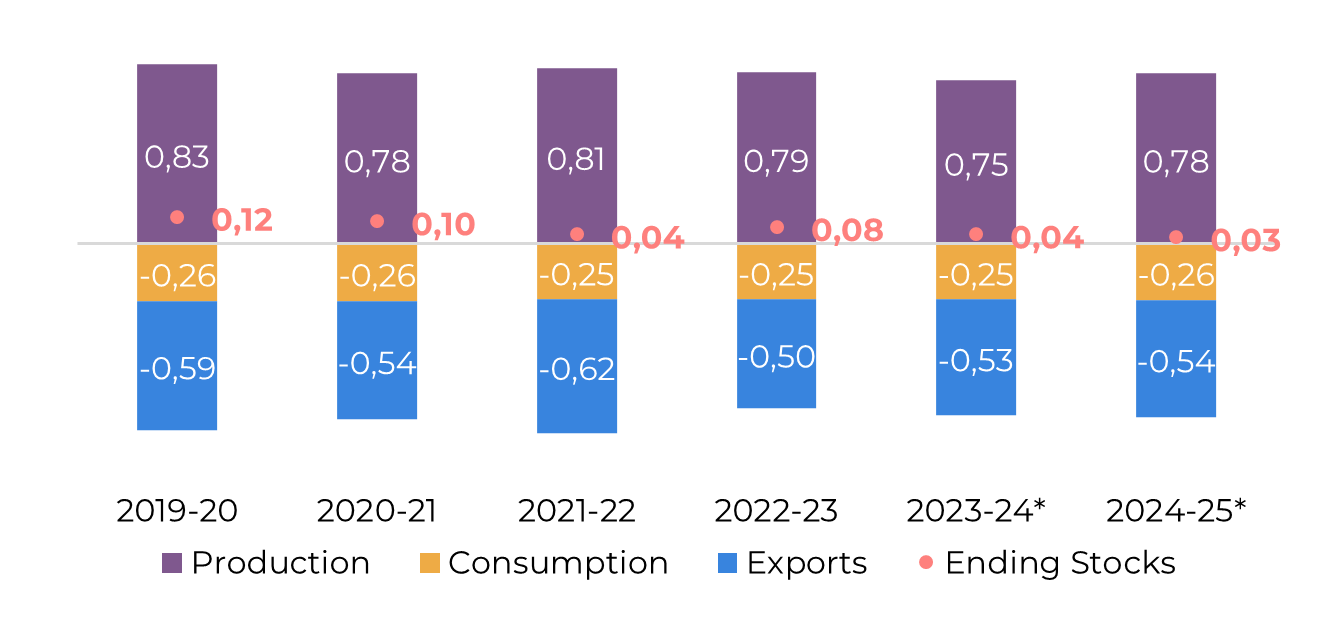
No update: Between Nicaragua, Guatemala, and El Salvador, the latter recorded the worst year-over-year result. Producing only 754 kt, the country faced a 4% drop compared to 2022/23. For the 2024/25 season, current weather predictions suggest a recovery for El Salvador. The country could return to the 780 kt level next year, maintaining stable exports. However, this remains approximately 50 kt lower than its capacity reached in 2019/2020.
Russia
Image 24: Sugar Balance - Russia (Mt Sep-Aug)
Source: Ikar, Sugar.ru, Greenpool, Hedgepoint
China
Image 25: Sugar Balance - China (Oct-Sep Mt)
Source: GSMN, CSA, Refinitiv, Greenpool, Hedgepoint
Obs: stocks also account for bonded warehouses volume and imports include syrup and smuggling estimates
Image 26: Total Imports - China ('000t - exc. syrup and smuggling)

Image 27: Total Production - China ('000t)
Source: GSMM, Hedgepoint

Source: CSA, Refinitiv, Greenpool, Hedgepoint
Weekly Report — Sugar and Ethanol
livea.coda@hedgepointglobal.com
laleska.moda@hedgepointglobal.com
Sugar and Ethanol Desk
murilo.mello@hedgepointglobal.com
vipul.bhandari@hedgepointglobal.com
gabriel.oliveira@hedgepointglobal.com
etori.veronezi@hedgepointglobal.com
jose.torreao@hedgepointglobal.com

