
S&D and Trade Flow Update - 2025 01 13
"Considering our trade flow assumptions and associated risks, Q1 2025 could shift from a balanced position to a deficit, in case India’s situation keeps showing signs of deterioration. Nonetheless, price reactions may remain subdued, as demand appears tepid, and buyers might be willing to wait for the next Brazilian crop."
S&D and Trade Flow
In the final months of 2024, sugar prices declined, settling around 19–19.5 cents per pound by December and showing limited recovery. The Brazilian Center-South region exceeded expectations, surpassing 611 million tons of cane crushed and indicating the potential to reach 620 million tons and nearly 40 million tons of sugar by the end of the 24/25 season, in March 2025. The fires and droughts of 2024 have not impacted this season as many have discussed, reducing concerns about their potential effects on the next season. Optimistic projections for the 25/26 season, driven by the recent rains, have contributed to a bearish outlook for sugar prices.
Our current estimates remain somewhat conservative, at 600 million tons of cane for 25/26. However, by the end of January, we could revise this figure closer to 620 million tons, since the 24/25 harvest is getting closer to this result every day, and it seems increasingly likely that it will be possible to maintain this level given the conditions for sugarcane development seen so far.
On the bullish side, India's sugar production faces challenges. While our forecast of 31 million tons (post-ethanol diversion) remains slightly above the market consensus, revisions may be necessary. Current trade flow assumptions include 1.5 million tons of exports from India, but lagging cane crushing, disease outbreaks, and reduced acreage could limit the country’s output and participation in trade flows. As of now, production is 17.8% lower year-over-year, or 1.7Mt. However, December's crushing reached 6.72 million tons, nearly matching the 6.88 million tons of 2023, which was a surprisingly good year compared to market first estimates. The current shortfall stems largely from November’s delayed production, which was 1.5 million tons lower due to fewer processing weeks. This delay suggests the situation warrants close monitoring before revising our numbers and taking a more bullish stance.
The risks to our forecasts are, therefore, balanced: higher contributions from Brazil may offset potential overestimations in India’s output. As a result, fundamentals currently indicate limited market strength for a significant price rebound, as Brazil's additional supply could outweigh reductions in the Northern Hemisphere.
Short-term trends to monitor include Central America and Mexico, where delayed crop starts have led to lower year-on-year production so far, potentially postponing exports and providing support to white sugar prices. However, Europe’s strong output could counterbalance this trend entirely, especially given the backdrop of slower demand and higher availability from Ukraine. Additionally, positive crop development prospects in Central America and Mexico suggest that any price-supportive trend coming from the region should be short-lived, if it materializes at all.
Considering our trade flow assumptions and associated risks, Q1 2025 could shift from a balanced position to a deficit, in case India’s situation keeps showing signs of deterioration. Nonetheless, price reactions may remain subdued, as demand appears tepid, and buyers might be willing to wait for the next Brazilian crop.
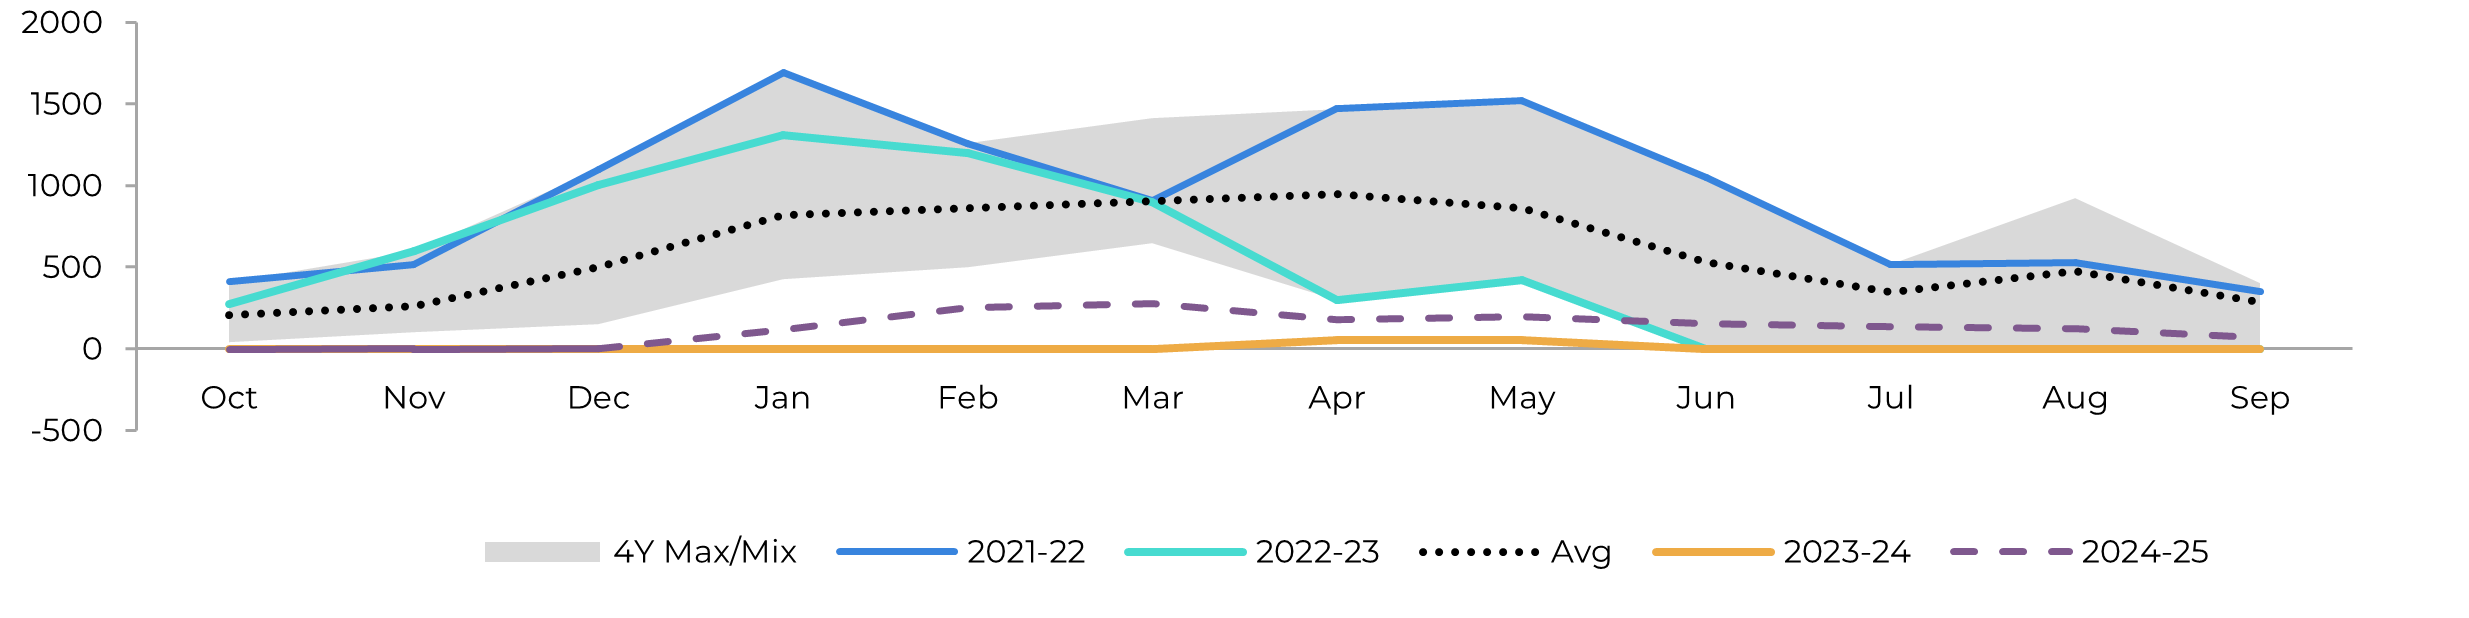
Image 1: Total Trade Flow ('000t)
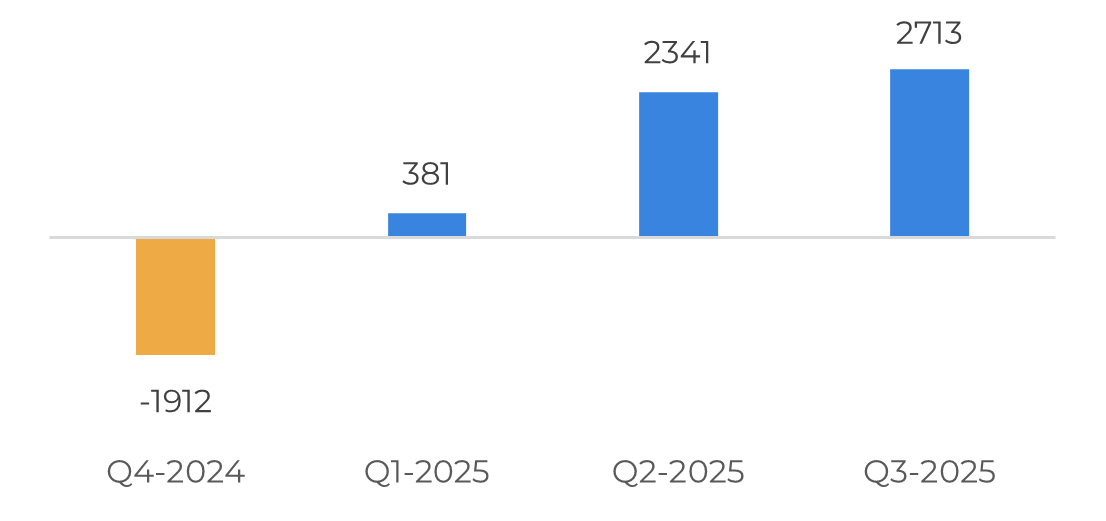
Source: Hedgepoint
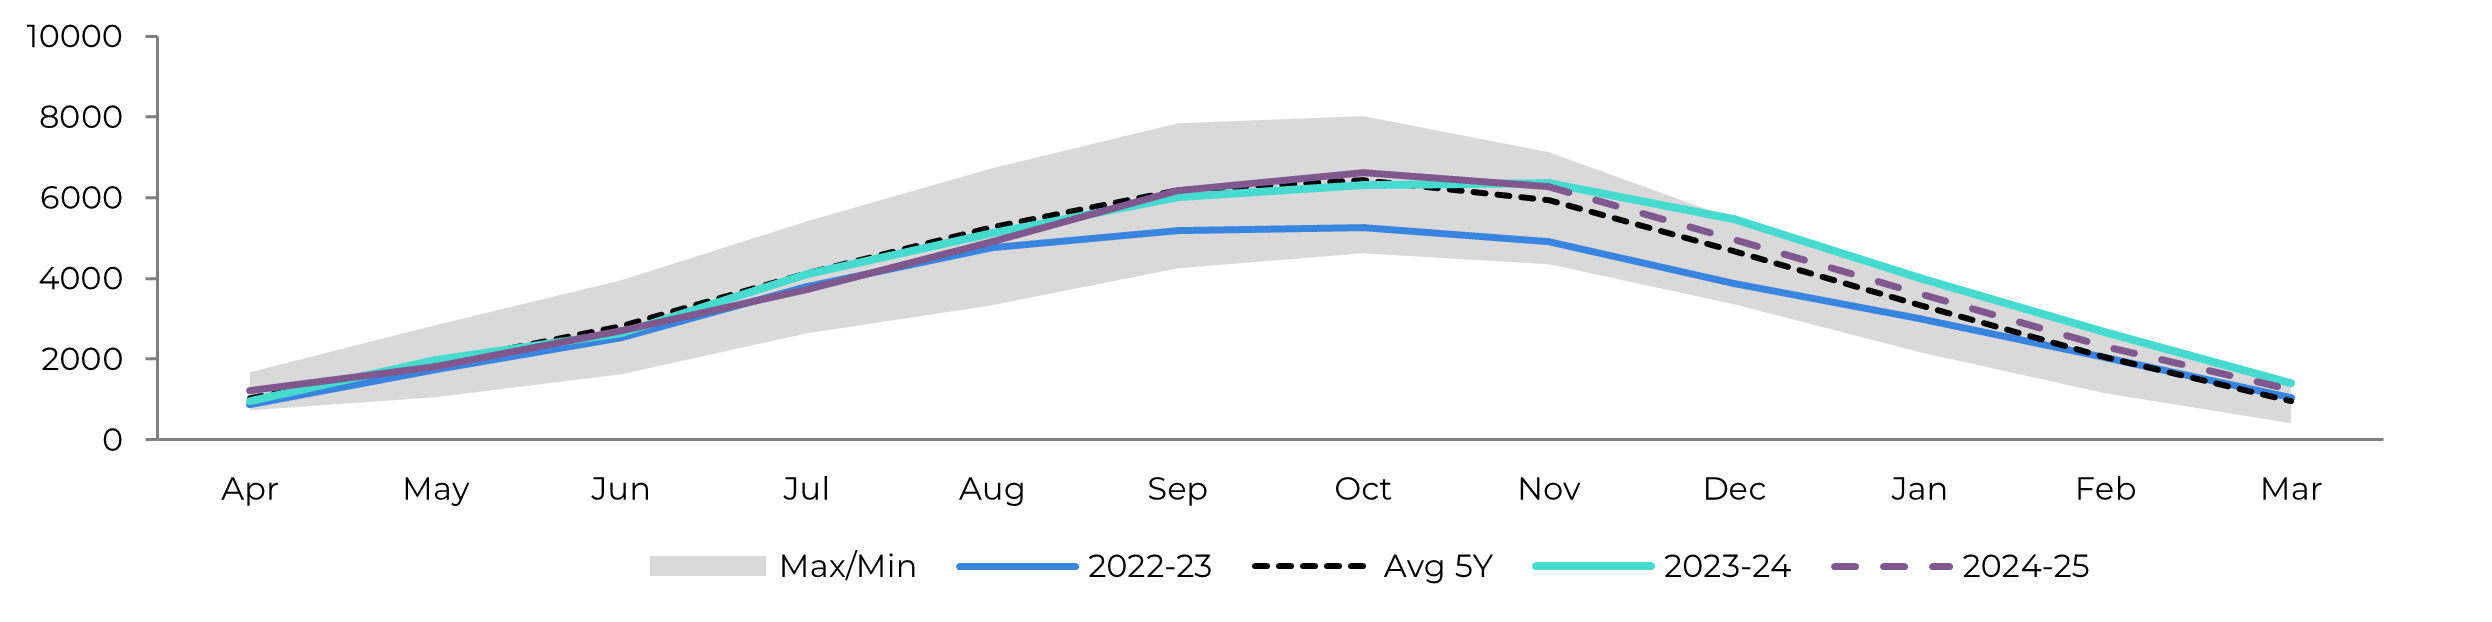
Image 2: Raw's Trade Flow ('000t)
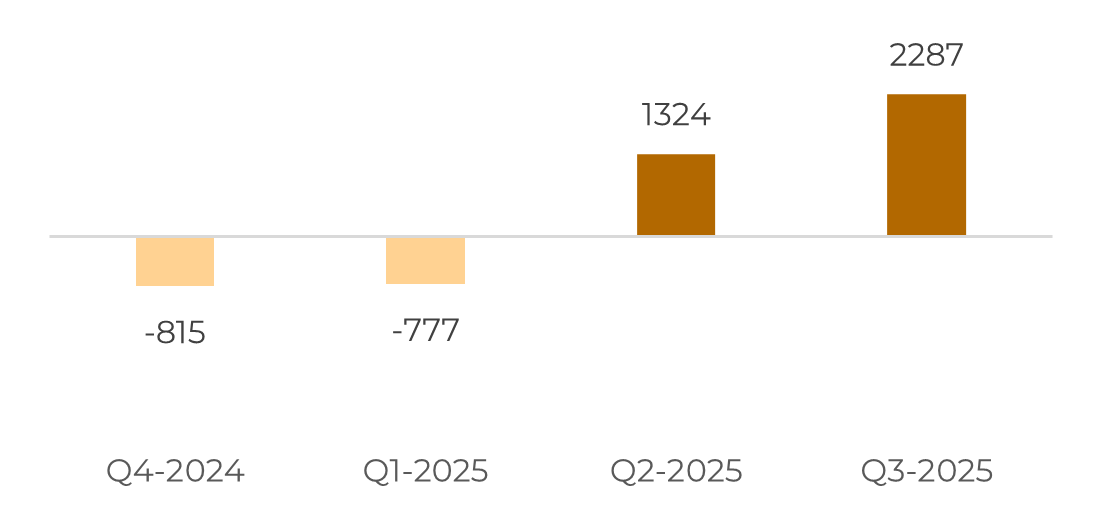
Source: Hedgepoint
Image 3: White's Trade Flow ('000t)
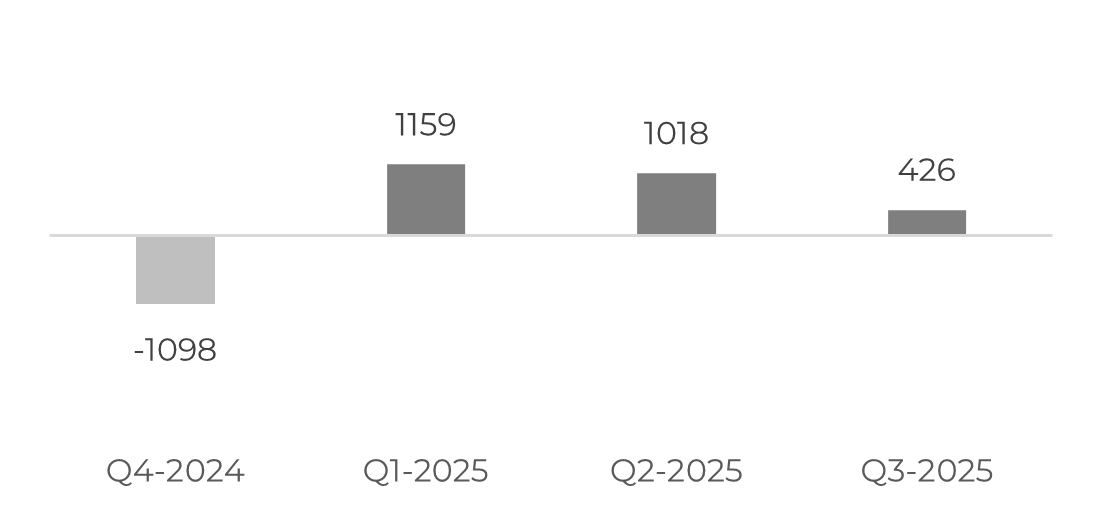
Source: Hedgepoint
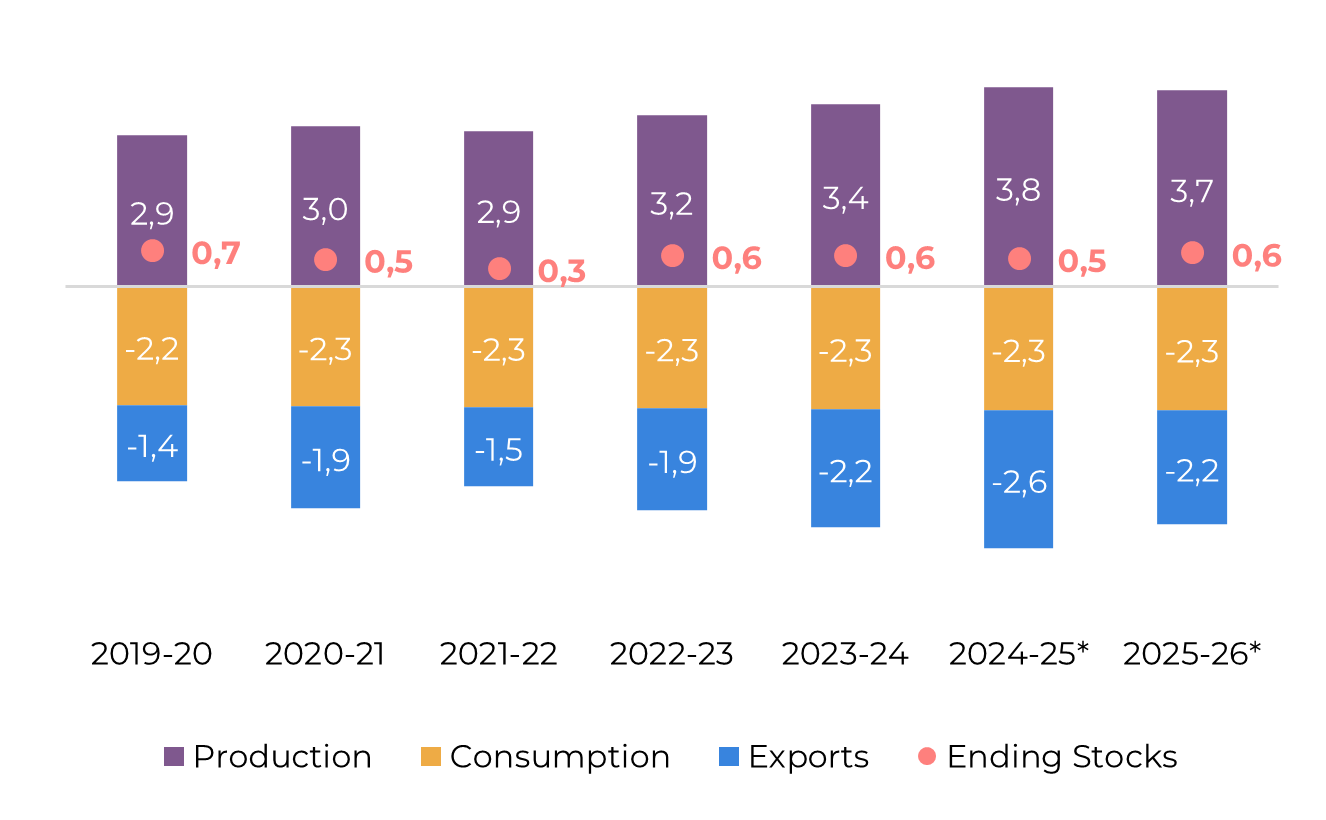
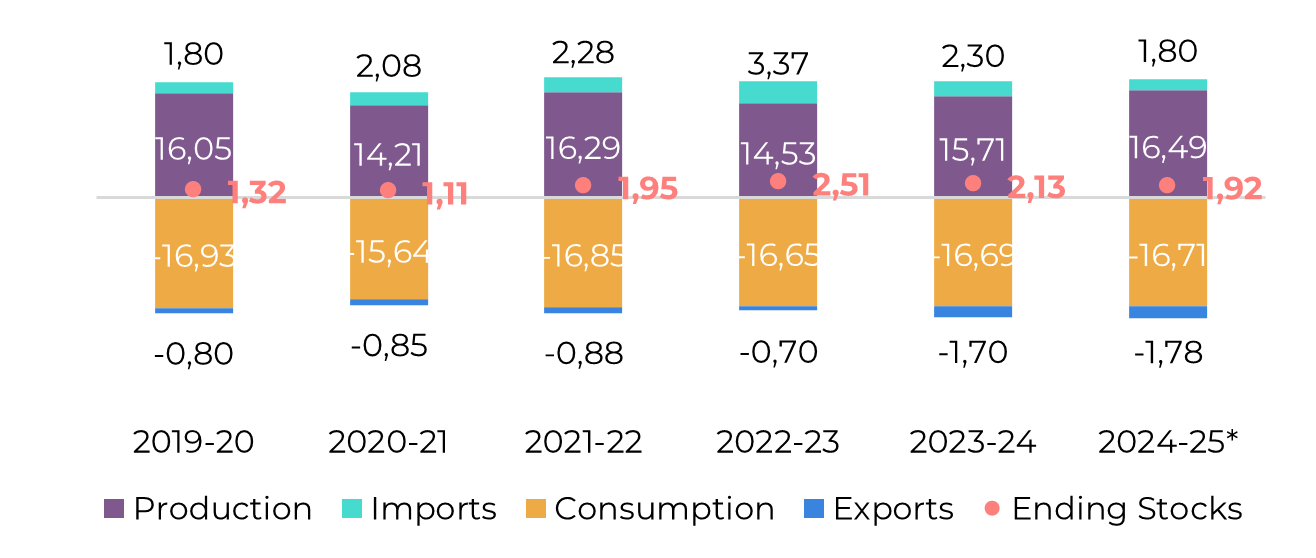
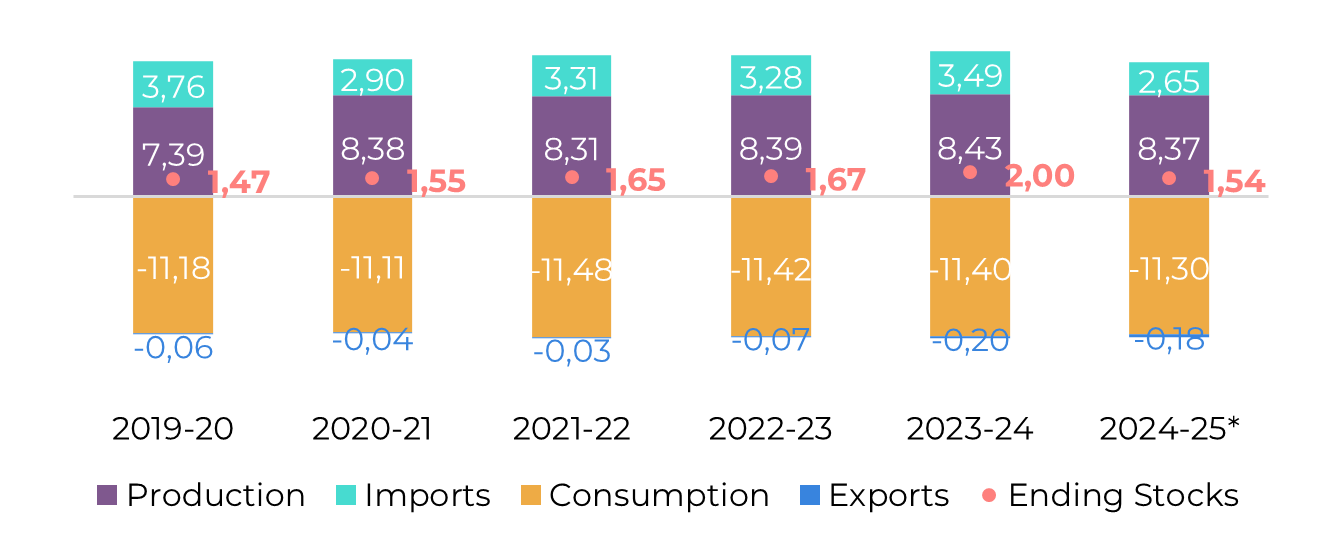
Image 4: Global Supply and Demand Balance (MT RV oct-sep)

Source: Hedgepoint
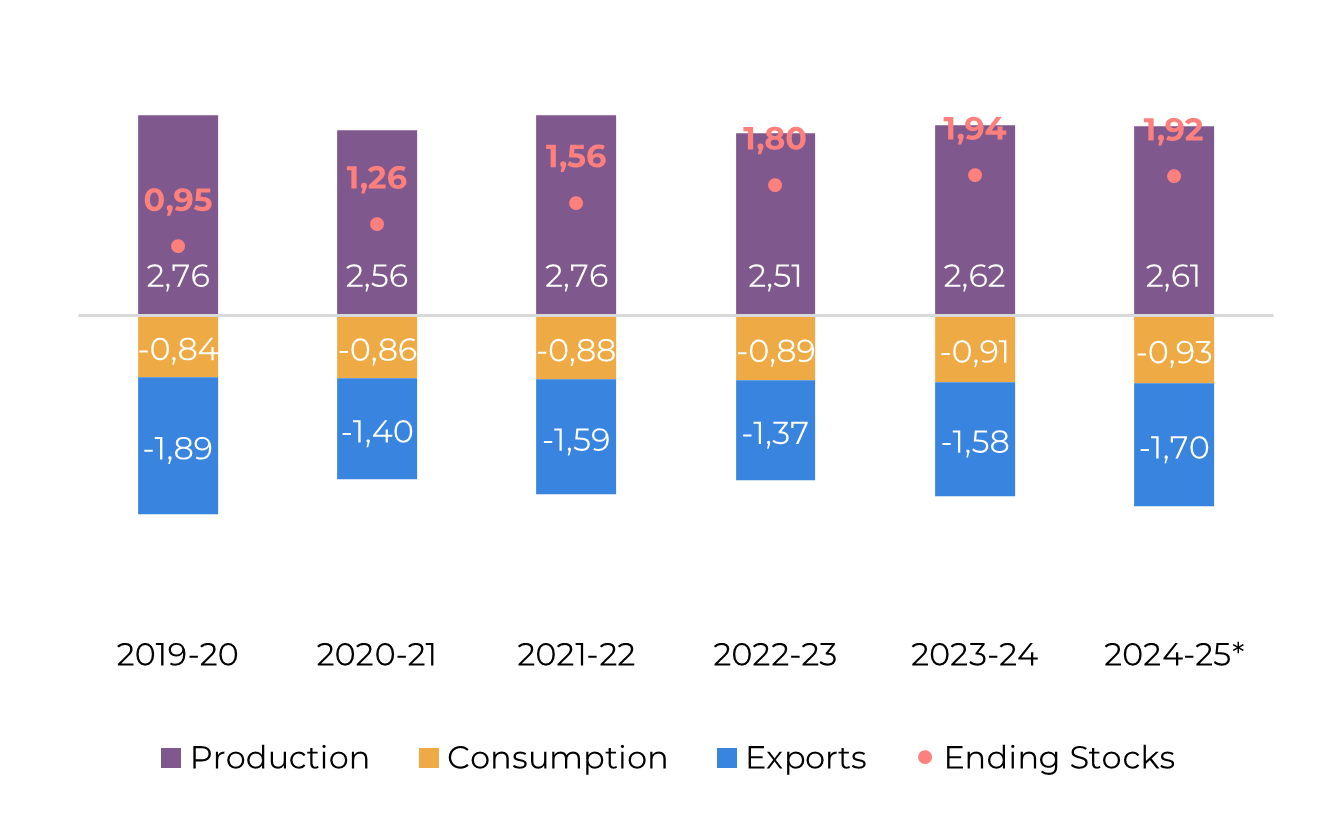
Brazil CS
Image 5: Sugar Balance - Brazil CS (Apr-Mar Mt)

Source: Unica, MAPA, SECEX, Hedgepoint
By the first half of December, the Brazilian Center-South region had already crushed nearly 612 million tons of sugarcane. This makes it highly likely that the country will reach 620 million tons by the end of the 24/25 season. If the region continues to crush an average of 8.5 million tons from the second half of December until the end of March, this target will be achieved. With a 48% sugar mix, this would result in nearly 40 million tons of sugar being produced.
This additional raw material has been the main reason for the recent market weakness. Sugar futures have dropped since the October 24 expiry and stabilized in a new range (around 19.5 c/lb) by December, as higher production and export availability became clear. This also led to lower spreads. Along with a weaker BRL, this trend has set the tone for the start of 2025.
The Brazilian currency is currently trading above 6 USD/BRL, which is a profitable level for exporters. This has led to a higher pace in crop pricing, with some mills already starting to take positions for the 26/27 season.
In terms of exports, a production of nearly 40 million tons would allow the region to export at least 31.5 million tons. By November, according to Williams, Center-South had shipped nearly 24.5 million tons, meaning another 7 million tons is needed to meet our estimates. This is in line with the 5-year average for the period between December and March.
For the 25/26 season, recent summer rains and the confirmation that the fires and the 2024 drought didn’t significantly impact the current year allows us to start discussing more optimistic scenarios. Center-South had no sudden-death and is constantly surprising on the upside during 24/25. Currently, our estimates are at 600 million tons, but it wouldn’t be surprising if the cane reached 620 million tons next season, especially because conditions have been ideal for development. This would also add availability to the market and help maintain lower sugar prices. Therefore, we are still accessing data, but we are already working with the idea of a much healthier result.
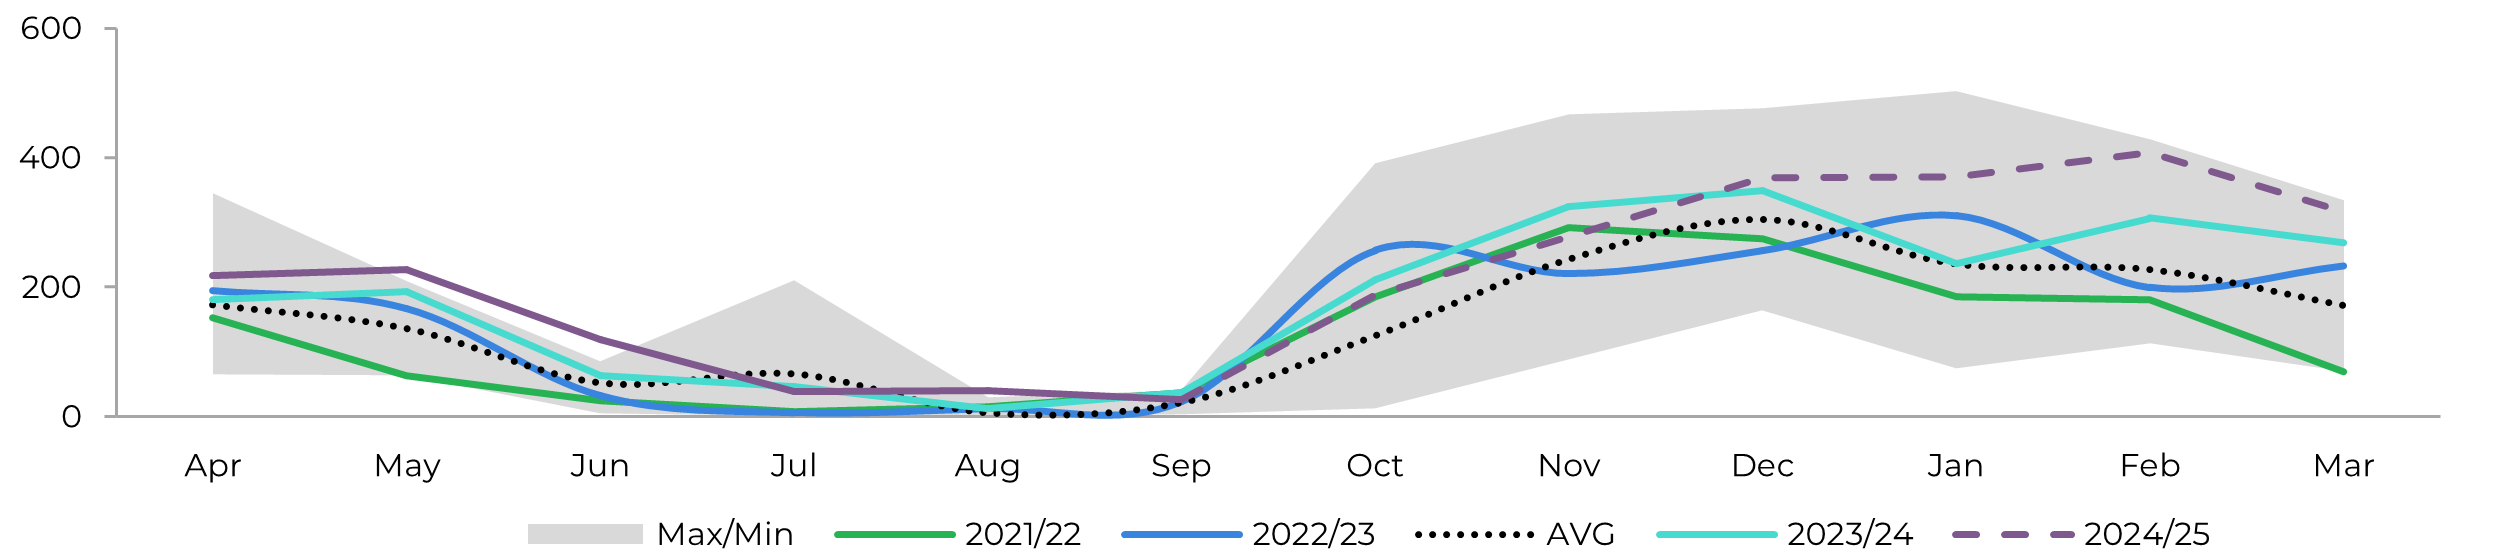
Image 6: Total Exports - Brazil CS ('000t)
Image 7: Total Stocks - Brazil CS ('000t)
Source: SECEX, Williams, Hedgepoint

Source: Unica,MAPA, SECEX, Williams, Hedgepoint
Brazil CS Ethanol
Image 8: Otto Cycle - Brazil CS (M m³)

Source: ANP, Bloomberg, Hedgepoint
Ethanol production has been thriving. A lower than desired sugar mix and higher than anticipated raw material have led to excellent results in the biofuel sector. Hydrous production has reached over 20 billion liters so far in the season, marking a 10.3% increase compared to last year, which was marked by a record in crushing volume. Its higher share in consumer choice, driven by pump parity price advantage, has led mills to prioritize this quality over anhydrous. Consequently, anhydrous production dropped by 7% to 11.6 billion liters compared to last season.
Image 9: Anhydrous Ending Stocks - Brazil CS ('000 m³)
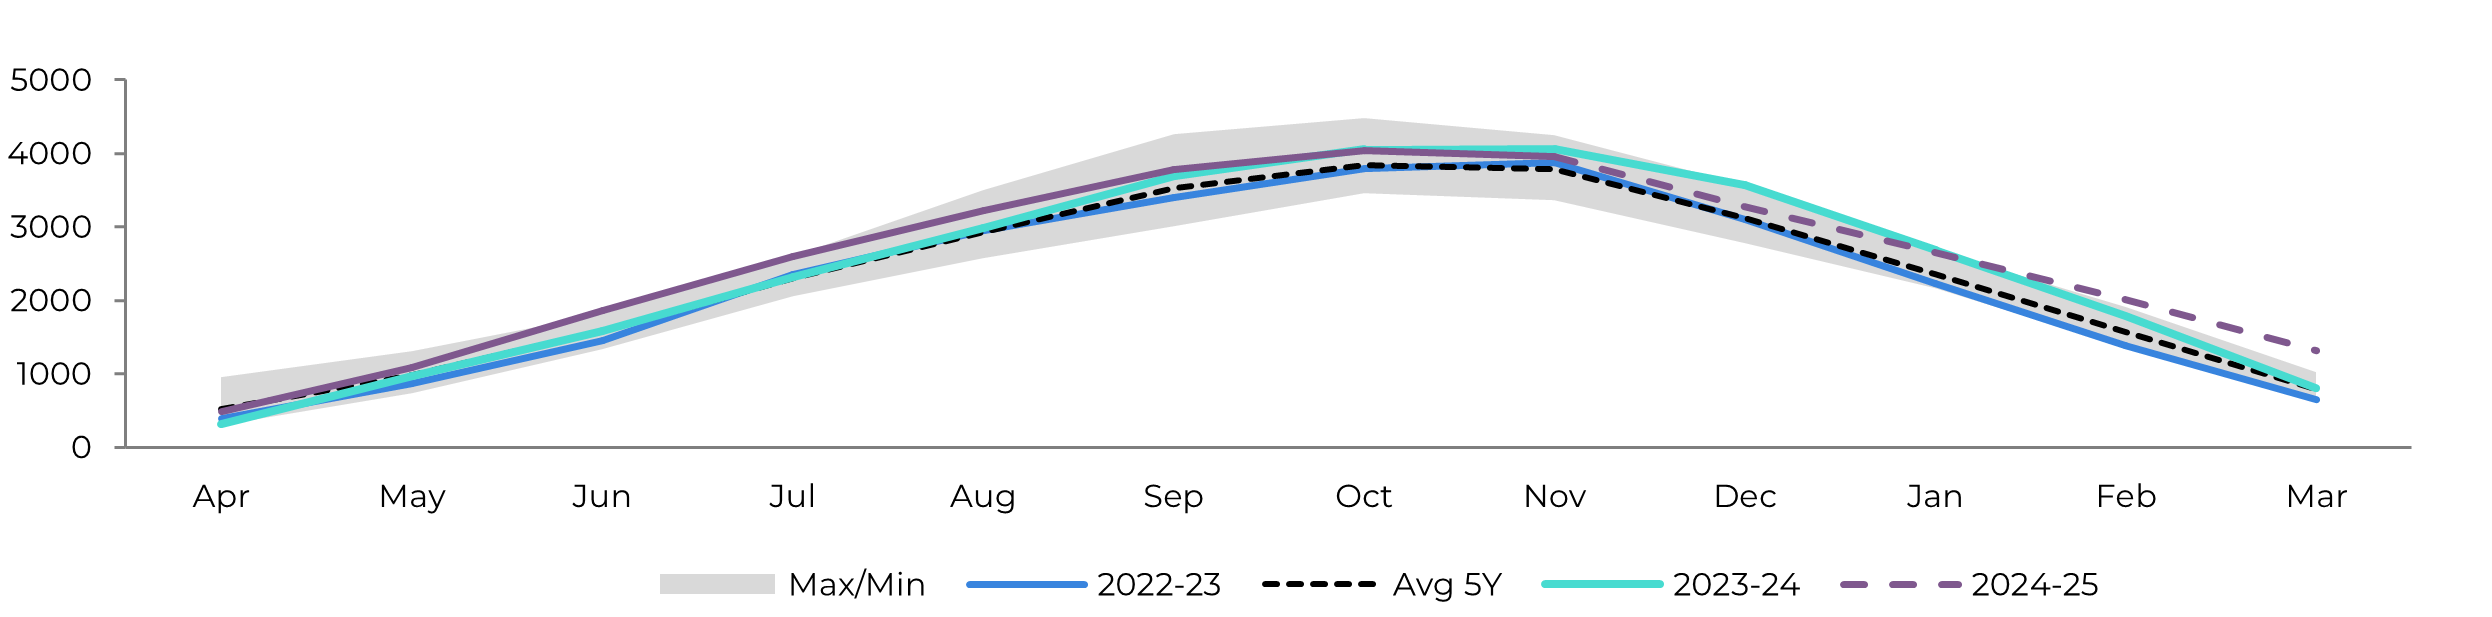
Image 10: Hydrous Ending Stocks - Brazil CS ('000 m³)
Source: Unica, MAPA, ANP, SECEX, Hedgepoint
Source: Unica, MAPA, ANP, SECEX, Hedgepoint
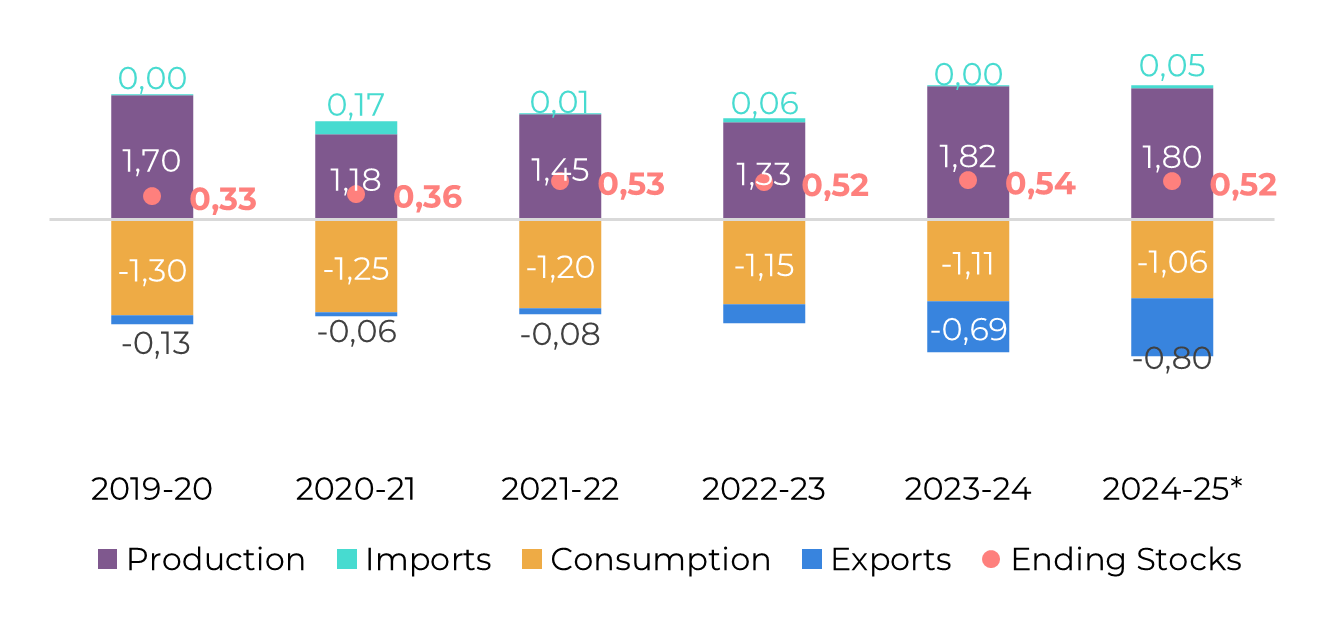
Brazil NNE
Image 11: Sugar Balance - Brazil NNE (Apr-Mar Mt)
Source: MAPA, SECEX, Hedgepoint
According to data from MAPA, the North-Northeast region of Brazil produced 2.2 million metric tons (Mt) of sugar by the end of November, marking a nearly 20% increase compared to the previous year. The results for the first fortnight of December, with 327 thousand metric tons (kt), are quite in line with last year's 333 kt, indicating that the growth rate has been maintained. This trend is attributed to higher availability and a sugar mix above 49%, along with a cumulative ATR level showing a yearly increase to about 136 kg/t. Consequently, we have kept our estimates for the season unchanged.
Image 12: Total Exports - Brazil NNE ('000t)
Source: SECEX, Hedgepoint
India
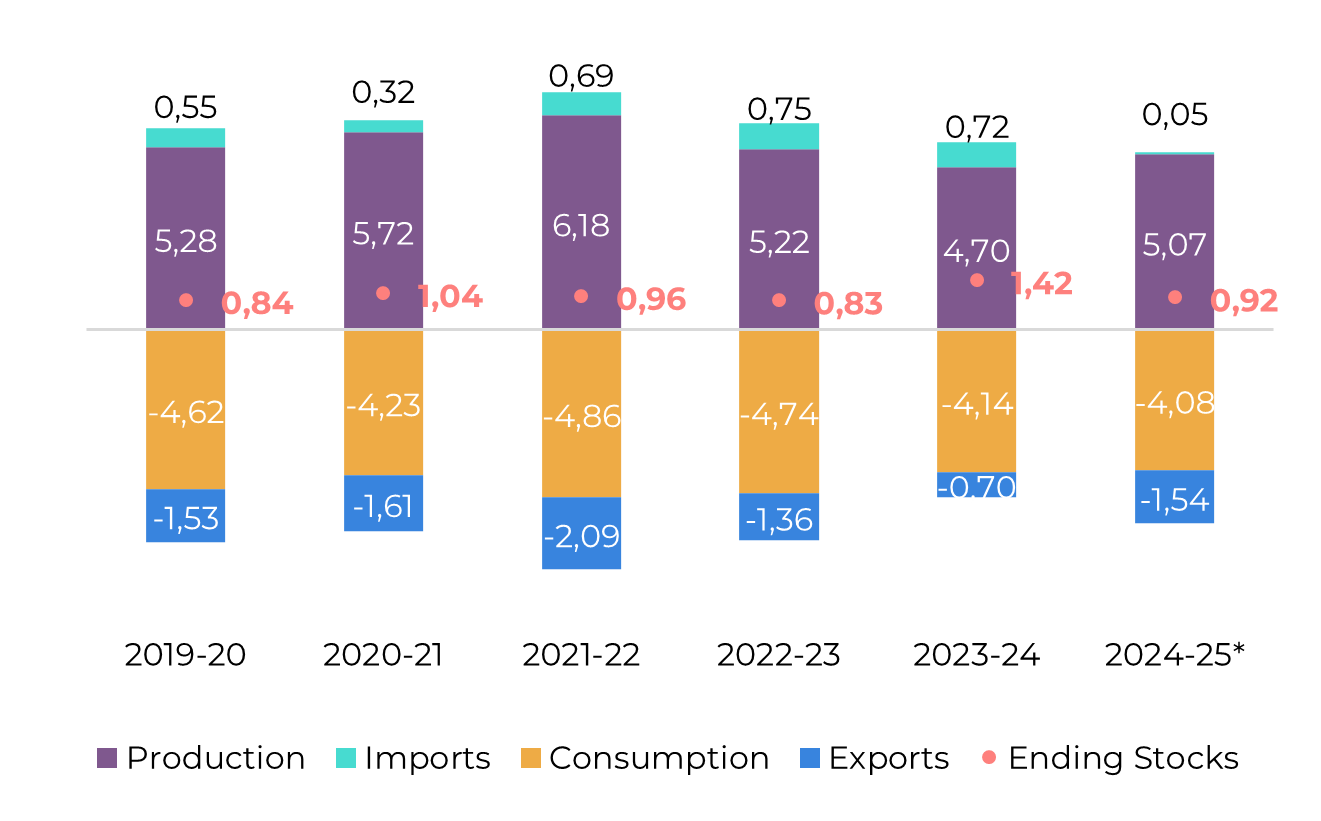
Image 13: Sugar Balance - India (Oct-Sep Mt)

Source: ISMA,AISTA, Hedgepoint
While India has registered weaker results so far, suggesting lower availability than we currently expect, it's important to remember that the country delayed its start by at least two weeks due to rains and end-of-year festivities such as Diwali. As of the end of December, sugar production was lagging by 17.8%, or about 1.7 million metric tons (Mt). However, note that crushing during the month was almost the same, reaching 6.72 Mt in 2024, compared to 6.88 Mt the previous year. The main difference lies in November, when production was 1.5 Mt lower, which could be easily justified by the delay: fewer weeks, less product!
Although we have kept our figures in the higher range for now (closer to 31 Mt), it is worth monitoring this trend, mainly due to undeniable factors such as a higher incidence of disease and a supposedly reduced area for the season. These factors gain strength when you consider that the weather has favored crushing activities, while the latter has failed to recover. So there is a downside to our estimates for India, possibly affecting export capacity.
Our current trade flows account for 1.5 million metric tons (Mt) of exports from India starting in late January/February. If India decides not to export, this would impact our Q1 values. However, the additional availability from Brazil would mitigate some of these effects, especially if demand is willing to wait for the new 25/26 season, with expectations becoming more optimistic due to recent rains in the region.
Image 14: Total Domestic Exports - India ('000t w/o tolling)
Source: ISMA,AISTA, Hedgepoint
Thailand
Image 15: Sugar Balance - Thailand (Dec-Nov Mt)

Source: Thai Sgar Millers, Sugarzone, Hedgepoint
Thailand's expected positive outcome this year can be attributed to favorable weather conditions and the expansion of cane cultivation areas. With most sugar-producing regions receiving above-average rainfall during the cane development window, a fairly good result is expected from the country. Comparing the first 20 days of crushing, Thailand has increased its sugar production by 6%, while also starting the season 4 days earlier compared to 23/24. So far, the country has reached nearly 1.4 million metric tons (Mt) of sugar, a number comparable to the 22/23 season.
Image 16: Total Exports - Thailand ('000t)

Source: Thai Sgar Millers, Hedgepoint
EU 27+UK
Image 17: Sugar Balance - EU 27+UK (Oct-Sep Mt)
Source: EC, Greenpool, Hedgepoint
Europe and the UK's sugar production estimates have remained unchanged for the period. According to the European Commission (EC), the region sowed 1,484 thousand hectares and is expected to achieve yields of about 11 tons per hectare, resulting in a production of 16.6 million tons of sugar (white value). Including the UK's expectations, total availability should reach close to 17.5 million tons. With a 1-million-ton diversion to ethanol, sugar production might stay at 16.5 million tons.
Mexico
Image 18: Sugar Balance - Mexico (Oct-Sep Mt)
Source: Conadesuca, Greenpool, Hedgepoint
By the end of November, Mexico had produced only 62kt of sugar, marking a significant decline compared to previous seasons. However, this figure should be interpreted with caution. Notably, 23 out of 41 mills either delayed their start or have yet to begin operations. Consequently, a smaller area was harvested, and less cane was crushed, but yields are showing signs of improvement.
As of January 4, the country has crushed 7.4Mt of cane, which is 1.4Mt less than in the 23/24 season. In terms of sugar production, Mexico has reached 661kt, nearly 95kt less than last year, but with a healthier industrial recovery of 6.93 tons of sugar per hectare (ts/ha) compared to 6.3ts/ha in the 23/24 season. This allows us to keep the optimism regarding the country, which could recover to 5Mt of total production, allowing exports to move back to the 1Mt level.
Image 19: Total Exports - Mexico ('000t)
Source: Conadesuca, Greenpool, Hedgepoint
USA
Image 20: Sugar Balance - US (Oct-Sep Mt)
Source: USDA, Hedgepoint
The USDA has reduced beet sugar production to 4.68Mt for the 24/25 season, a decrease of 170kt compared to November's values. This reduction is primarily due to restricted availability from beet molasses. Additionally, cane sugar production has been revised down by 74kt, while imports have been increased by 324kt compared to previous estimates for the season. Taking 23/24, imports are expected to be nearly 850kt lower in 2024/25, reflecting high ending stocks from the previous season. In terms of production, current USDA estimates show little change from the previous year, remaining close to 8.4Mt.
Mexico's expected recovery has allowed the country to plan for a higher import volume compared to figures shared in November. However, when it comes to past crops, the U.S. is expected to maintain a reduced dependency on Mexico, importing roughly 550kt from their key commercial partner.
Guatemala
Image 21: Sugar Balance - Guatemala (Oct-Sep Mt)
Source: Cengicaña, Sieca, Azucar.gt,Greenpool, Hedgepoint
Image 22: Total Exports - Guatemala ('000t)
Source: Sieca, Hedgepoint
Ukraine
Image 23: Sugar Balance - Ukraine (Mt Sep-Aug)
Source: Ukrsugar, Sugar.ru, Greenpool, hEDGEpoint
According to Ukrsugar, during 2024, the domestic sugar industry in Ukraine achieved a milestone, with sugar producers exporting a record 746.3 thousand tons of sugar, generating $419 million in revenue. This marks the highest annual sugar export figure since the establishment of the National Association of Sugar Producers of Ukraine in 1997.
Russia
Image 24: Sugar Balance - Russia (Mt Sep-Aug)

Source: Ikar, Sugar.ru, Greenpool, Hedgepoint
China
Image 25: Sugar Balance - China (Oct-Sep Mt)

Source: GSMN, CSA, Refinitiv, Greenpool, Hedgepoint
Obs: stocks also account for bonded warehouses volume and imports include syrup and smuggling estimates
Image 26: Total Imports - China ('000t - exc. syrup and smuggling)
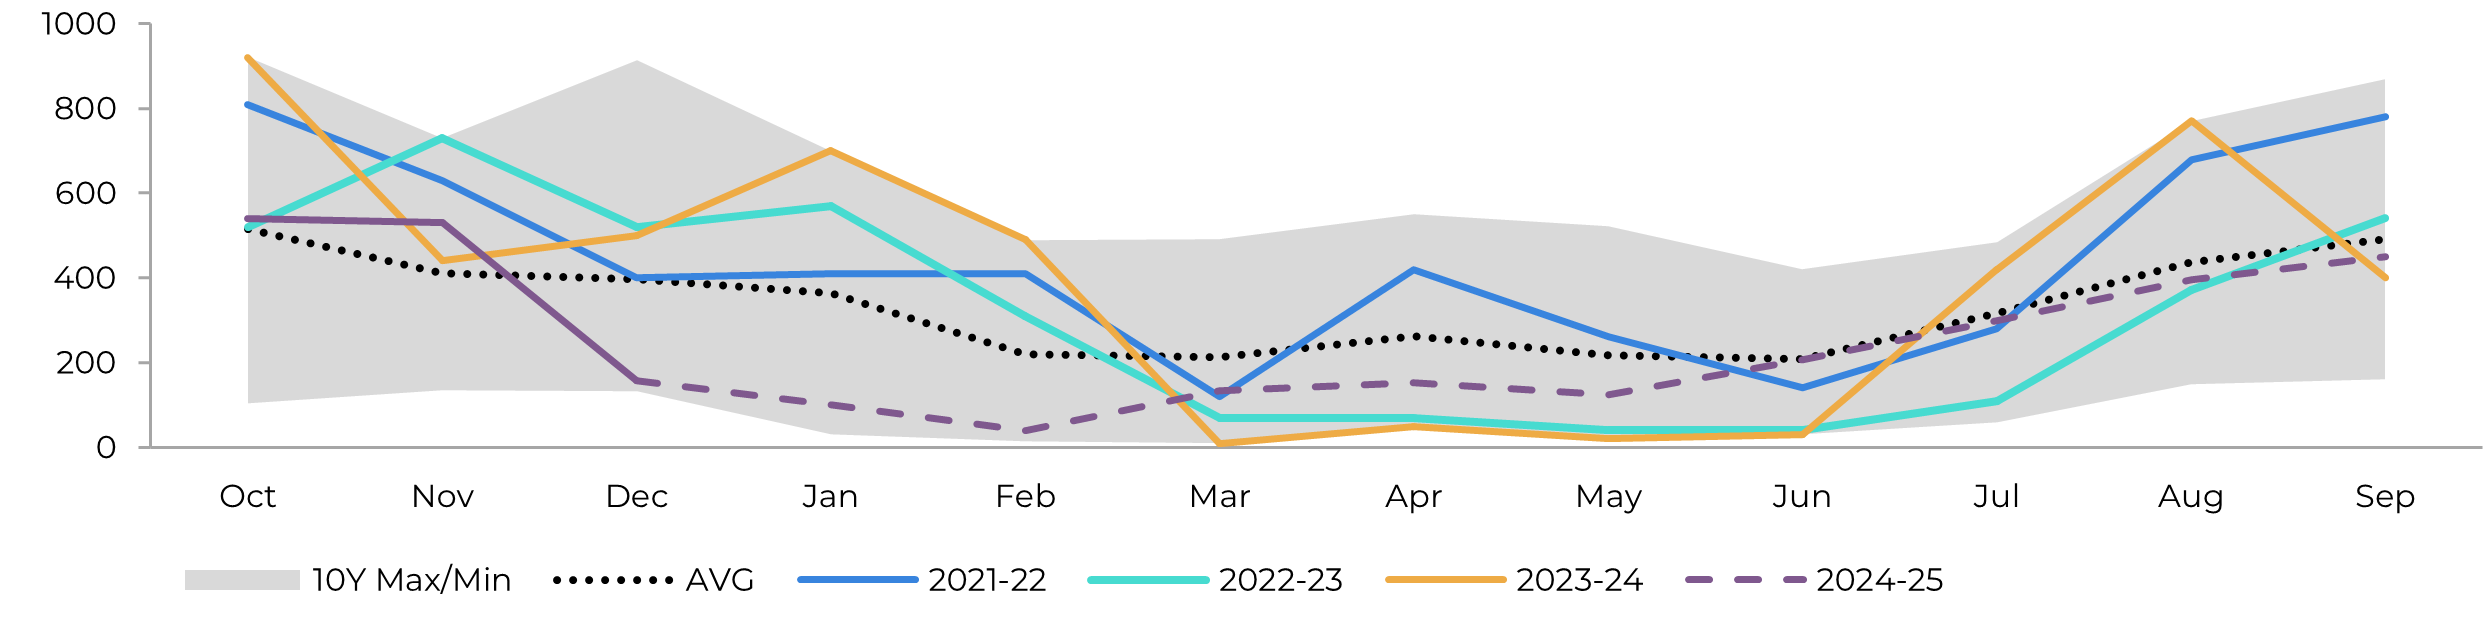
Image 27: Total Production - China ('000t)
Source: GSMM, Hedgepoint

Source: CSA, Refinitiv, Greenpool, Hedgepoint
Weekly Report — Sugar and Ethanol
livea.coda@hedgepointglobal.com
laleska.moda@hedgepointglobal.com
Sugar and Ethanol Desk
murilo.mello@hedgepointglobal.com
vipul.bhandari@hedgepointglobal.com
gabriel.oliveira@hedgepointglobal.com
etori.veronezi@hedgepointglobal.com
jose.torreao@hedgepointglobal.com
Disclaimer
This document has been prepared by Hedgepoint Schweiz AG and its affiliates (“Hedgepoint”) solely for informational and instructional purposes, without intending to create obligations or commitments to third parties. It is not intended to promote or solicit an offer for the sale or purchase of any securities, commodities interests, or investment products.
To access this report, you need to be a subscriber.


Contact us
Check our general terms and important notices.
We have updated our Terms & Conditions to reflect improvements to our platform, data handling practices, and the overall experience we provide to our clients.