
S&D and Trade Flow Update - 2025 04 30
"It has been a very volatile year, marked by significant macroeconomic changes. President Donald Trump’s “liberation day” has raised numerous questions about its potential impact on the global economy and supply chains. Sugar has not been immune to these effects and has since corrected sharply. Unlike other soft commodities such as coffee and cocoa, sugar’s availability is expected to be more comfortable. This trend is primarily due to healthy expectations regarding the Brazilian Center-South 25/26 results, especially following strong 24/25 final figures despite last year’s dryness and fires."
S&D and Trade Flow
It has been a very volatile year, marked by significant macroeconomic changes. President Donald Trump’s “liberation day” has raised numerous questions about its potential impact on the global economy and supply chains. Sugar has not been immune to these effects and has since corrected sharply. The risk-off sentiment contributed to this movement, but the difficulty sugar has faced in recovering ground after a partial stability with the 90-day break and universal tariff (for countries other than China) is largely attributed to its own fundamentals.
Unlike other soft commodities such as coffee and cocoa, sugar’s availability is expected to be more comfortable. This trend is primarily due to healthy expectations regarding the Brazilian Center-South 25/26 results, especially following strong 24/25 final figures despite last year’s dryness and fires. The anticipation that the region might add to trade flows has prevented prices from recovering. This week, the expectation of a large May delivery has added to this bearish stance, with traders expecting close to 2Mt being delivered, mostly from the Center-South.
In the short term, demand has also contributed to the bearish outlook. Economic turmoil has left many destinations seemingly dormant. For instance, China has not taken advantage of an open import arbitrage, estimated for non-producing regions, a possible result of a higher domestic availability coupled with economic challenges.
However, some risks, though still rather weak, should not be overlooked. The Center-South region experienced adverse weather conditions between February and March, and the full impact remains uncertain. Additionally, final 24/25 results from India and Thailand in the Northern Hemisphere have fallen short of initial expectations, potentially limiting export availability for the next season (25/26). The prospect of a supply and demand balance deficit, heavily reliant on stocks - as the anticipated export of at least 700kt from India would reduce its stocks to levels similar to 22/23 - could be concerning in the long term, especially if there are any surprises affecting Brazil's 25/26 availability.
Therefore, monitoring the 25/26 crop development in the Northern Hemisphere is becoming increasingly important as we approach its key development window between June and August for most countries. Additionally, keeping an eye on the Center-South’s first results is essential. The first part of the season was heavily impacted by the 2024 drought, so the initial Unica reports are expected to show poorer results, potentially adding volatility to the market. Key indicators such as yields, and the Vegetation Health Index will be crucial in understanding the extent of the bearish trend.
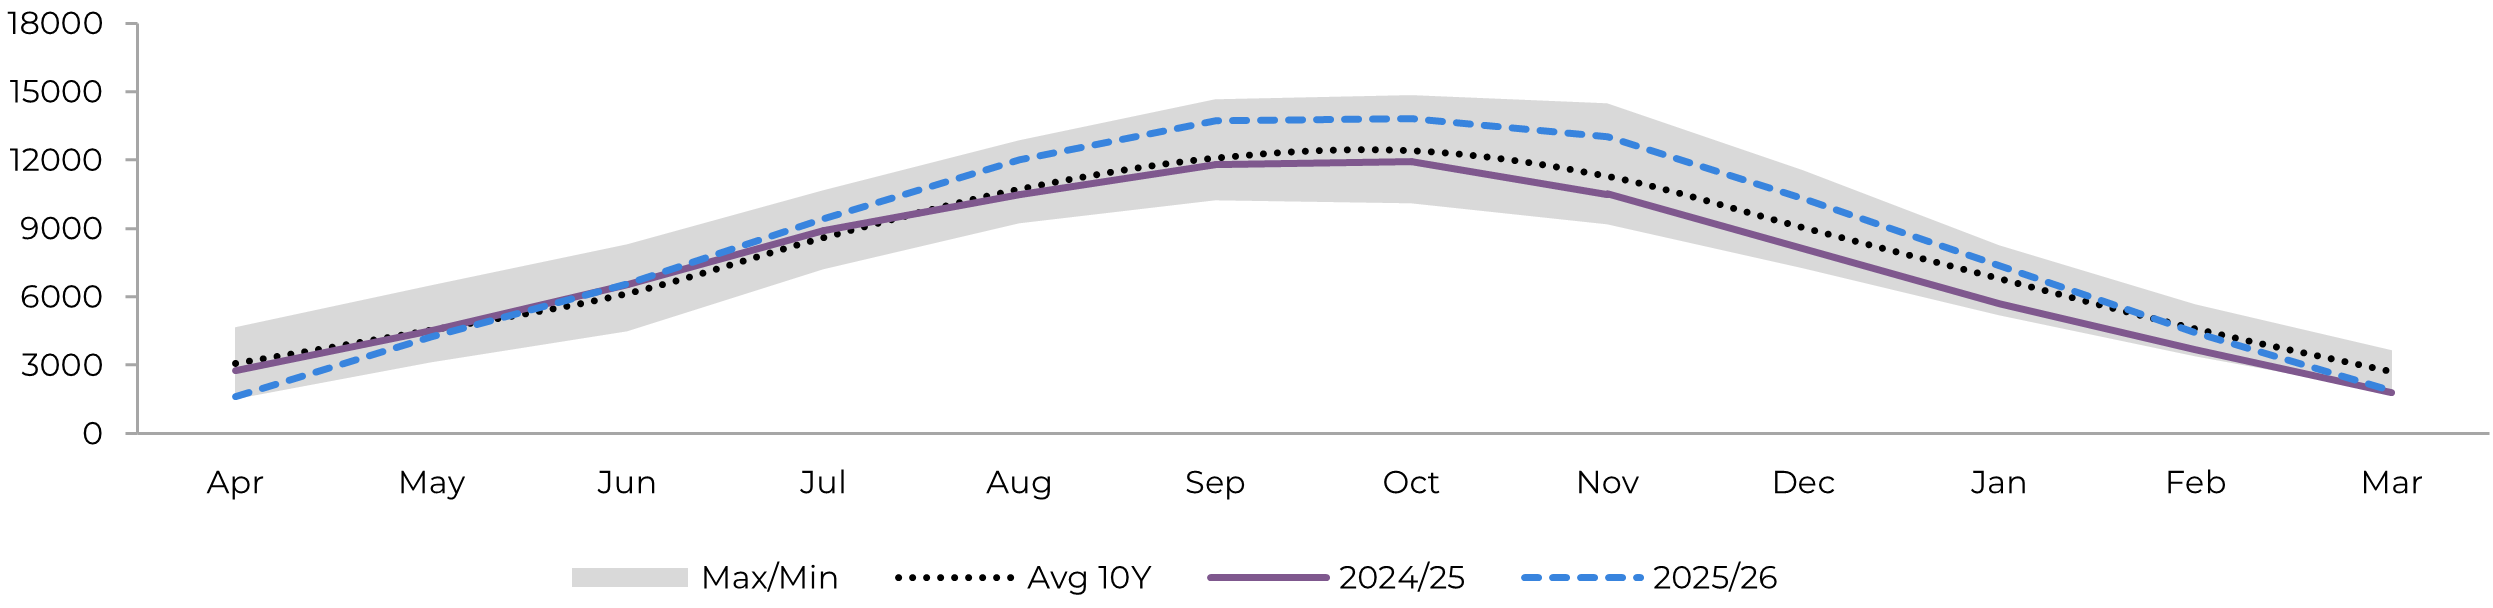
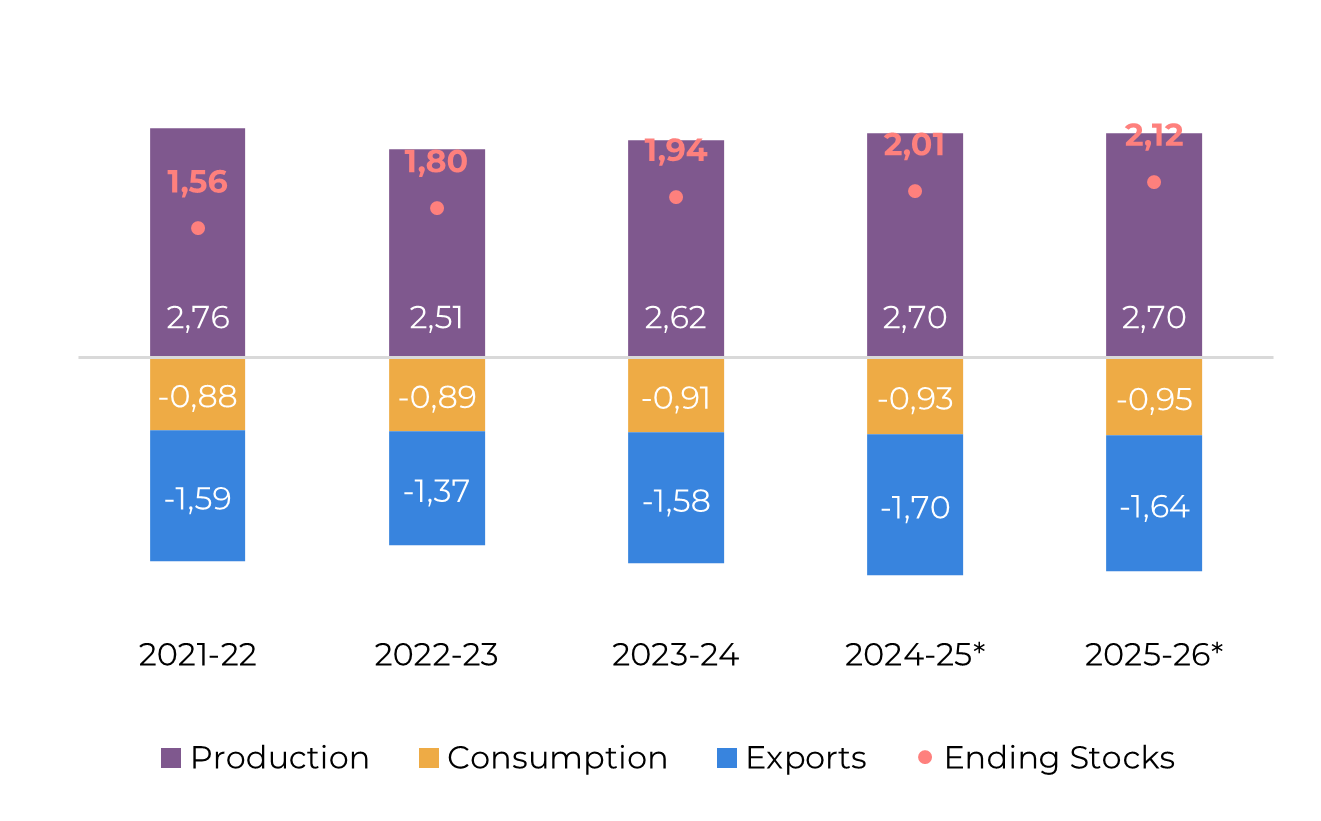
Image 1: Total Trade Flow ('000t)
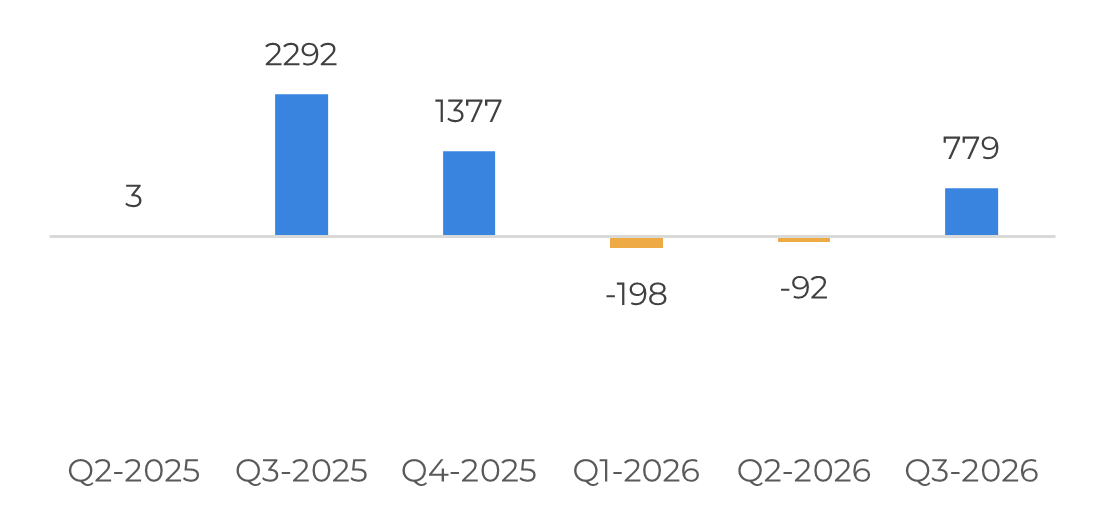
Source: Hedgepoint
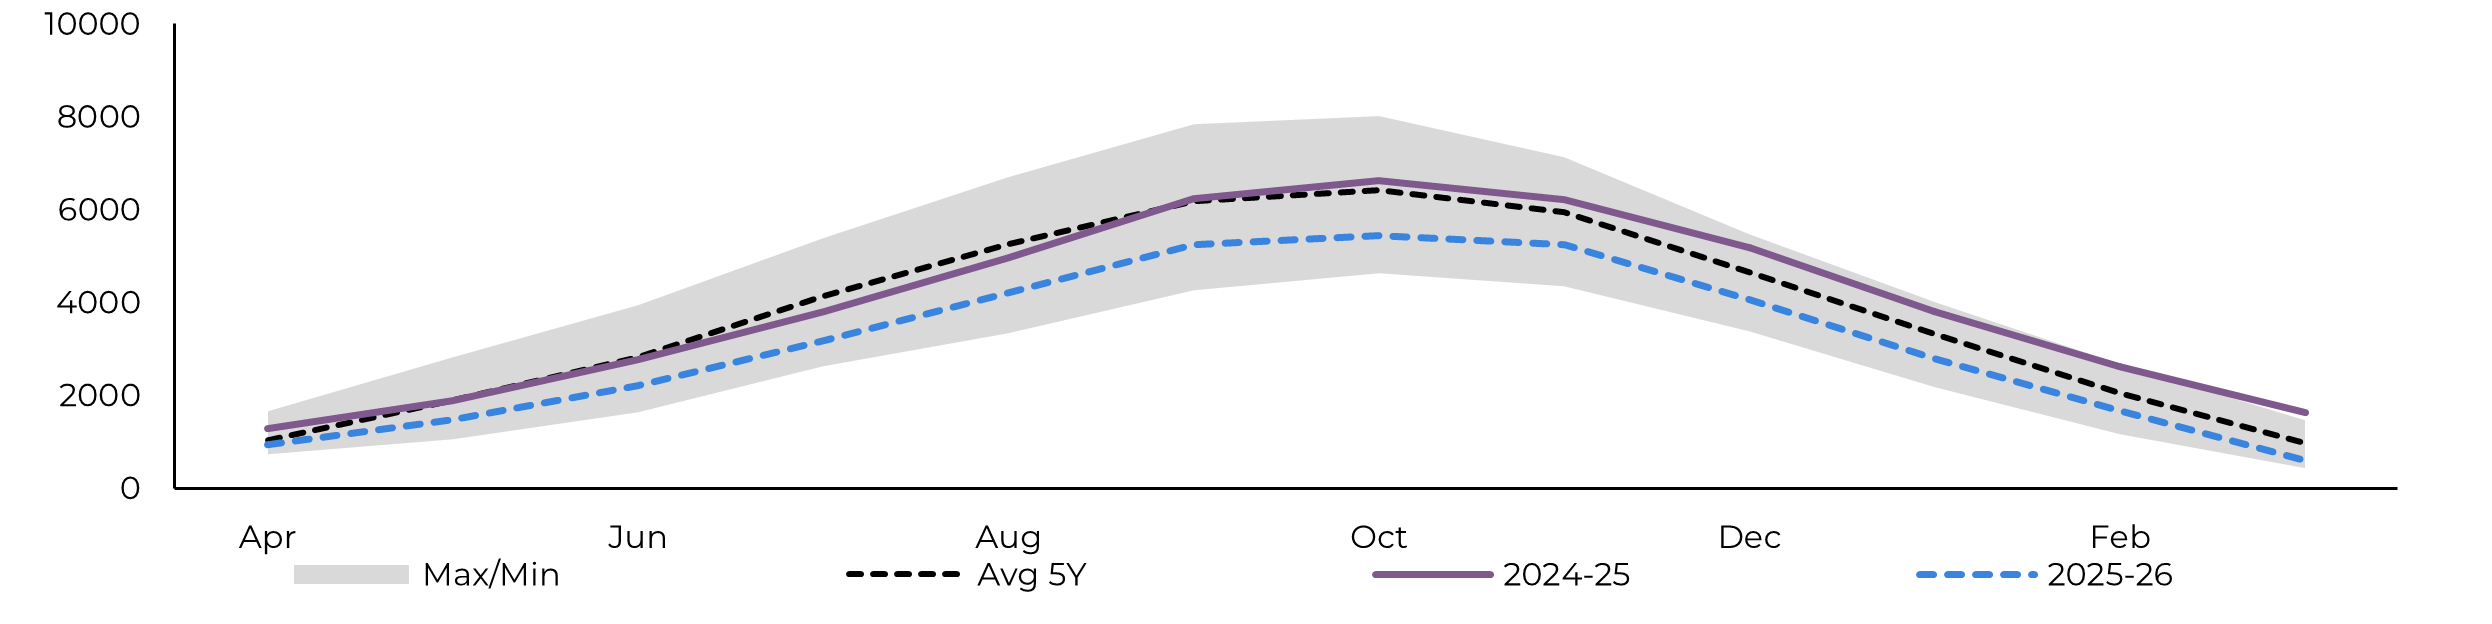
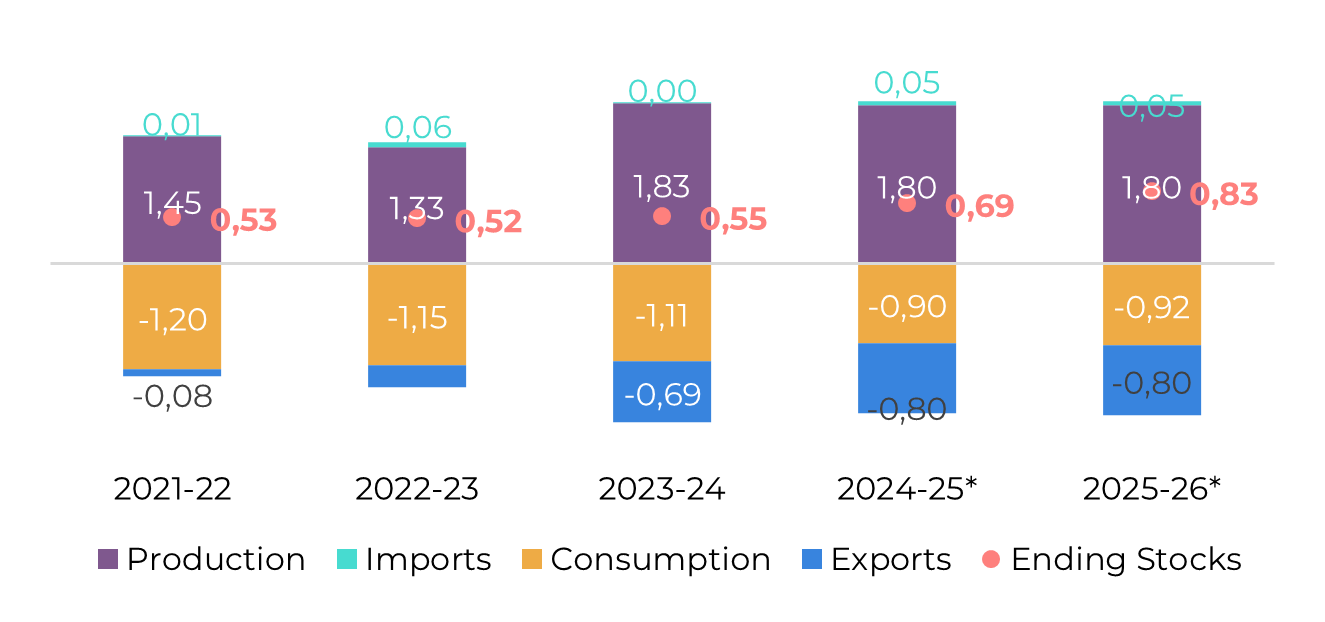
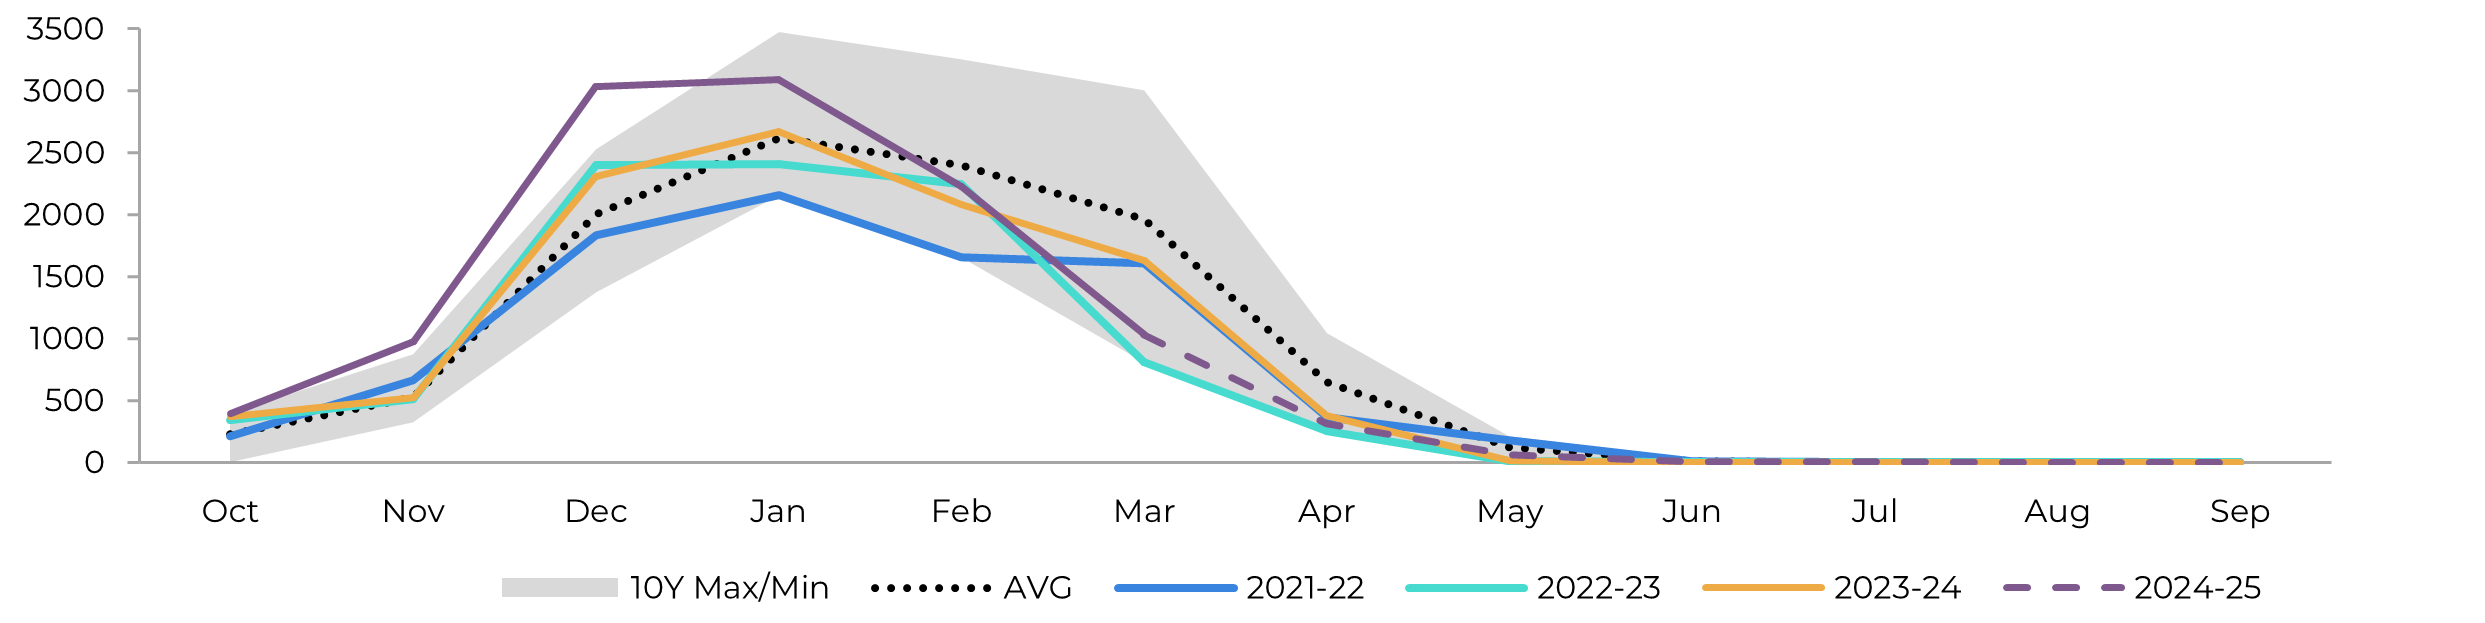
Image 2: Raw's Trade Flow ('000t)
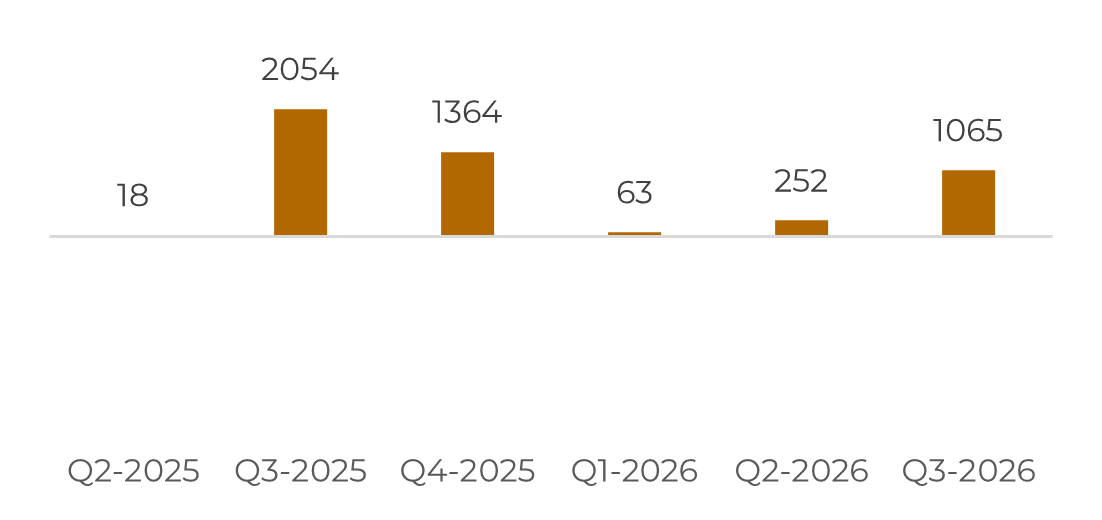
Source: Hedgepoint
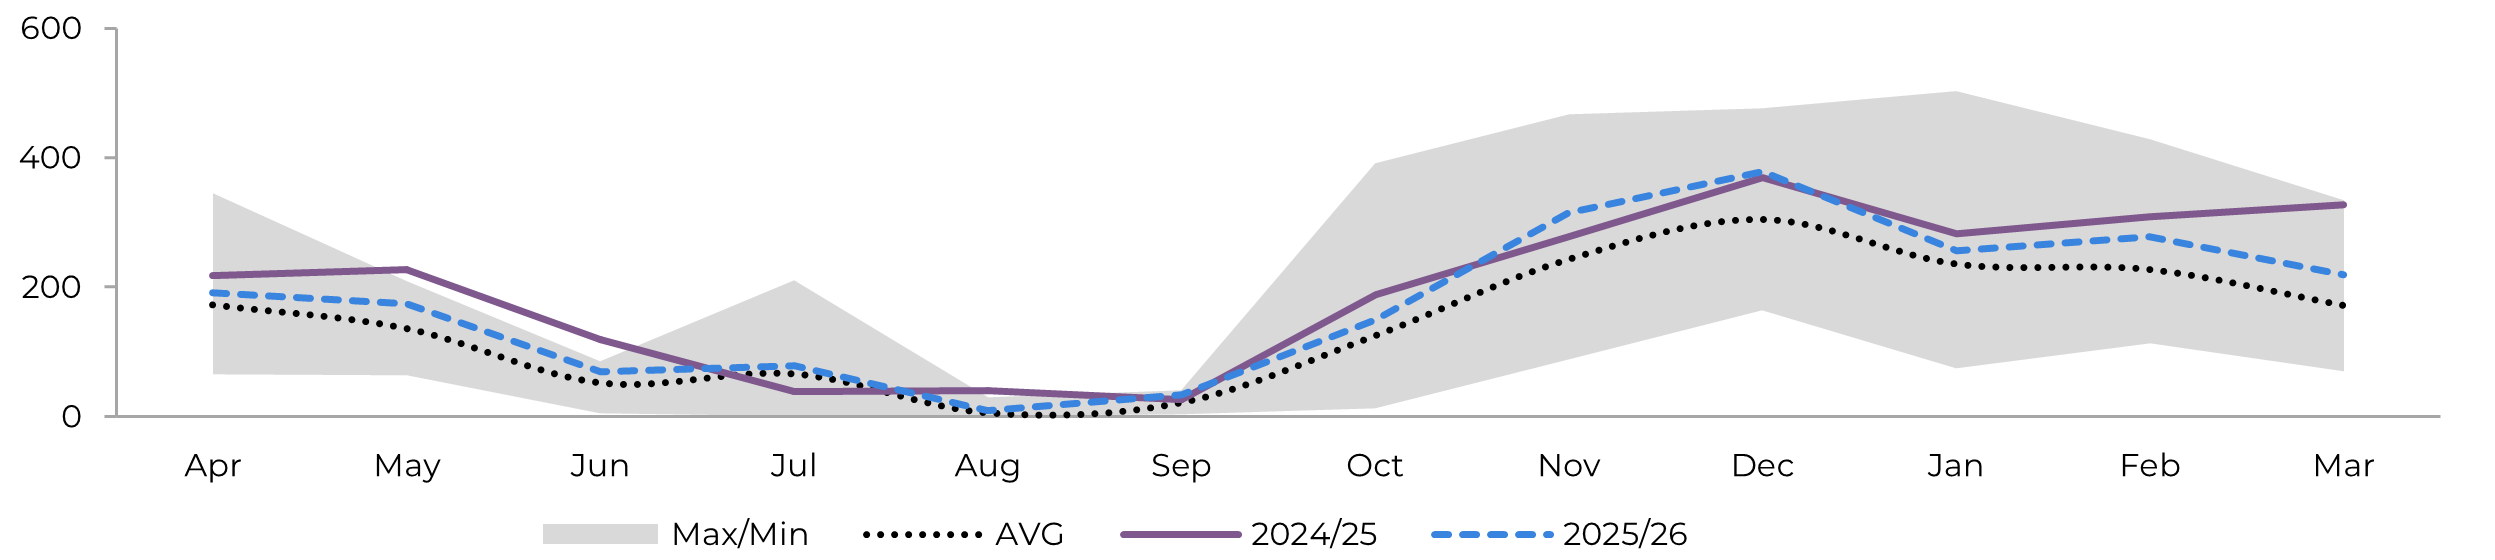
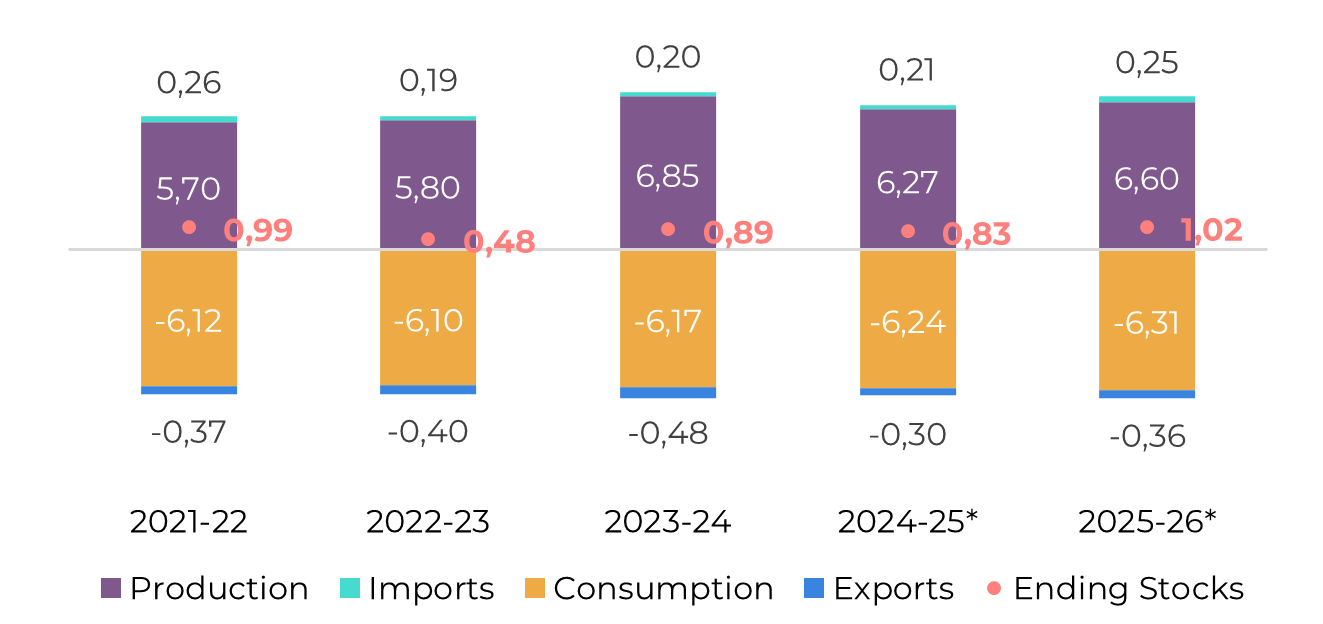
Image 3: White's Trade Flow ('000t)
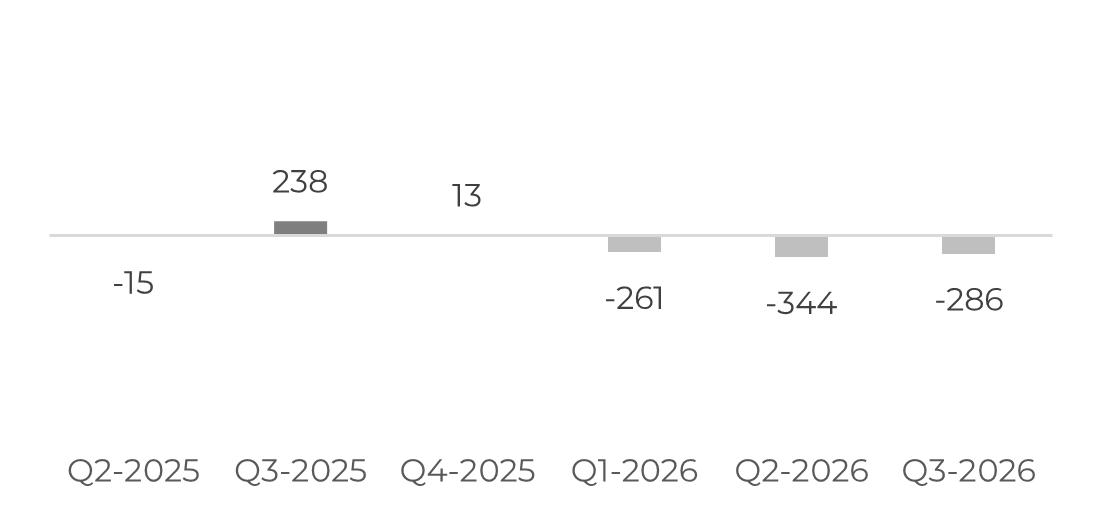
Source: Hedgepoint
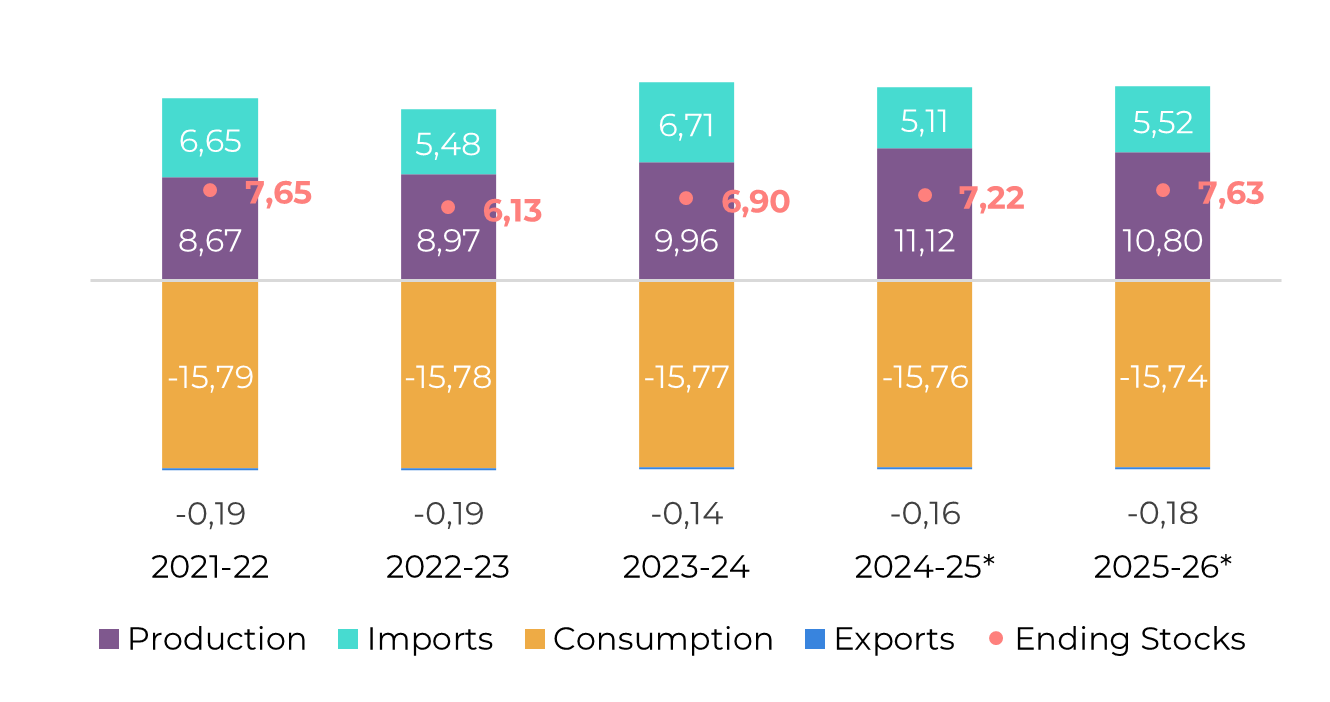
Image 4: Global Supply and Demand Balance (MT RV oct-sep)
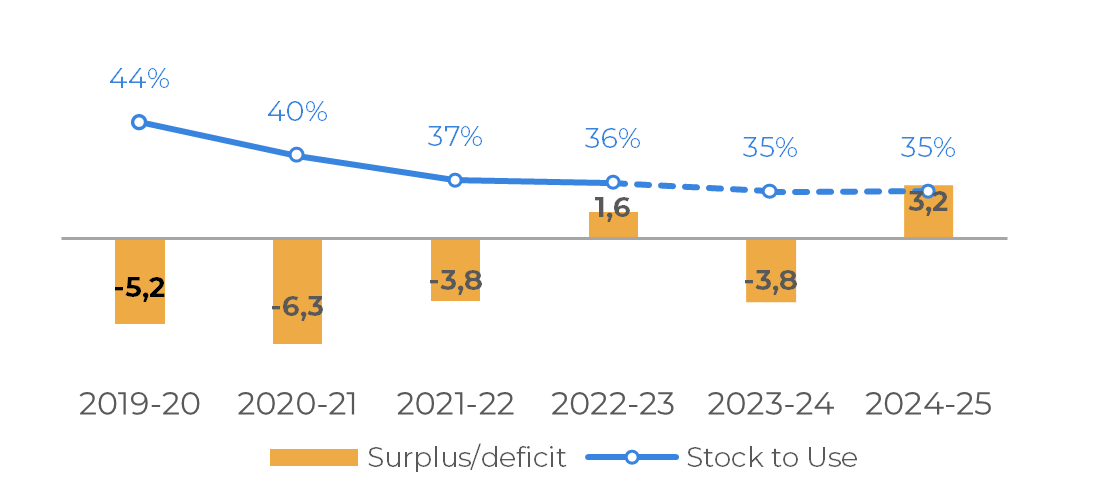
Source: Hedgepoint
Brazil CS
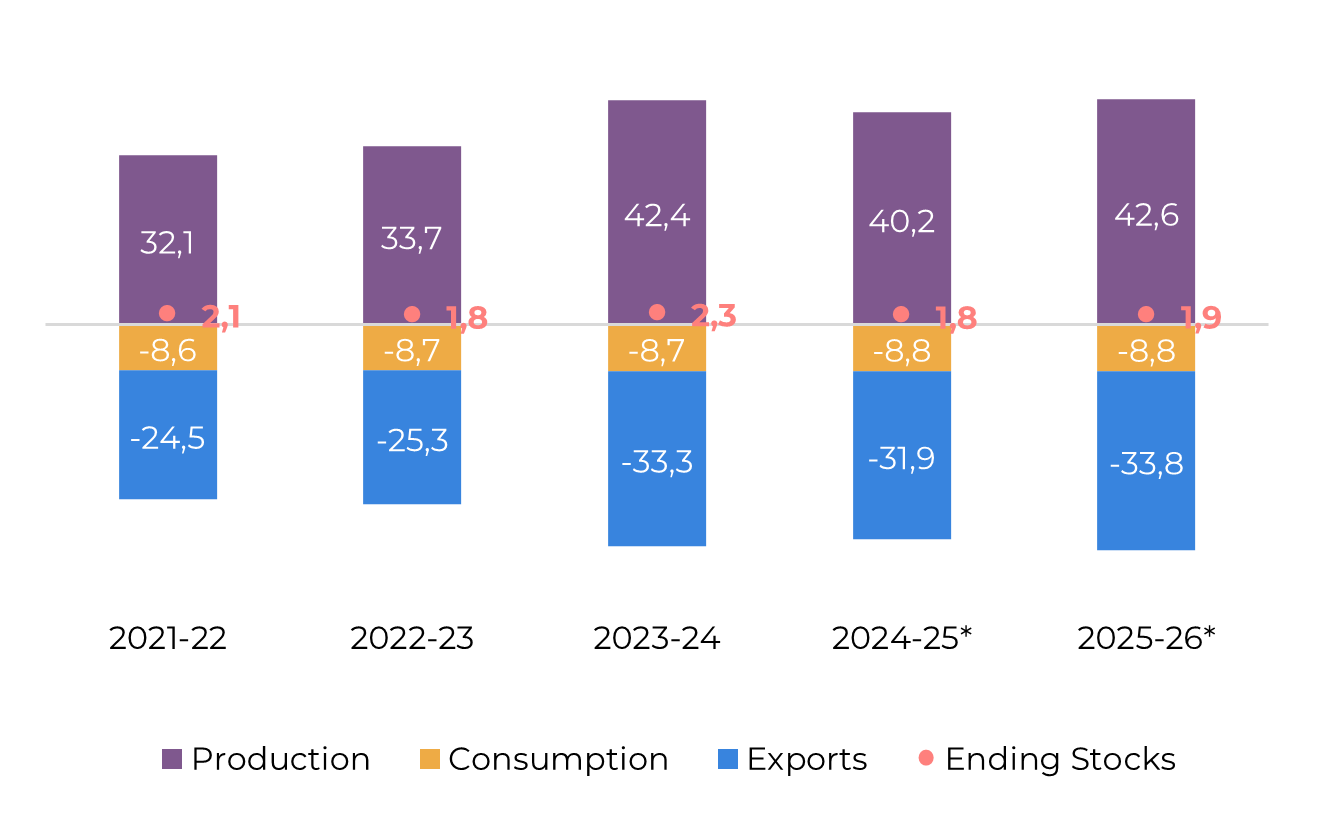
Image 5: Sugar Balance - Brazil CS (Apr-Mar Mt)
Source: Unica, MAPA, SECEX, Hedgepoint
The Brazilian Center-Sout (CS) 24/25 season ended with higher-than-expected numbers despite facing challenges such as a dry winter and a spring marked by wildfires and arsenals. Although there was a 9.5% reduction in agricultural yields compared to the record year of 23/24, the TCH (78.8 t/ha) was still 3% above average. This allowed total cane crushing to reach its second-highest value in recent history.
A 5% growth in area also contributed to this result. Cane crushing reached 621.2Mt, with 40.2Mt of sugar being produced and exports hitting 31.8Mt, an incredibly healthy outcome. However, the 24/25 season experienced a lower sugar mix than mills aimed for, primarily due to poor raw material conditions, particularly a higher concentration of reducing sugars.
Looking ahead to the next season, February and March 2025 showed poor rainfall, reducing soil moisture and raising concerns among producers. Despite a decline in the Vegetation Health Index (VHI – estimated for CS based on NOAA’s state wise publication) during late February and early March, recent rainfall has improved cane health, pushing the VHI back above average and well above the theoretical stress level of 40. Over the past three consecutive weeks, the index has registered improvements for the entire CS region, suggesting that the dryness effects might not have been as severe as initially thought. Monitoring these aspects remains critical to understanding the next season's capacity.
Considering the weather’s latest adversity, our estimates have been revised marginally down from 630Mt to 621.2Mt. With a higher sugar mix expected in 25/26 (51% versus 48% in 24/25), production is anticipated to exceed 42.5Mt, contributing more than 33Mt to global trade flows. This high availability from the region is the main bearish factor affecting sugar prices.
Image 6: Total Exports - Brazil CS ('000t)
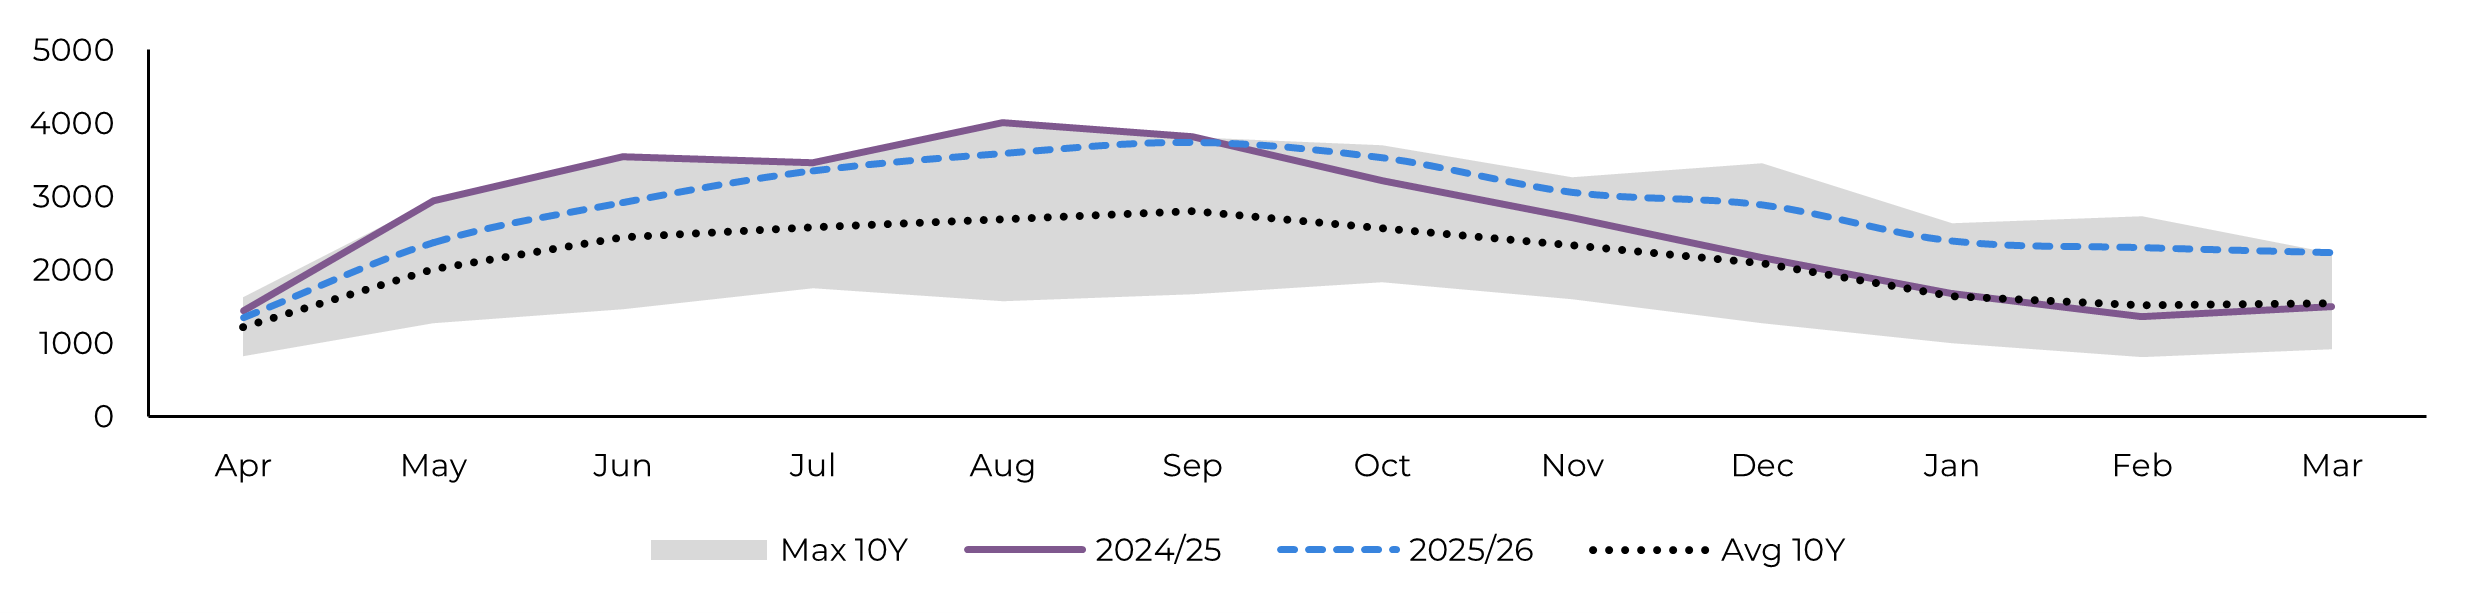
Image 7: Total Stocks - Brazil CS ('000t)
Source: SECEX, Williams, Hedgepoint
Source: Unica,MAPA, SECEX, Williams, Hedgepoint
Brazil CS Ethanol
Image 8: Otto Cycle - Brazil CS (M m³)
Source: ANP, Bloomberg, Hedgepoint
Due to the lower-than-expected sugar mix, ethanol production thrived and reached a record high during the 24/25 season. Total production nearly touched 35 billion liters, specifically 34.96 billion liters , marking a 4% growth compared to the previous record in 23/24. Corn ethanol played a significant role in this achievement, reaching 8.2 billion liters, a 30.7% increase, and accounting for 23.43% of total production.
Image 9: Anhydrous Ending Stocks - Brazil CS ('000 m³)
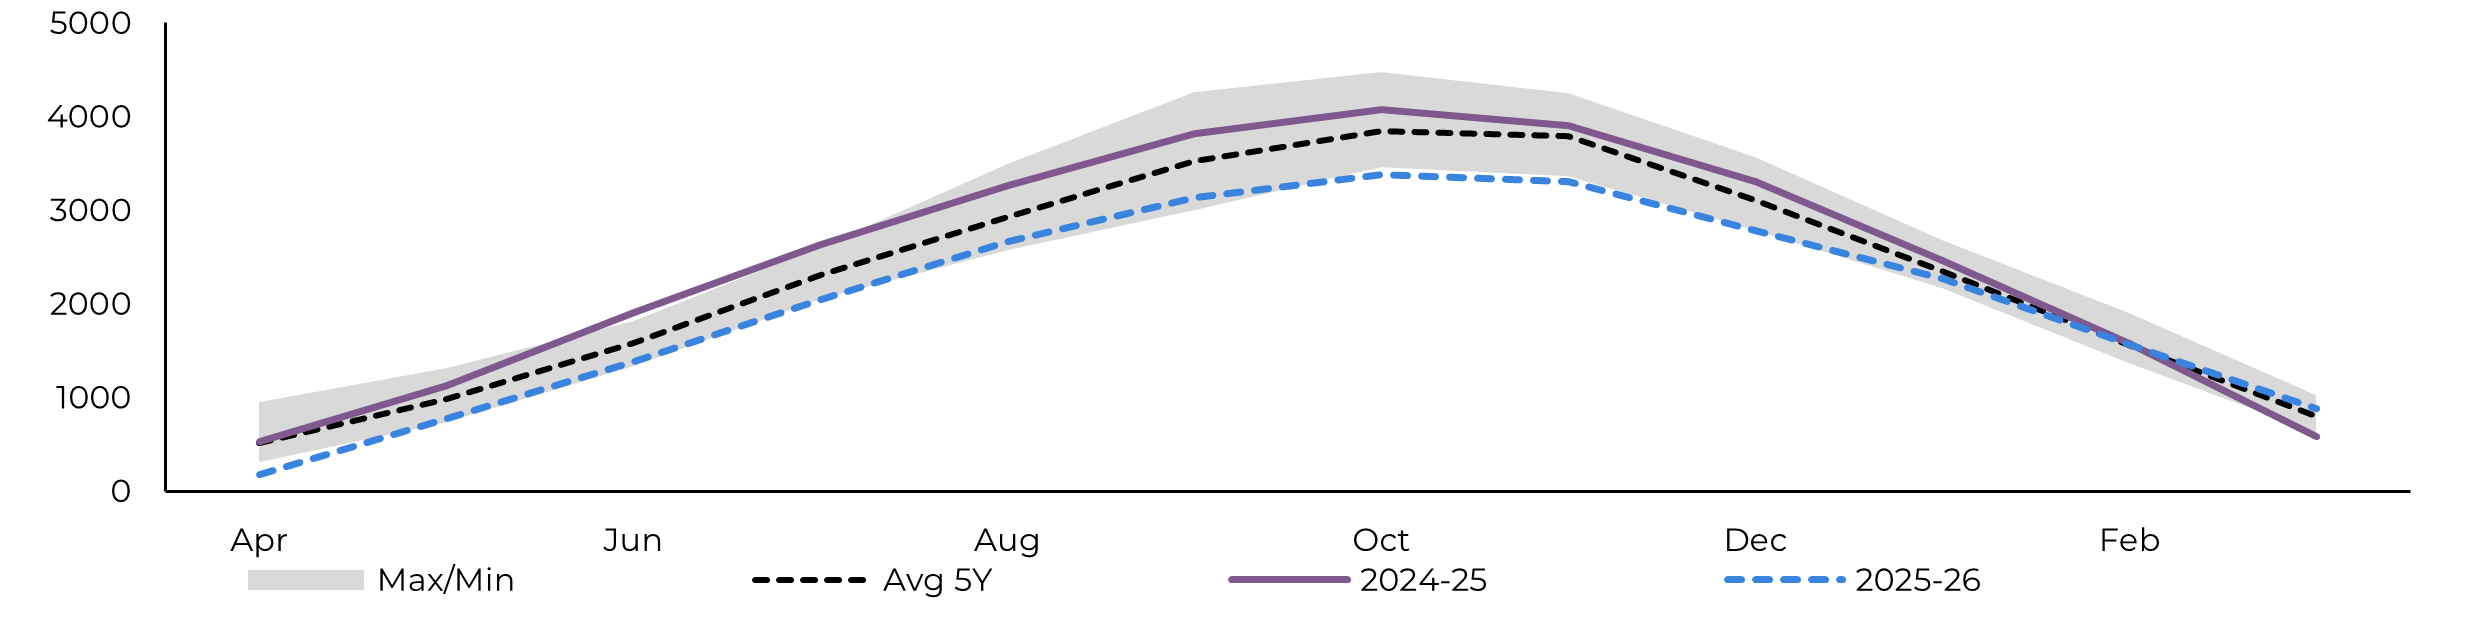
Image 10: Hydrous Ending Stocks - Brazil CS ('000 m³)
Source: Unica, MAPA, ANP, SECEX, Hedgepoint
Source: Unica, MAPA, ANP, SECEX, Hedgepoint
Brazil NNE
Image 11: Sugar Balance - Brazil NNE (Apr-Mar Mt)
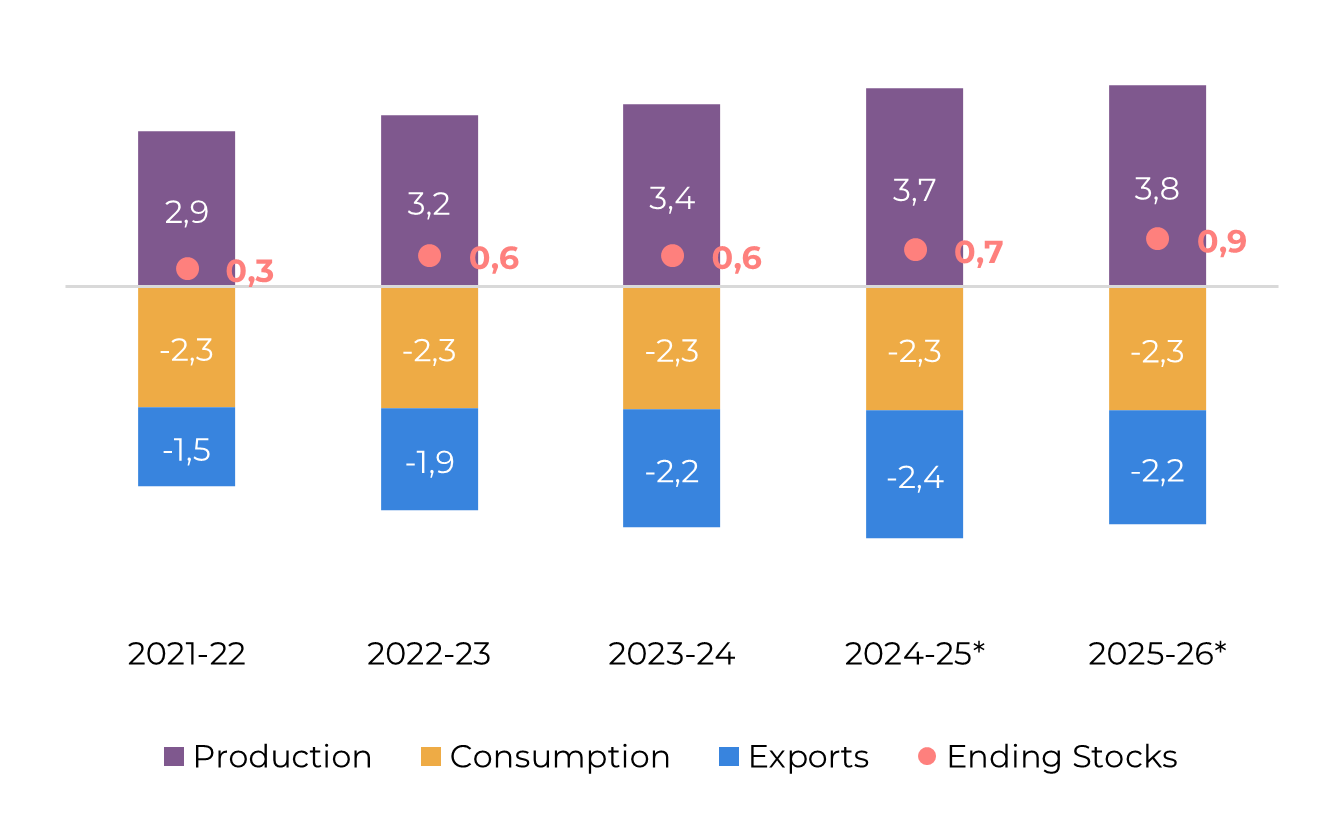
Source: MAPA, SECEX, Hedgepoint
The North-Northeast (NNE) region achieved a sugar production of 3.7Mt in the 24/25 season (considering an April-March window), meeting expectations and exporting 2.4Mt, a figure not seen since the 12/13 season. This was a strong performance.
For the 25/26 season, we anticipate the region to have marginally similar results, although with a slight reduction in cane (-2%) and a higher ATR (+1%). The sugar mix is also expected to increase compared to the previous season, thanks to investments in crystallization. From approximately 50%, we expect the region’s mix to reach 50.8%.
Image 12: Total Exports - Brazil NNE ('000t)
Source: SECEX, Hedgepoint
India
Image 13: Sugar Balance - India (Oct-Sep Mt)
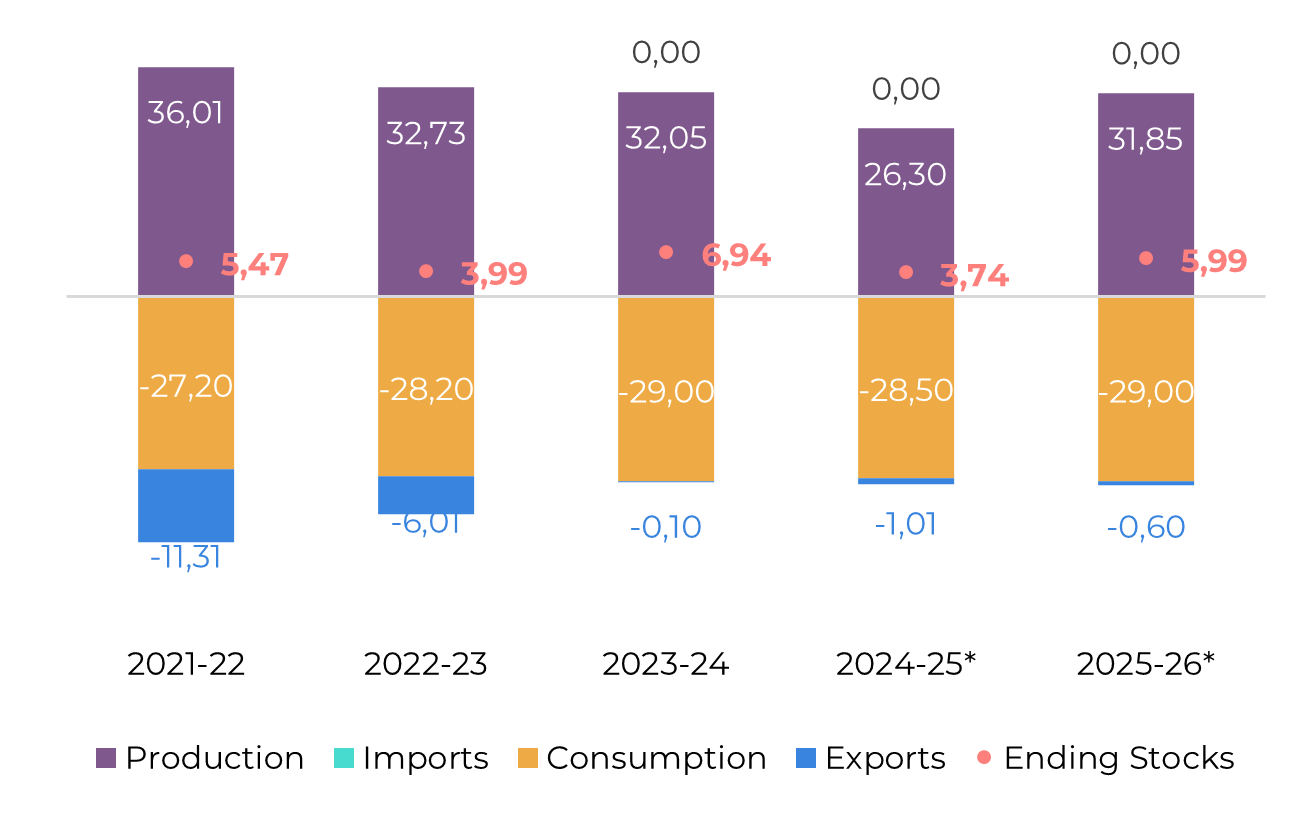
Source: ISMA,AISTA, Hedgepoint
Regarding India, we initially resisted reducing sugar production. However, February and March results showed a significant year-on-year decline of 20% and 38%, respectively. Consequently, we lowered total production estimates to 26.3Mt, reflecting a 14% drop in area and a 4% reduction in cane yield. From the initially expected 4.5Mt of sugar diverted to ethanol, the country is now expected to reach only 3.7Mt.
With lower availability, domestic prices have risen by about 6% year-on-year. Additionally, the absence of elections in 2025 and cooler temperatures are expected to impact demand during the 24/25 season, reducing it from nearly 29Mt in 23/24 to 28.5Mt in 24/25. Approximately 1Mt is expected to be exported, with the Indian Sugar Mills Association (ISMA) recently announcing that the country will only use 700kt of its quota. This situation pressures stocks to levels similar to those in 22/23, the year before the export bans.
Therefore, India's current poor performance raises doubts about the possibility of exports in 25/26, even with a predicted recovery due to planting and expected favorable weather. We remain optimistic, estimating that nearly 600kt will leave the country in the next season, but we do not rule out the possibility of export bans.
Image 14: Total Domestic Exports - India ('000t w/o tolling)
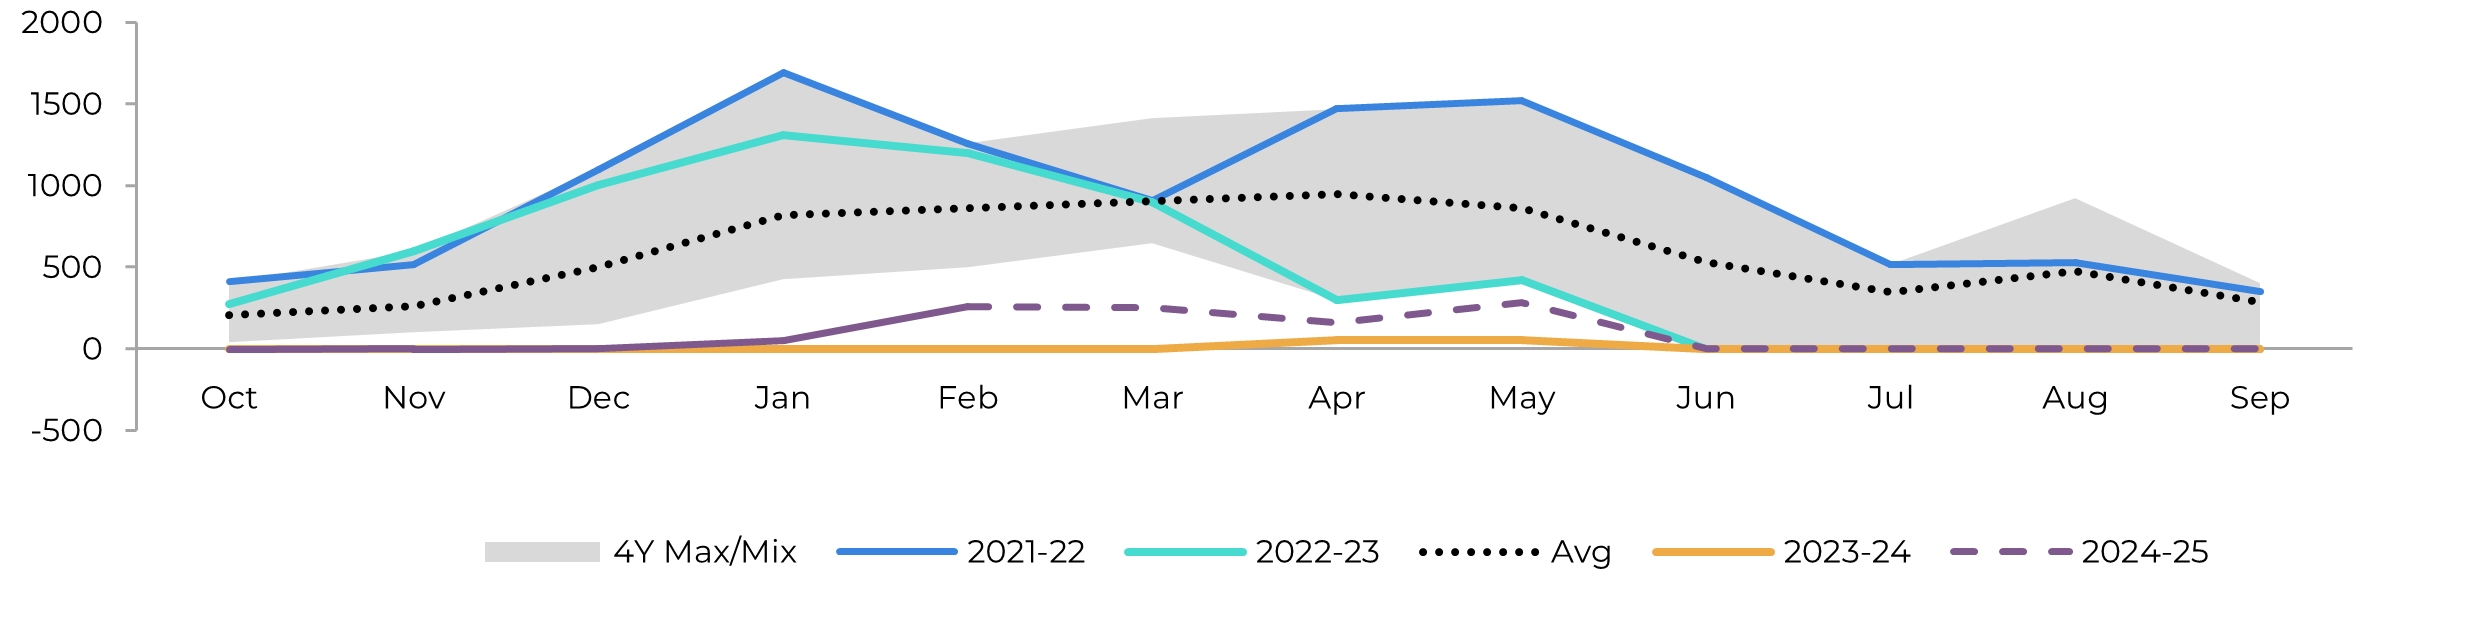
Source: ISMA,AISTA, Hedgepoint
Thailand
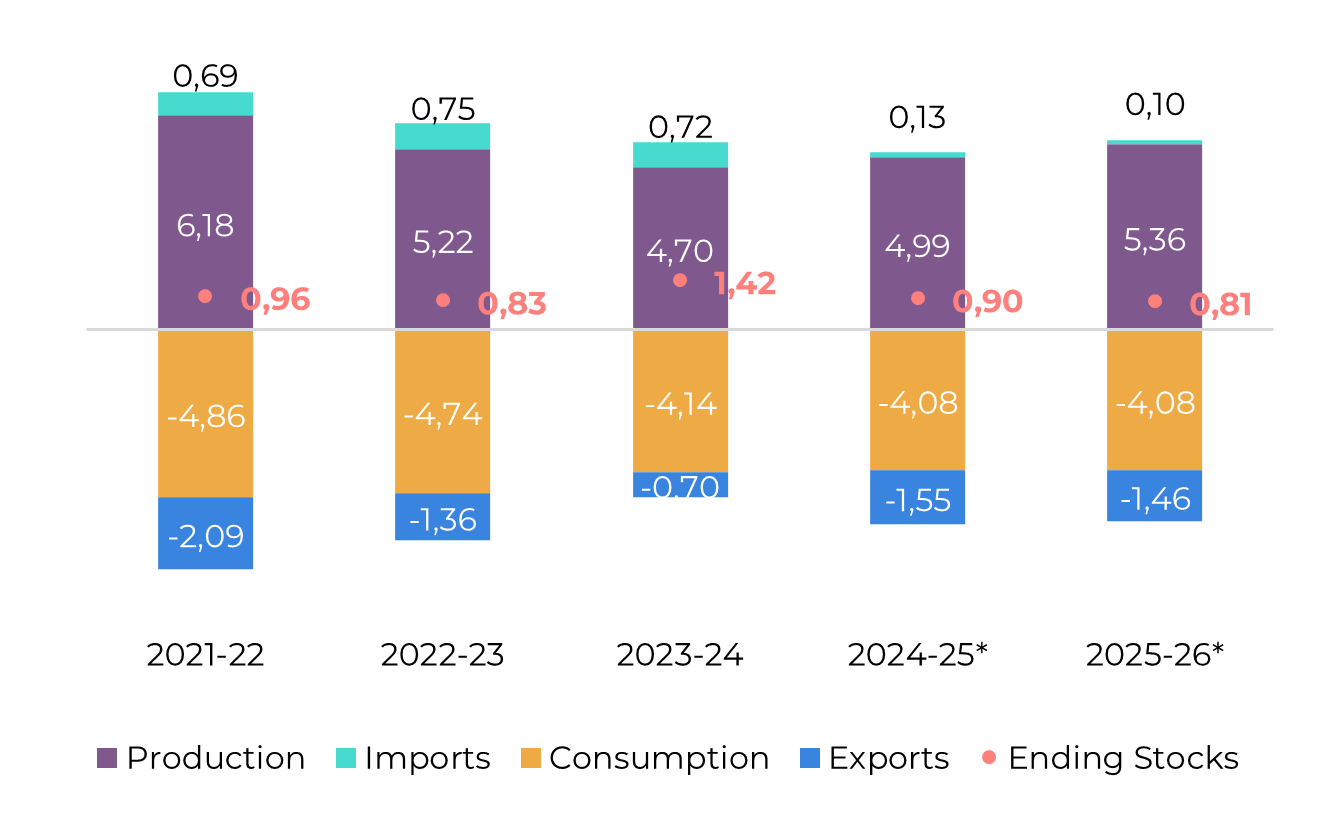
Image 15: Sugar Balance - Thailand (Dec-Nov Mt)
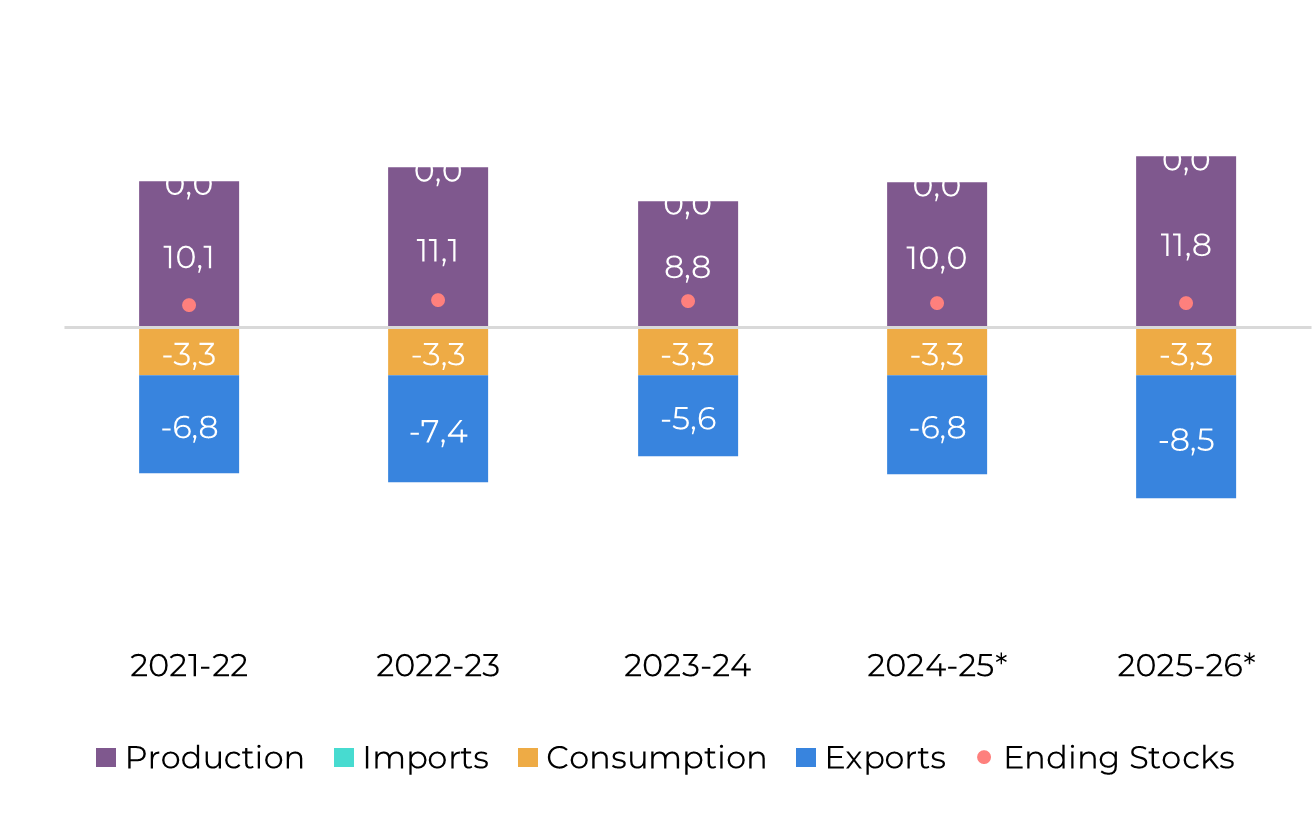
Source: Thai Sgar Millers, Sugarzone, Hedgepoint
Thailand’s 24/25 season has ended, with the country crushing 92Mt of cane, of which 78.3Mt were fresh cane and 13.7Mt were burnt. In terms of sugar production, Thailand produced 10Mt, representing a 14% growth compared to 23/24. However, this figure is still below the initial expectations, which were closer to 11Mt. Poor weather conditions, particularly during the crushing season, contributed to this shortfall.
Image 16: Total Exports - Thailand ('000t)
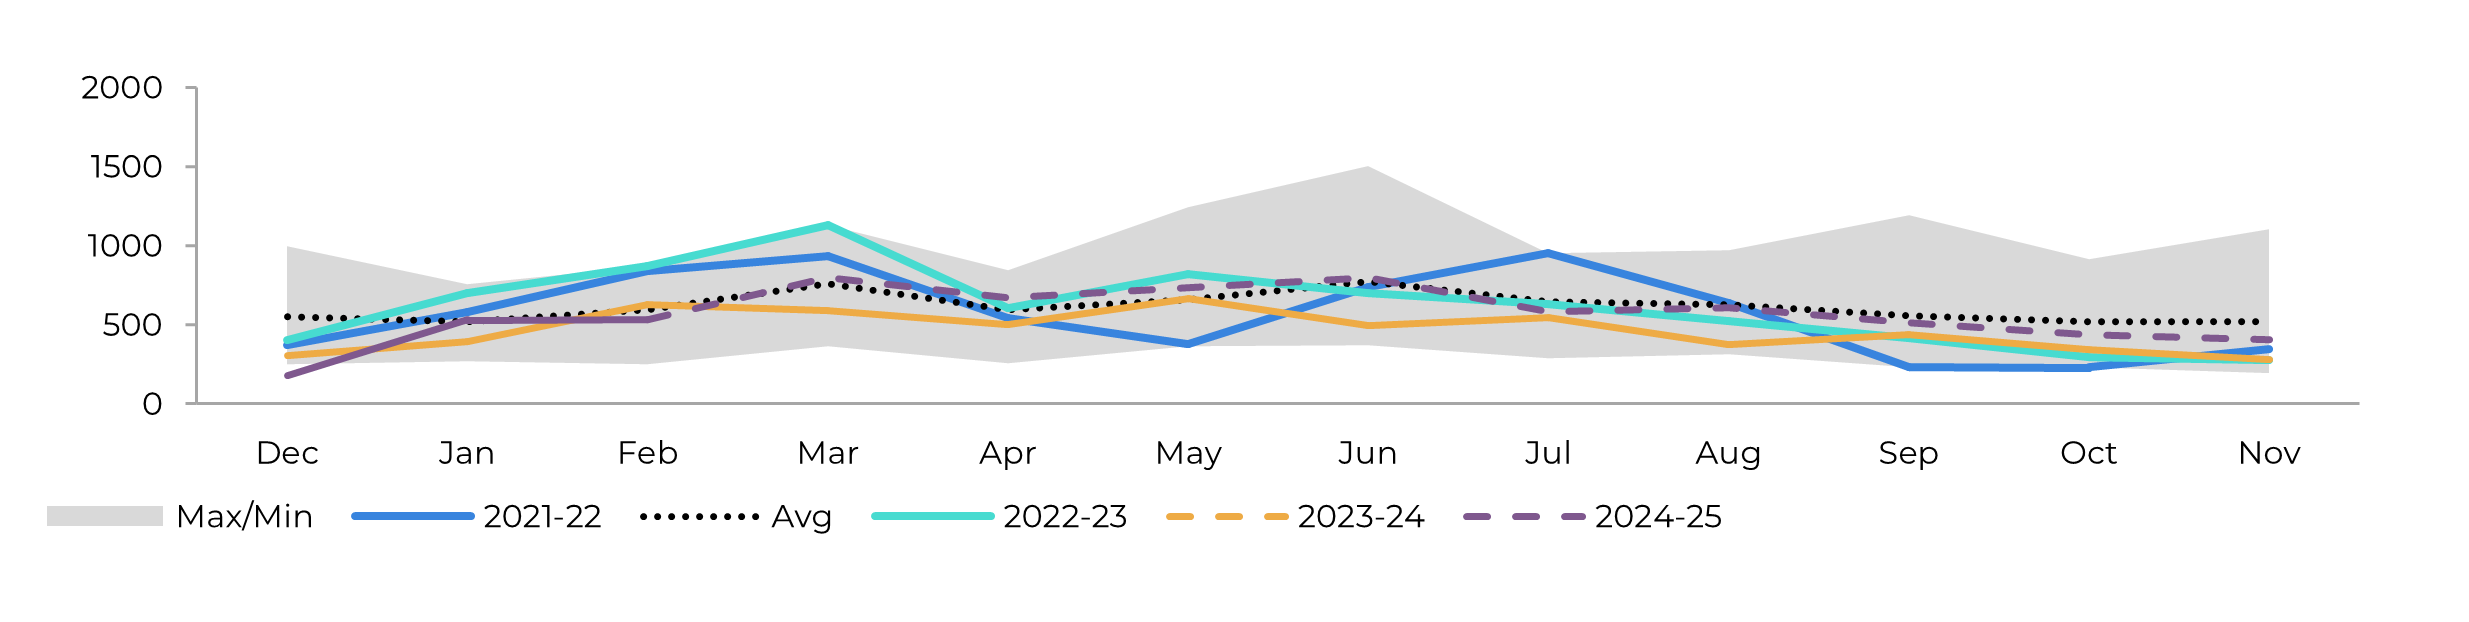
Source: Thai Sgar Millers, Hedgepoint
EU 27+UK
Image 17: Sugar Balance - EU 27+UK (Oct-Sep Mt)
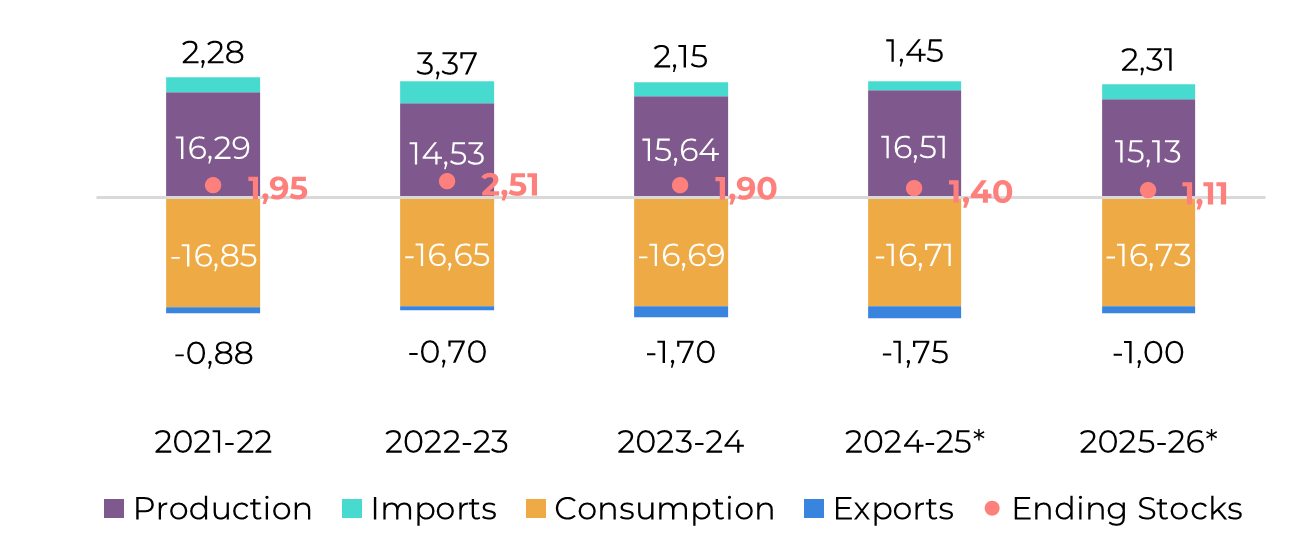
Source: EC, Greenpool, Hedgepoint
So far, the European Commission hasn’t released their final results for the 24/25 season. However, we expect production, including the UK, to reach 16.5Mt. Imports have been weaker in the region, possibly due to the strong volume brought in by Ukraine between 2023 and 2024, which has led to a sharp reduction in domestic prices. This trend has also impacted beet producers' willingness to plant, and we expect the area to decrease by around 8% on 25/26, while yields are estimated to remain similar.
Mexico
Image 18: Sugar Balance - Mexico (Oct-Sep Mt)
Source: Conadesuca, Greenpool, Hedgepoint
Sugar production up until the end of March has already increased by 2%, reaching 3.45Mt, aligning with both expectations and the previous season. Notably, both agricultural and industrial yields have shown improvements.
Exports have also improved, growing by 48% compared to 23/24, not necessarily due to optimism regarding the 24/25 season results, which should be only 6% higher, but rather because of a higher ending stocks from 23/24, which allows the country to export more this current season.
In terms of expectations, Conadesuca’s estimates remain unchanged. Production is projected to reach nearly 5Mt, with exports around 1.2Mt.
Image 19: Total Exports - Mexico ('000t)
Source: Conadesuca, Greenpool, Hedgepoint
USA
Image 20: Sugar Balance - US (Oct-Sep Mt)
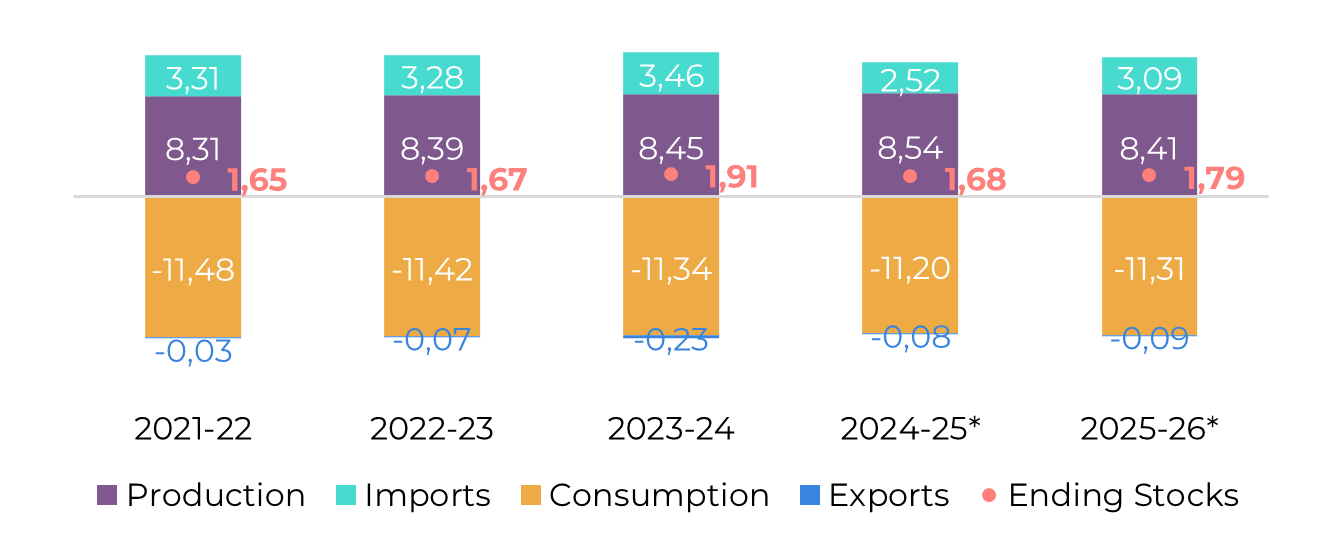
Source: USDA, Hedgepoint
The USDA has revised down domestic sugar production for the 24/25 season by 35.3kt, bringing the total to 8.5Mt. This adjustment is due to an increase in beet sugar production being more than offset by a decrease in cane sugar production. While beet sugar production is slightly up by 1.8kt, cane sugar production in Florida is expected to decrease by approximately 37.2kt. Despite this downward revision, the 24/25 domestic sugar output is still projected to be a record, surpassing last year’s 8.44Mt.
Looking ahead to the 25/26 season, the USDA released its Prospective Planting report on March 31, indicating that sugar beet producers intend to plant 1.132 million acres, a 2.5% increase compared to 24/25. Therefore, if the weather cooperates, 25/26 might be even higher!
Guatemala
Image 21: Sugar Balance - Guatemala (Oct-Sep Mt)
Source: Cengicaña, Sieca, Azucar.gt,Greenpool, Hedgepoint
Ukraine
Image 22: Sugar Balance - Ukraine (Mt Sep-Aug)
Source: Ukrsugar, Sugar.ru, Greenpool, hEDGEpoint
By the end of the 24/25 season, Ukraine produced 1.8Mt of sugar, matching the output of the 23/24 season. The country reported a 17% increase in exports during the first five months of the 24/25 crop year (September 2024 to January 2025), reaching 352kt. According to Ukrsugar, Ukrainian sugar producers made significant efforts to find alternative sales markets due to the EU's restrictions on Ukrainian sugar, resulting in all exported volume being directed to the global market, compared to just 9.5% in the previous year. .
For the 25/26 season, Ukraine has already started its beet sowing campaign. The expectation is to sow the same area as in 2024, about 2 thousand hectares, which could lead to similar production results.
Russia
Image 23: Sugar Balance - Russia (Mt Sep-Aug)
Source: Ikar, Sugar.ru, Greenpool, Hedgepoint
China
Image 24: Sugar Balance - China (Oct-Sep Mt)
Source: GSMN, CSA, Refinitiv, Greenpool, Hedgepoint
Obs: stocks also account for bonded warehouses volume and imports include syrup and smuggling estimates
Image 25: Total Imports - China ('000t - exc. syrup and smuggling)
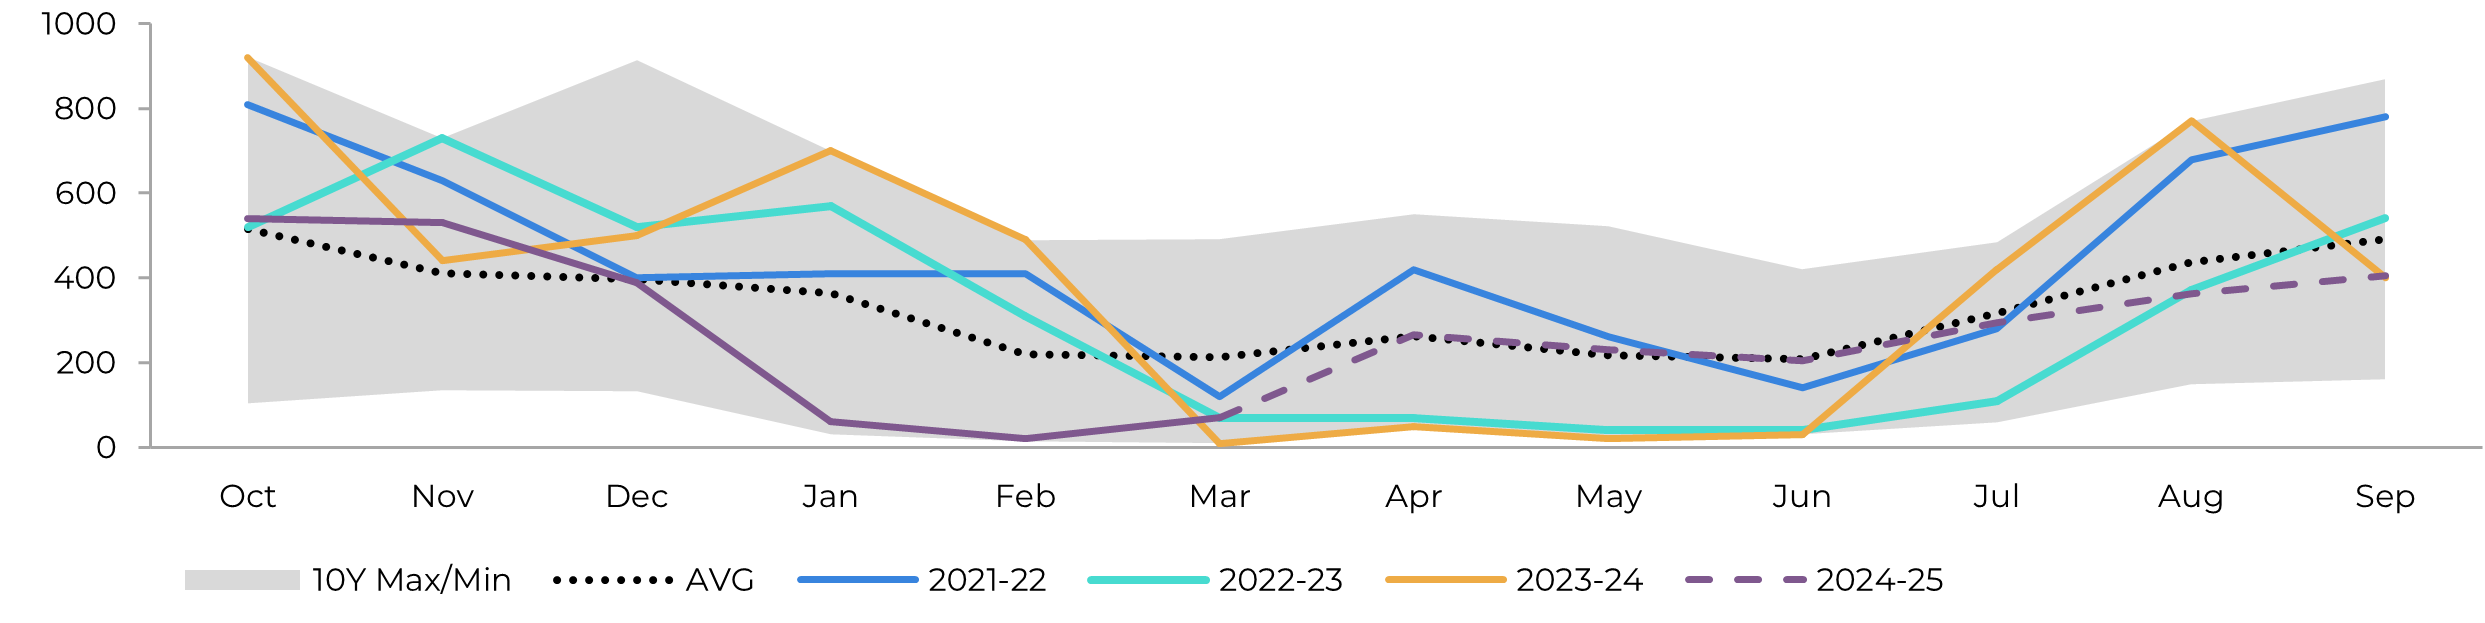
Image 26: Total Production - China ('000t)
Source: GSMM, Hedgepoint
Source: CSA, Refinitiv, Greenpool, Hedgepoint
Weekly Report — Sugar and Ethanol
livea.coda@hedgepointglobal.com
laleska.moda@hedgepointglobal.com
Sugar and Ethanol Desk
murilo.mello@hedgepointglobal.com
vipul.bhandari@hedgepointglobal.com
gabriel.oliveira@hedgepointglobal.com
etori.veronezi@hedgepointglobal.com
jose.torreao@hedgepointglobal.com
Disclaimer
This document has been prepared by Hedgepoint Schweiz AG and its affiliates (“Hedgepoint”) solely for informational and instructional purposes, without intending to create obligations or commitments to third parties. It is not intended to promote or solicit an offer for the sale or purchase of any securities, commodities interests, or investment products.
To access this report, you need to be a subscriber.


Contact us
Check our general terms and important notices.
We have updated our Terms & Conditions to reflect improvements to our platform, data handling practices, and the overall experience we provide to our clients.