
S&D and Trade Flow Update - 2025 08 18
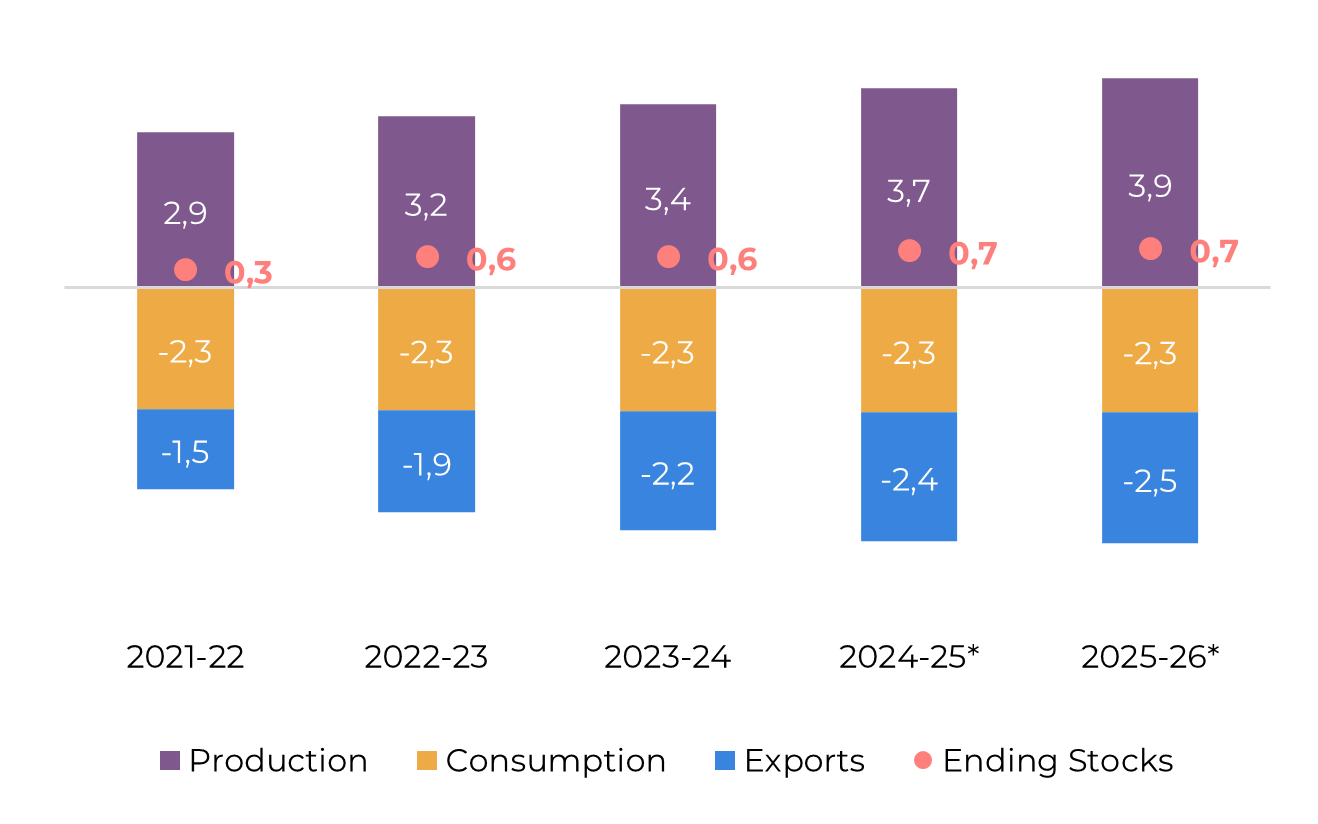
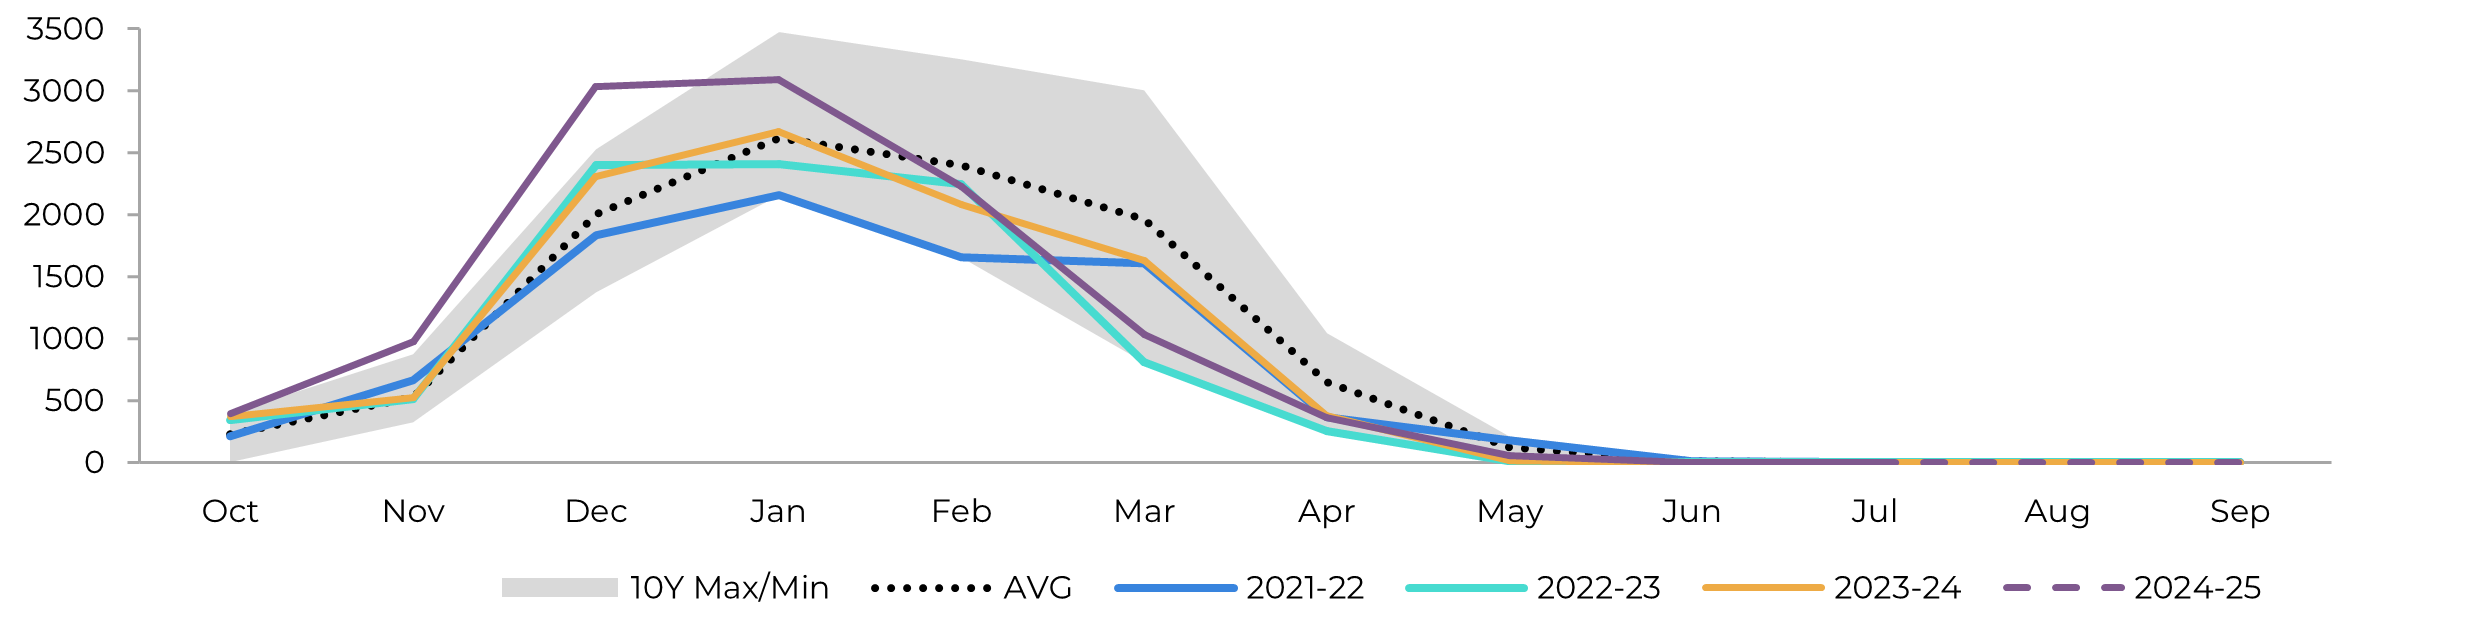
"Trade flows are expected to remain bearish, with a projected surplus exceeding 2.5 Mt between Q3 2025 and Q3 2026. While seasonal factors, such as Brazil’s intercrop period and low domestic ethanol stocks, may offer some price support, the surplus anticipated between Q3 and Q4 2025 is likely to dampen any significant recovery momentum possibly happening at the beginning of 2026. Additional pressure comes from increased global availability, particularly from countries like India."
S&D and Trade Flow
Sugar prices experienced downward pressure throughout 2025, driven by improving expectations around global availability. Raw sugar contracts began the year at 19.5 c/lb, peaking in February amid deteriorating outlooks for India’s 2024/25 season and rising concerns over Brazil’s Center-South 2025/26 performance. However, prices retreated as Brazil’s production proved more resilient.
Despite challenges such as lower-than-expected yields and cane quality, Brazil’s cane crush is projected to exceed 600 Mt, a strong result compared to previous seasons, especially when paired with a record-high sugar mix. This outcome, along with favorable conditions for the 2025/26 Northern Hemisphere crop, prompted market adjustment. Prices stabilized around 16.5 c/lb, reflecting increased supply expectations compared to past seasons. Nonetheless, persistent global demand for sugar prevented prices from remaining at the June low of 15.5 c/lb.
During June, speculation intensified around potential ethanol diversion in Brazil’s Center-South region. However, sugar prices remained attractive, particularly in the key producing states of São Paulo and Minas Gerais, which continued to push the sugar mix to exceptionally high levels, mitigating any significant risk of cumulative mix reductions.
At the 15.5 c/lb level, Chinese demand re-entered the market, positioning China as the leading buyer of Brazilian sugar during May, June, and July. With open arbitrage opportunities, China strategically increased its stockpiles, capitalizing on high supply momentum despite the stronger domestic production during the year.
Trade flows are expected to remain bearish, with a projected surplus exceeding 2.5 Mt between Q3 2025 and Q3 2026. While seasonal factors, such as Brazil’s intercrop period and low domestic ethanol stocks, may offer some price support, the surplus anticipated between Q3 and Q4 2025 is likely to dampen any significant recovery momentum possibly happening at the beginning of 2026.
Additional pressure comes from increased global availability, particularly from countries like India, where export volumes could rise substantially depending on government decisions – note that 2 Mt export quotas have already been requested. This reinforces a bearish outlook for sugar.
However, this doesn’t imply that prices will collapse or reach ethanol parity. It simply suggests that a major rebound, such as surpassing the 20 c/lb threshold, seems unlikely in the near term. A strong price recovery would likely require weather-related disruptions, or major changes to fundamentals, either on the supply or demand side, to shift the current trajectory. For the time being, we don’t expect significant changes.
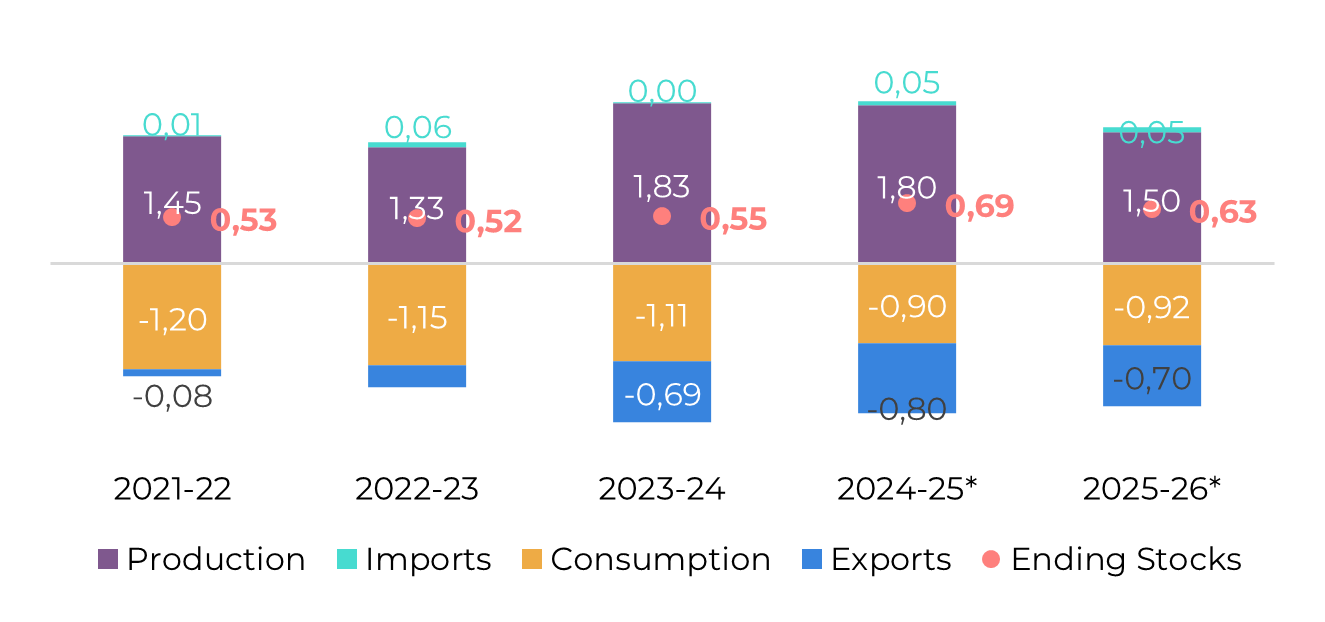
Image 1: Total Trade Flow ('000t)
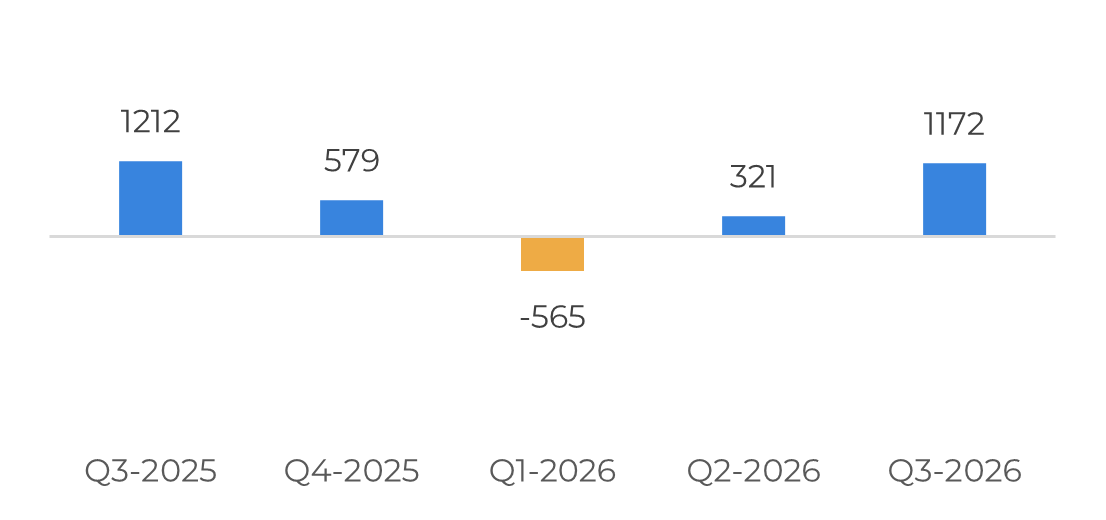
Source: Hedgepoint
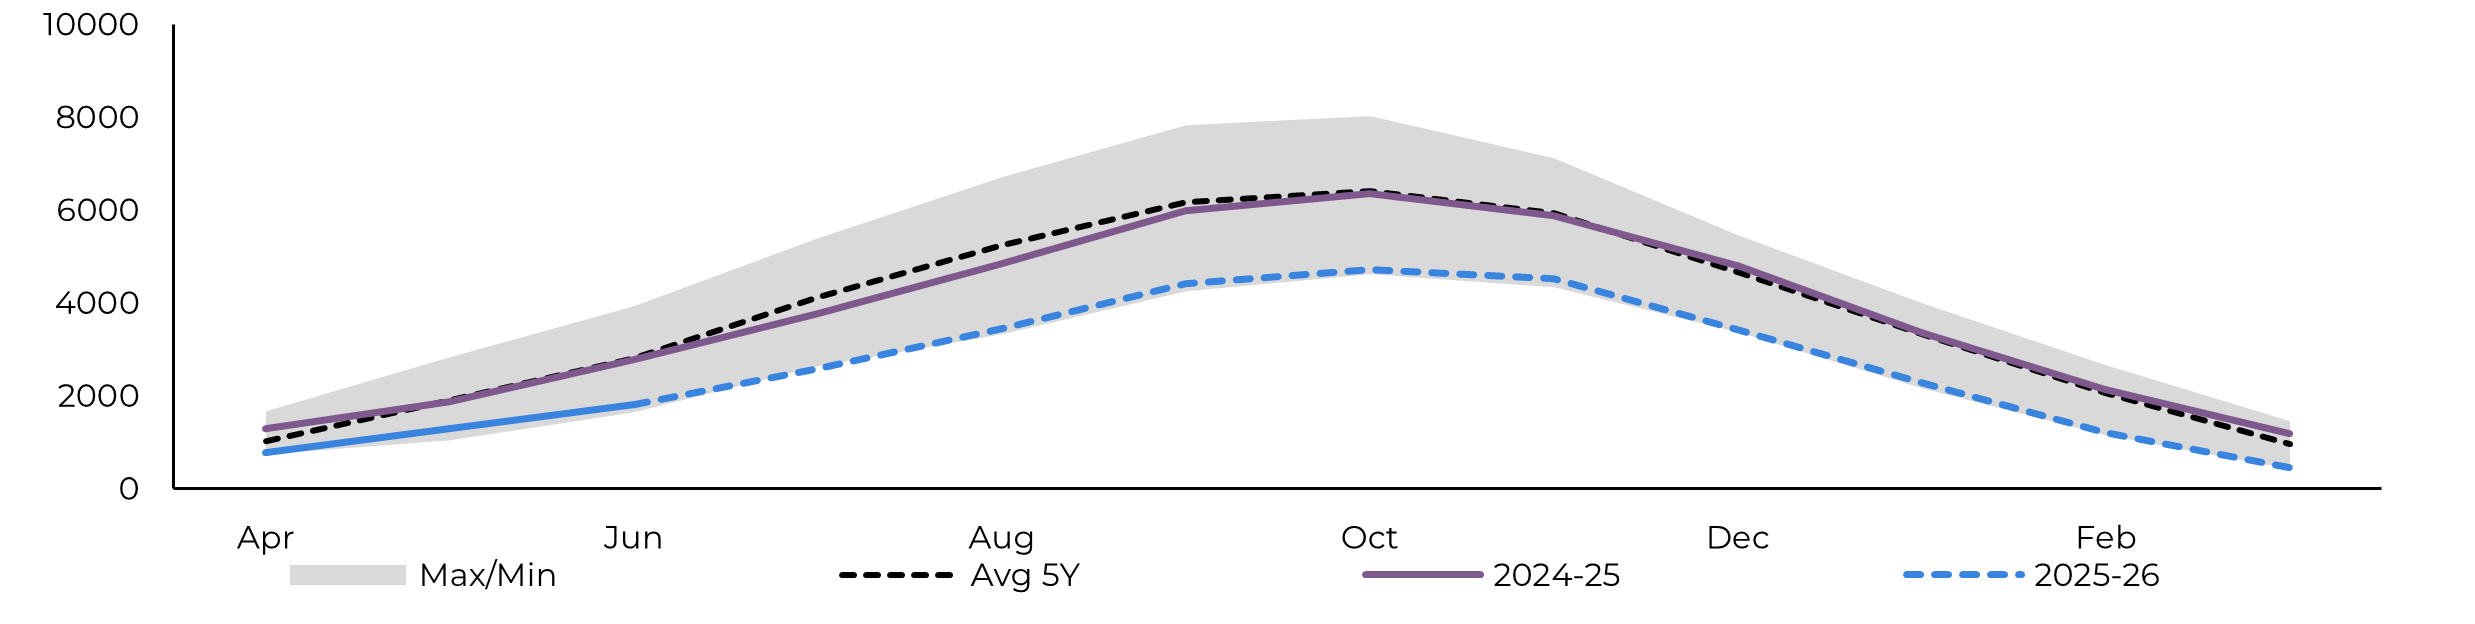
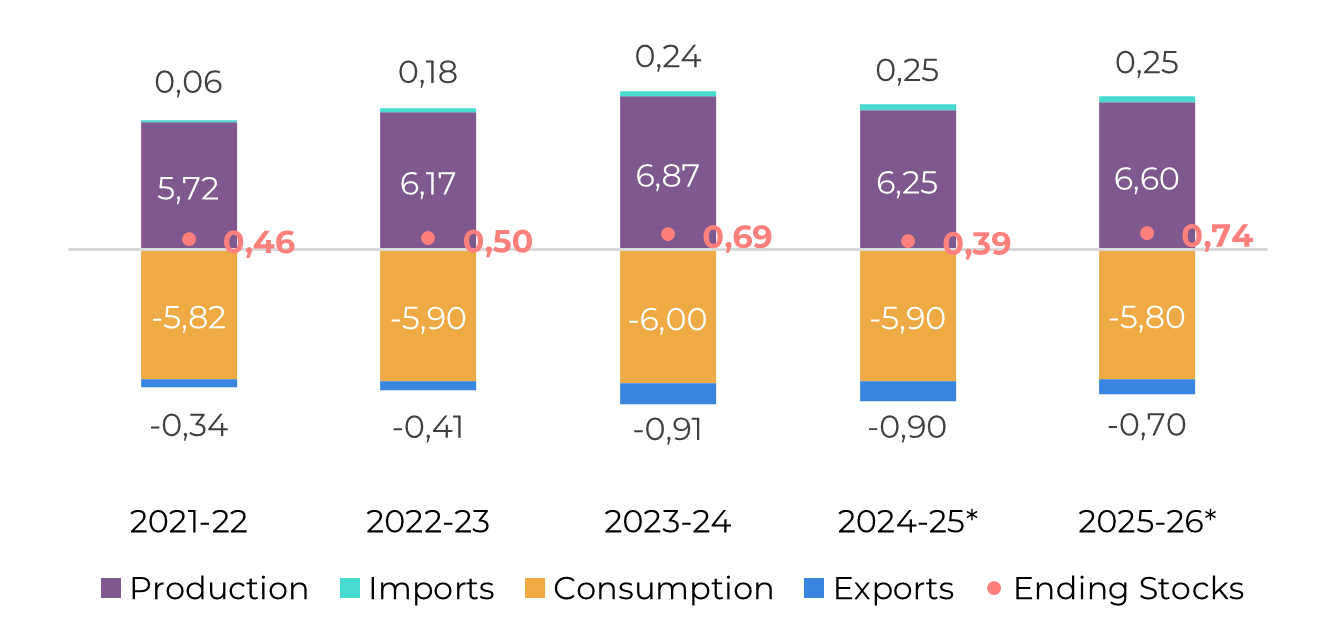
Image 2: Raw's Trade Flow ('000t)
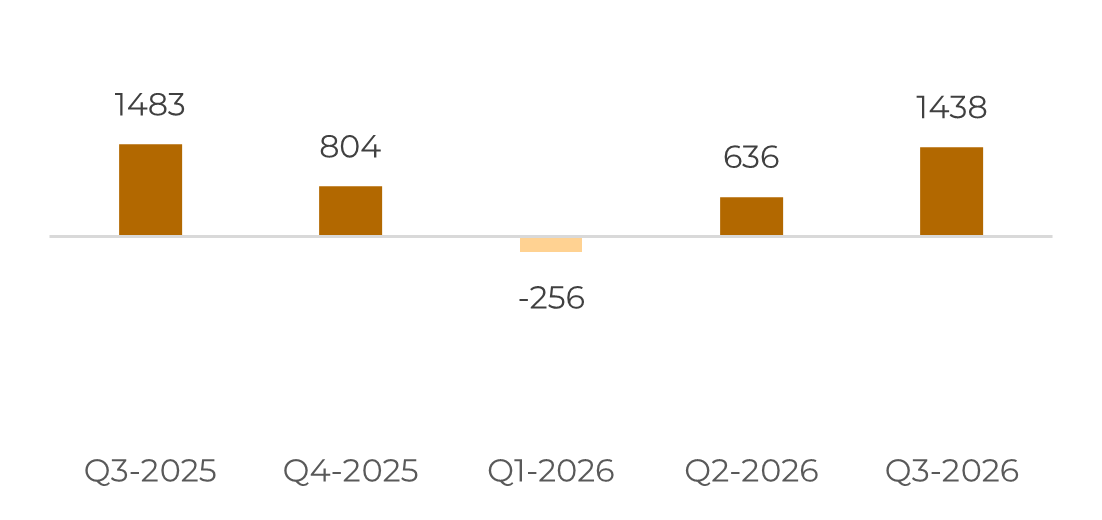
Source: Hedgepoint
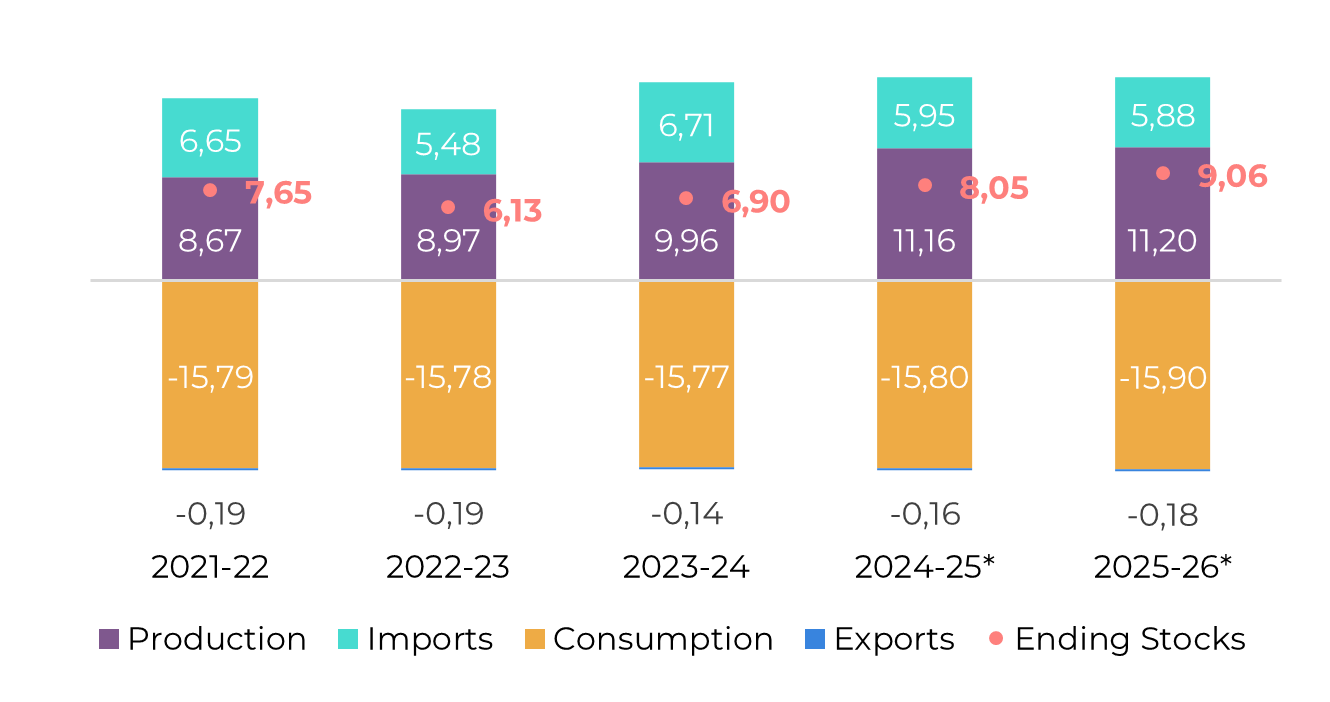
Image 3: White's Trade Flow ('000t)
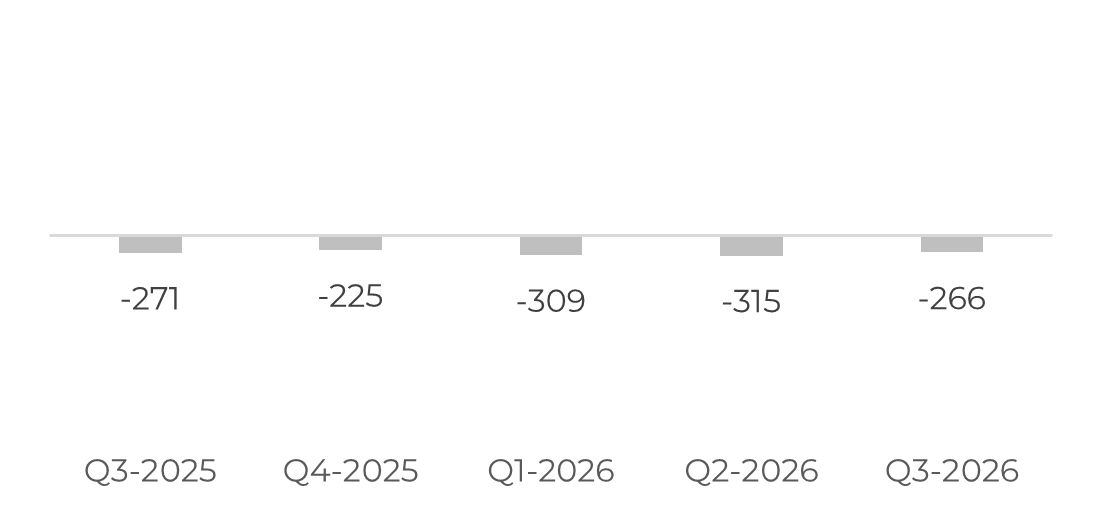
Source: Hedgepoint
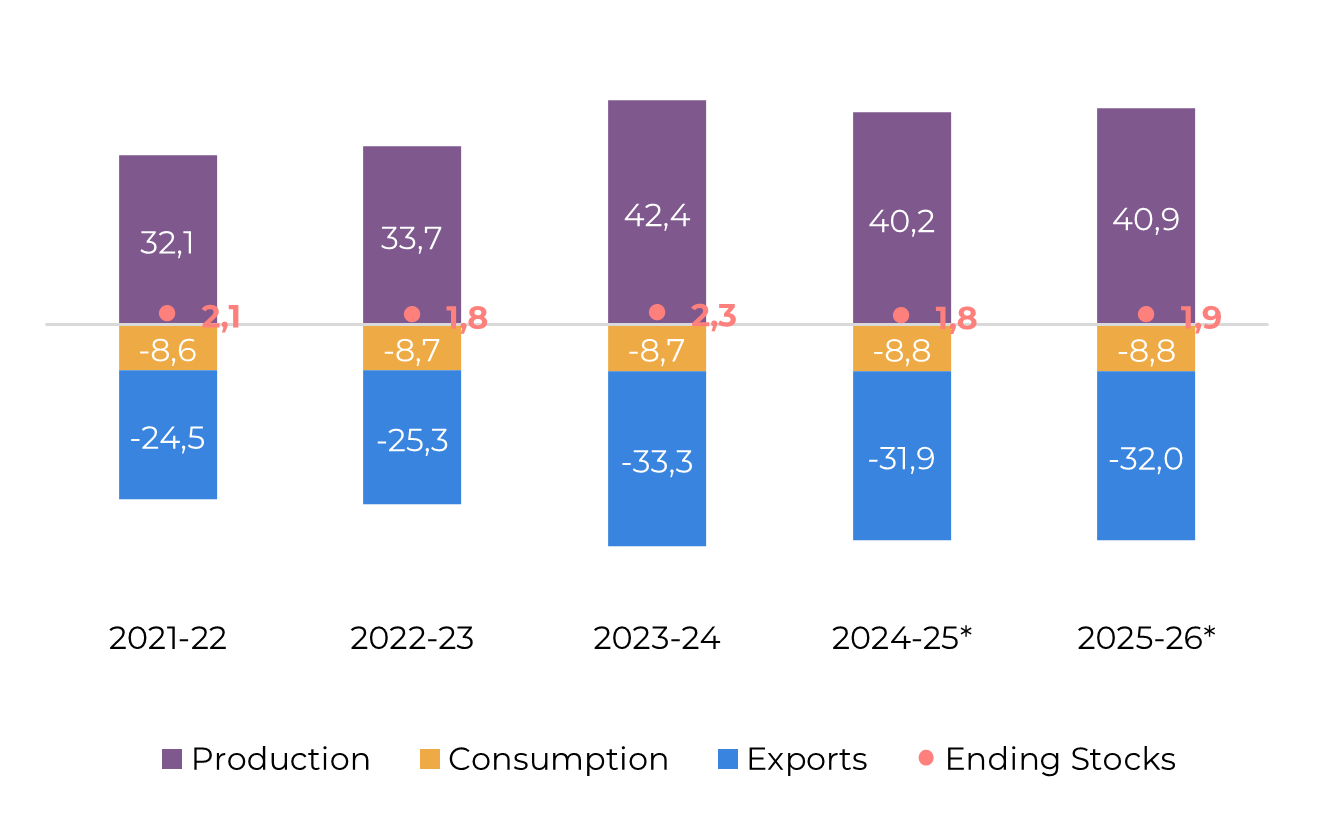
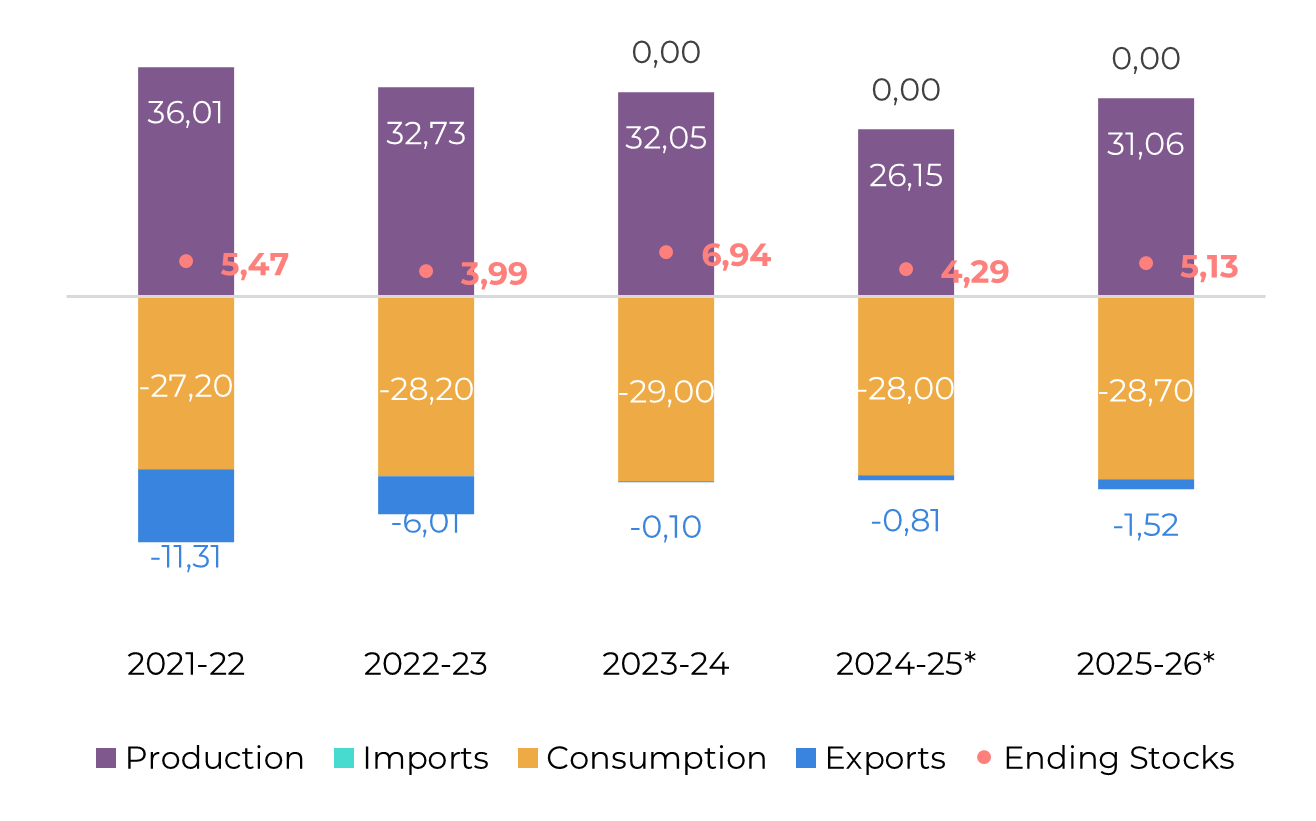
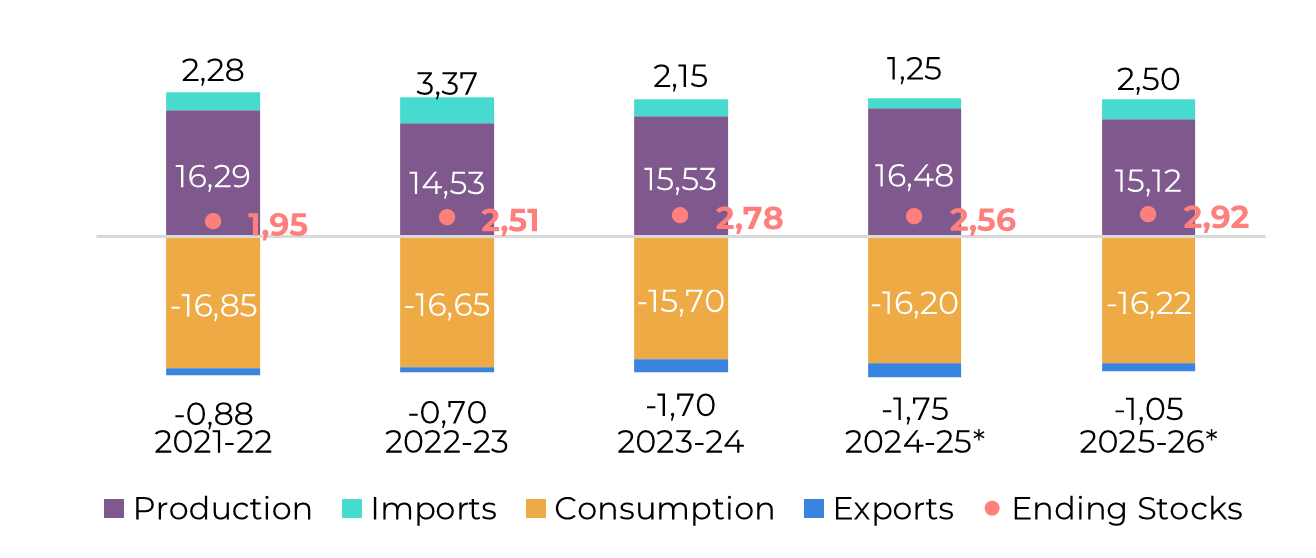
Image 4: Global Supply and Demand Balance (MT RV oct-sep)
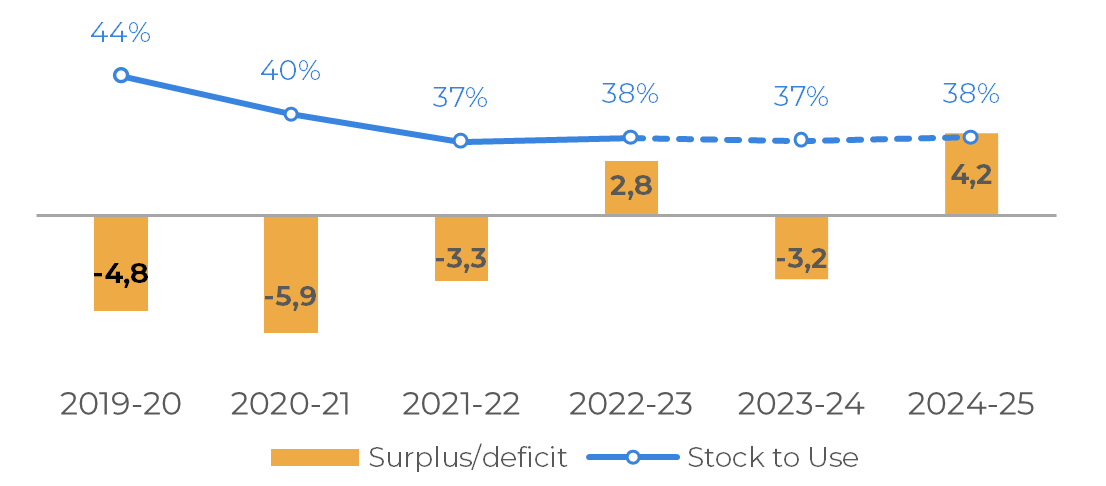
Source: Hedgepoint
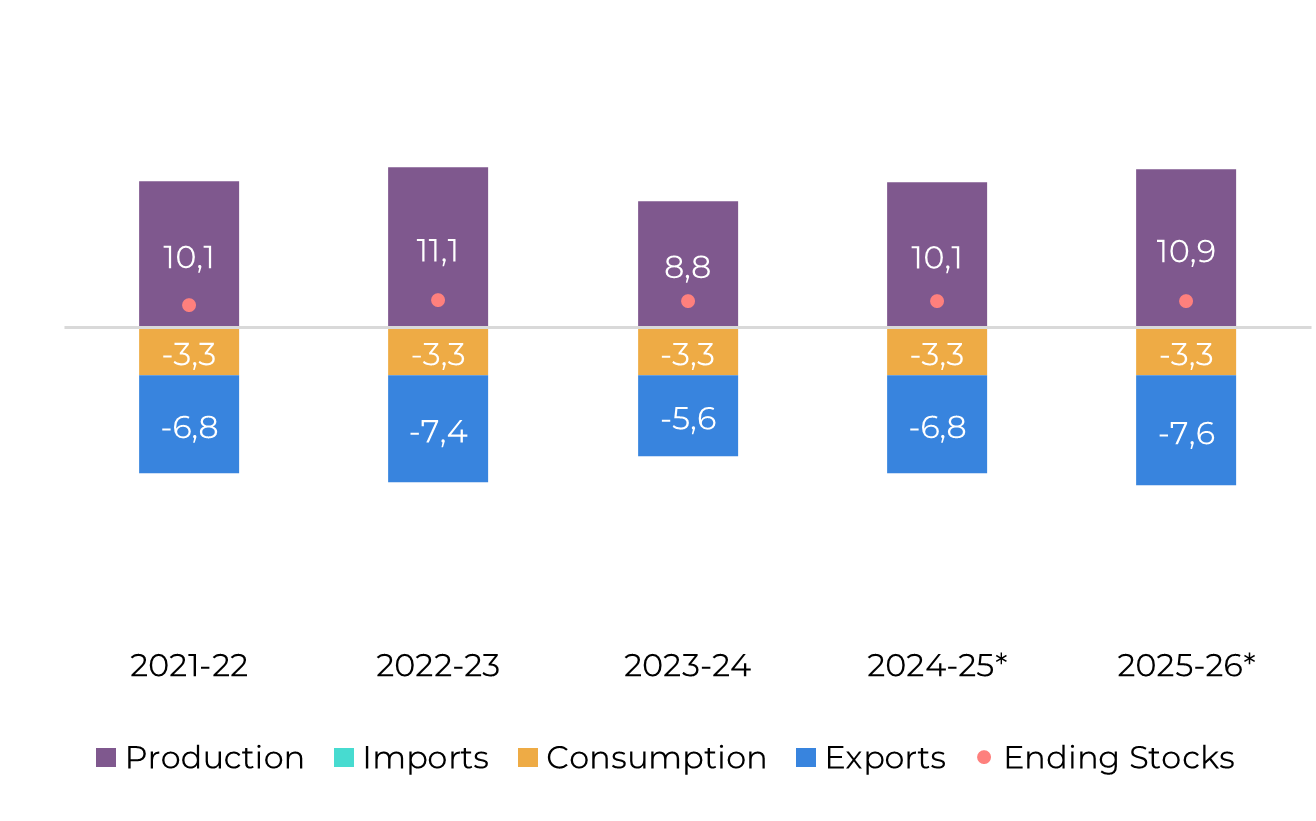
Brazil CS
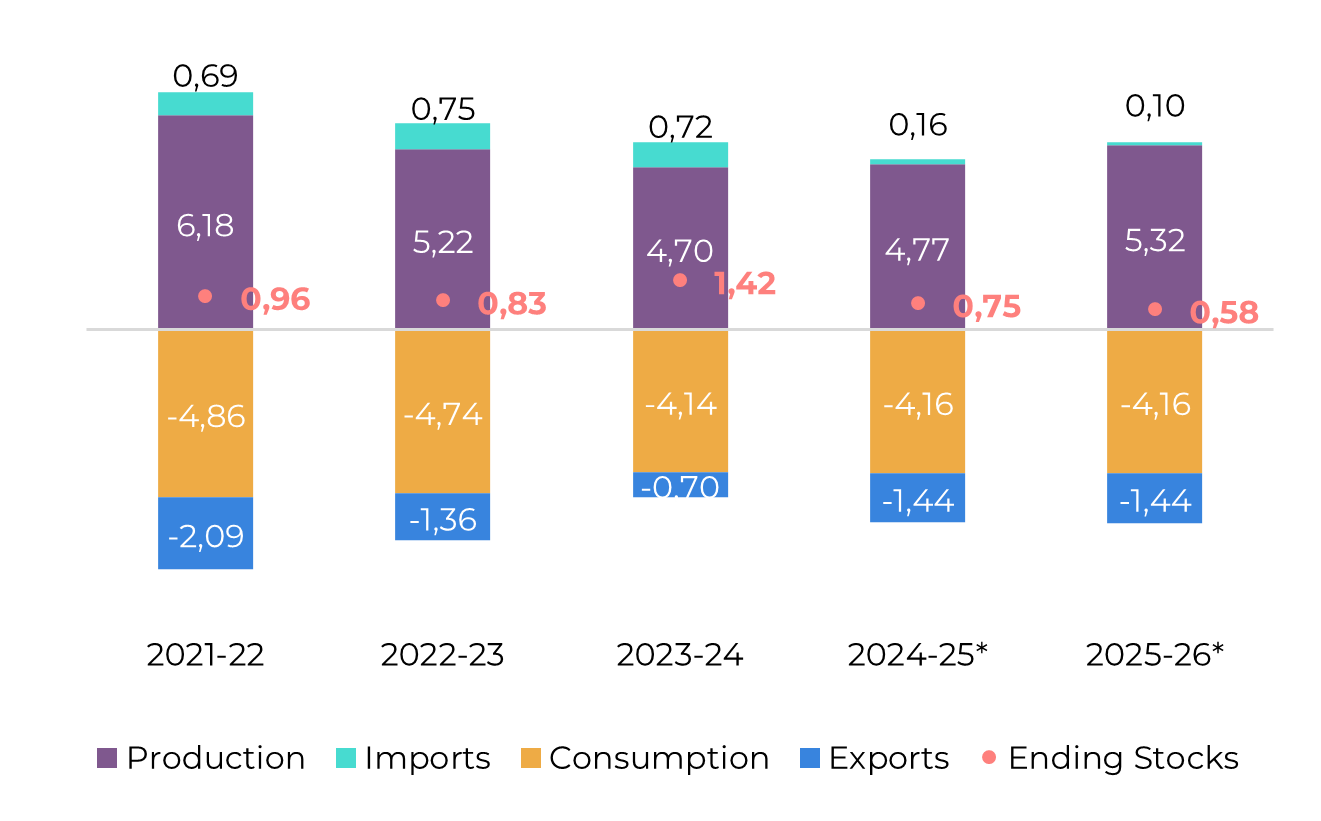
Image 5: Sugar Balance - Brazil CS (Apr-Mar Mt)
Source: Unica, MAPA, SECEX, Hedgepoint
The 25/26 season is underperforming relative to expectations, largely due to the lingering effects of 2024’s fires and early-2025 dryness, despite the beneficial rains received late last year. These conditions have pressured both TCH and TRS results so far.
However, the Vegetation Health Index has shown improvement as crushing progressed, hinting at possible yield resilience ahead. Historical seasons such as 12/13, 15/16, and 22/23 displayed similar VHI trends and experienced TCH recovery in later stages.
These years also saw higher crushing volumes after the end of July compared to the long-term average, allowing us to expect some yield resilience in the region. In terms of cane figures, we revised availability down to 605Mt. Although lower than initially expected, the result remains at the higher end of CS crushing volume throughout the years.
Despite discussions in June about ethanol diversion, mills are now pushing a record-breaking sugar mix, expected to reach 52%. This fact has compensated for part of the lower TCH and TRS results. The latter has been consistently lagging past seasons and, using the same group of seasons (12/13, 15/16 and 22/23) as a proxy, its recovery has limited potential. As a result, we revised TRS down to 136.4 kg/t – a sluggish result compared to the past 5 years.
As a result of lower TRS expectations and slightly reduced TCH, seen closer to 76t/ha, but stronger sugar mix, sugar output is now forecast at 40.9 Mt, down 650 kt, with exports estimated at 31.9 Mt, closely aligning with 24/25 levels.
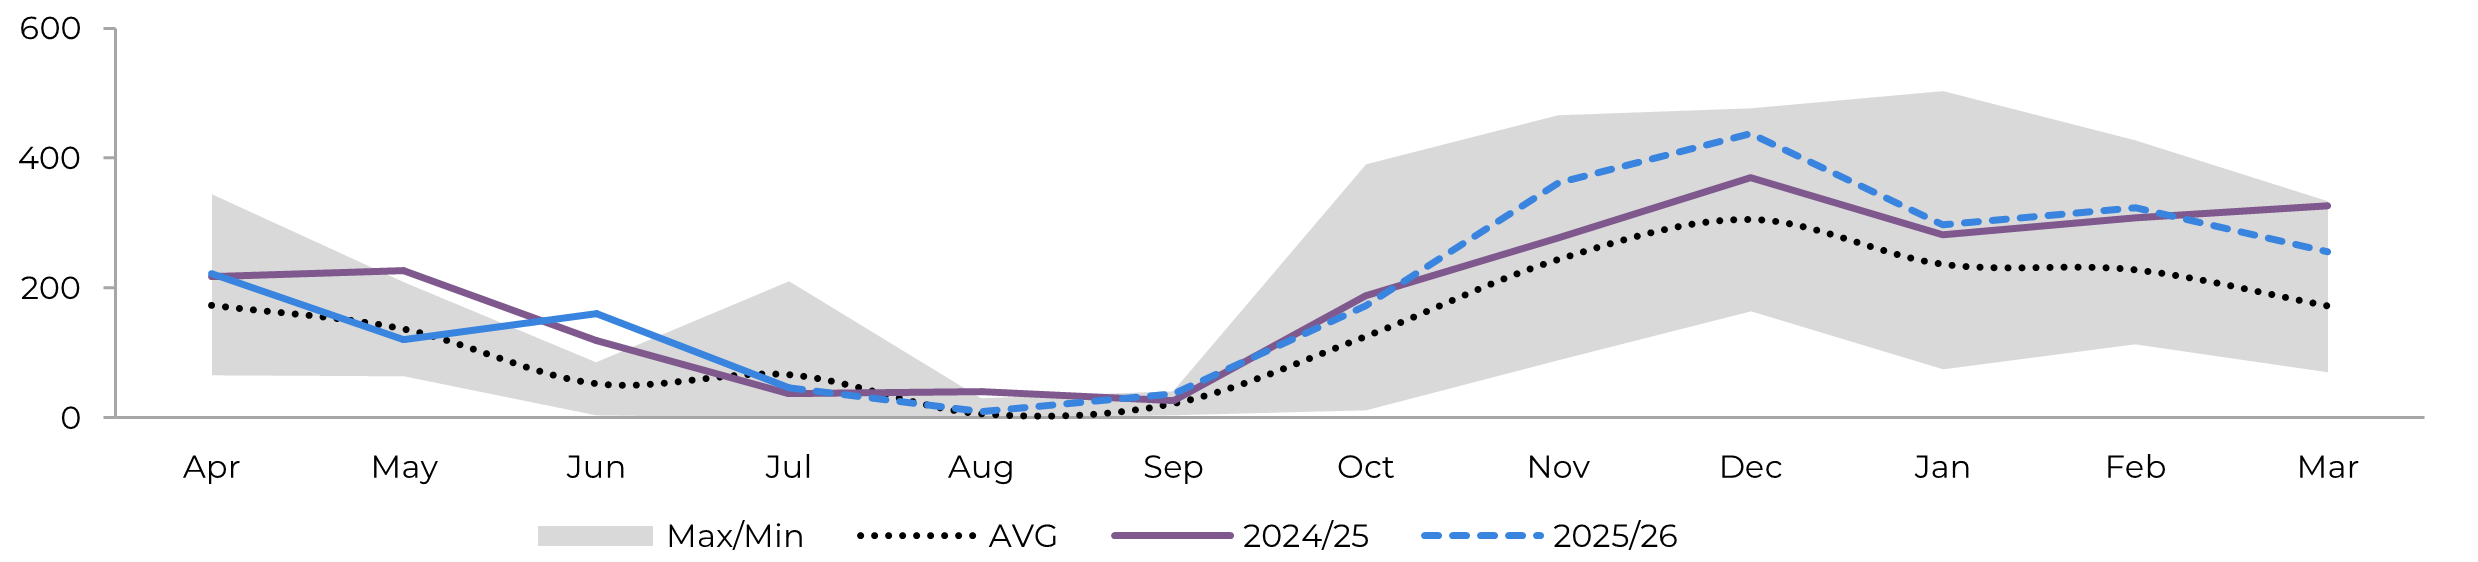
Image 6: Total Exports - Brazil CS ('000t)
Image 7: Total Stocks - Brazil CS ('000t)
Source: SECEX, Williams, Hedgepoint
Source: Unica,MAPA, SECEX, Williams, Hedgepoint
Brazil CS Ethanol
Image 8: Otto Cycle - Brazil CS (M m³)
Source: ANP, Bloomberg, Hedgepoint
2025 has been rather interesting for ethanol so far. The government announced a 3% increase in the blending mandate, raising it to 30% effective August 1st. While this move is broadly seen as bullish for the market, expectations pointed to an earlier implementation in June. This delay, compared to what was anticipated not only by Hedgepoint but also by other analysts, provided partial relief to ethanol stocks.
Image 9: Anhydrous Ending Stocks - Brazil CS ('000 m³)
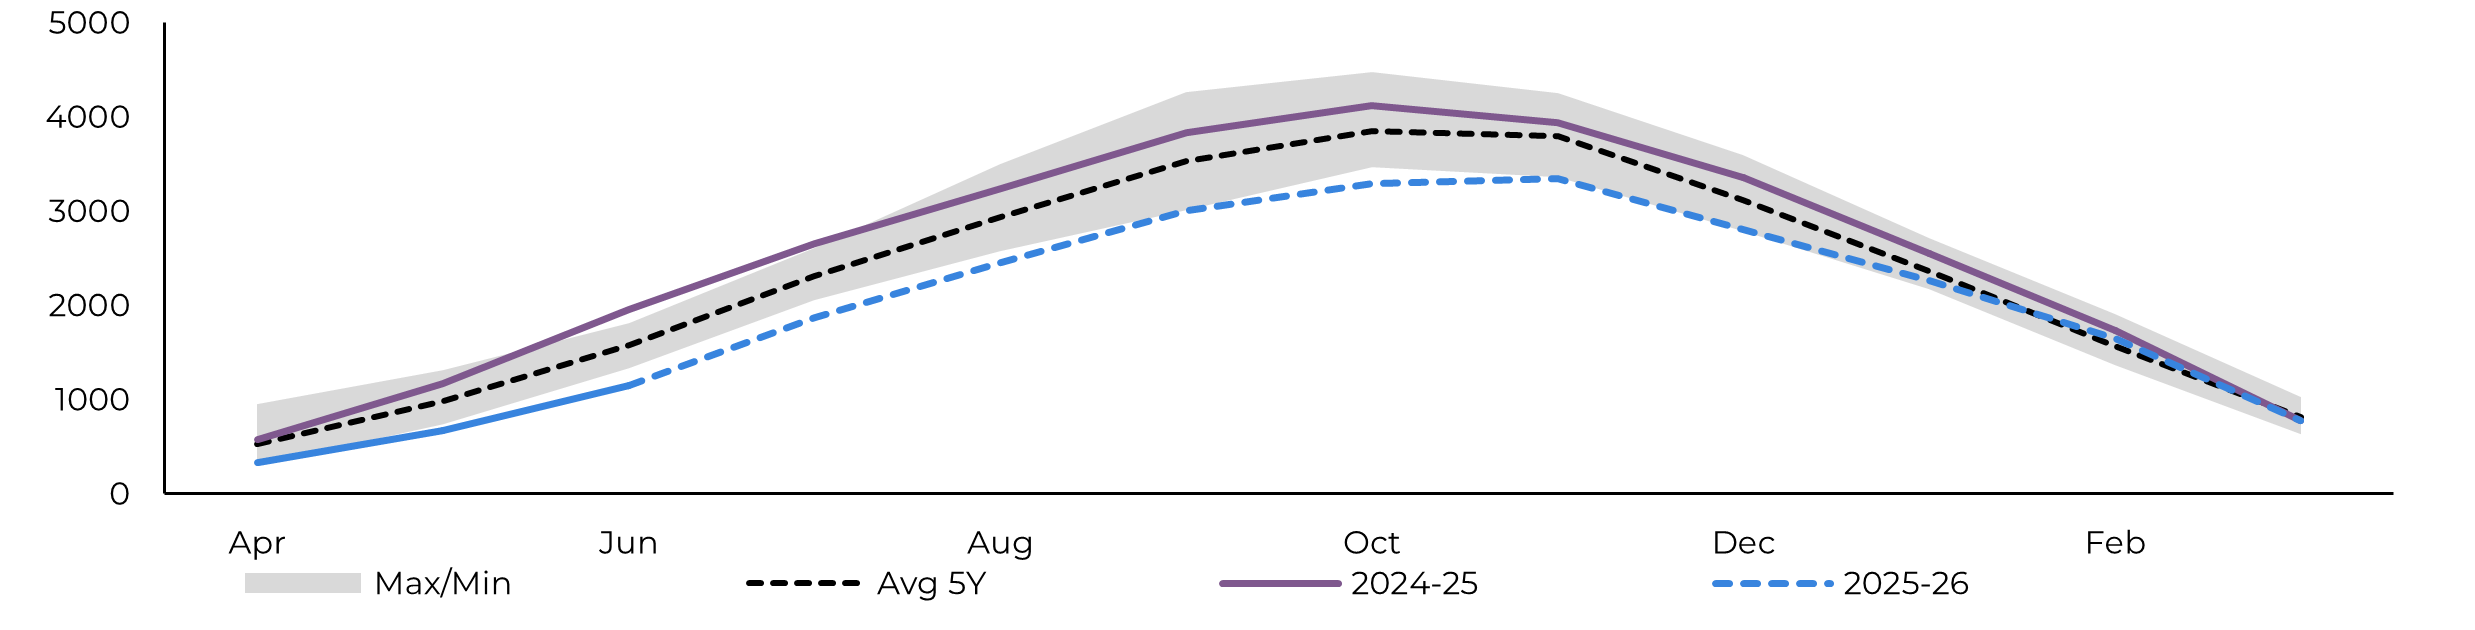
Image 10: Hydrous Ending Stocks - Brazil CS ('000 m³)
Source: Unica, MAPA, ANP, SECEX, Hedgepoint
Source: Unica, MAPA, ANP, SECEX, Hedgepoint
Brazil NNE
Image 11: Sugar Balance - Brazil NNE (Apr-Mar Mt)
Source: MAPA, SECEX, Hedgepoint
Sugar production for the 2024/25 crop year (April–March) reached 3.75 Mt, driven by the crushing of approximately 58.4 Mt of cane. This was achieved with an ATR of 132 kg/ton and a sugar mix of 51%.
Looking ahead to 2025/26, a survey conducted by Hedgepoint with key players in the NNE region indicates a projected cane crush of 60.6 Mt, nearly 4% higher than in the previous season. This number aligns with Conab’s current estimate.
Image 12: Total Exports - Brazil NNE ('000t)
Source: SECEX, Hedgepoint
India
Image 13: Sugar Balance - India (Oct-Sep Mt)
Source: ISMA,AISTA, Hedgepoint
India’s sugar production in 2024/25 fell short of expectations, reaching a gross volume of approximately 30 Mt. After diverting 3.4 Mt to ethanol production, net sugar output stood at 26.1 Mt. On the export front, the country shipped 800 kt during the season, with the 200 kt quota leftover potentially being carried over to 2025/26.
Looking ahead, the outlook for 2025/26 is more optimistic. Abundant rainfall in May improved soil moisture and supported early crop development. Reflecting this, ISMA’s first estimate projects gross sugar production near 35 Mt.
Ethanol diversion is expected to range between 4 and 4.5 Mt, resulting in net sugar output between 30.5 and 31 Mt. Our current estimate aligns with the upper end of that range, at 31 Mt, with potential upside.
Regarding exports, our initial forecast was conservative, at 500 kt. However, factoring in the unused 200 kt from 2024/25 and ISMA’s request for the government to authorize around 2 Mt of exports, we’ve revised our projection upward to 1.5 Mt. At this level, India would continue to stock less than its three-month consumption target, a trend observed over the past five seasons.
Image 14: Total Domestic Exports - India ('000t w/o tolling)
Source: ISMA,AISTA, Hedgepoint
Thailand
Image 15: Sugar Balance - Thailand (Dec-Nov Mt)
Source: Thai Sgar Millers, Sugarzone, Hedgepoint
Thailand’s sugar production reached 10 Mt in 2024/25, supported by an expansion in cultivated area and partial recovery in yields. Cane crushing rose by 10 Mt compared to the 2023/24 season, totaling 92 Mt, with over 85% consisting of fresh cane.
Despite the increase in production, export volumes have remained modest, aligning with last season’s levels. As of June, Thailand exported 3.57 Mt of sugar. Within this total, raw sugar shipments rose by 18%, while white sugar exports declined by 14% year-over-year. Nevertheless, we still anticipate total exports to reach around 6.7 Mt, as stockpiling is not typical behavior in the Thai market.
Image 16: Total Exports - Thailand ('000t)
Source: Thai Sgar Millers, Hedgepoint
EU 27+UK
Image 17: Sugar Balance - EU 27+UK (Oct-Sep Mt)
Source: EC, Greenpool, Hedgepoint
Between 2022 and 2023, there was a significant surge in Ukrainian imports, which drove down domestic prices across Europe, even as the continent increased its own exports during that period. This trend has led to a decline in imports for 24/25, though not enough to secure beet area. As a result, the European Commission estimates a 10.5% reduction in beet area. Including a relatively stable UK, our projection for the entire region reflects a 10% decline.
Mexico
Image 18: Sugar Balance - Mexico (Oct-Sep Mt)
Source: Conadesuca, Greenpool, Hedgepoint
Mexico’s sugar sector performance up to July has fallen short of initial market expectations for the 2024/25 season and continues to trail current estimates. As of July 19th, cane crushing reached 45.6 Mt, slightly below Conadesuca’s fourth estimate of 46.3 Mt. This shortfall directly impacts sugar output, which currently stands at 4.7 Mt, likely close to the final figure. Still, this volume represents a 1% increase over 2023/24, largely driven by improved yields both in the field and at the industrial level.
While the agency has yet to release projections for 2025/26, weather conditions offer reasons for optimism. In June, less than 2% of cane-growing microregions experienced any drought, ranging from mild to severe. This suggests a potentially stronger outcome for sugar production in the upcoming season, especially considering favorable rainfall in May across most cane regions and positive forecasts for August.
Image 19: Total Exports - Mexico ('000t)
Source: Conadesuca, Greenpool, Hedgepoint
USA
Image 20: Sugar Balance - US (Oct-Sep Mt)
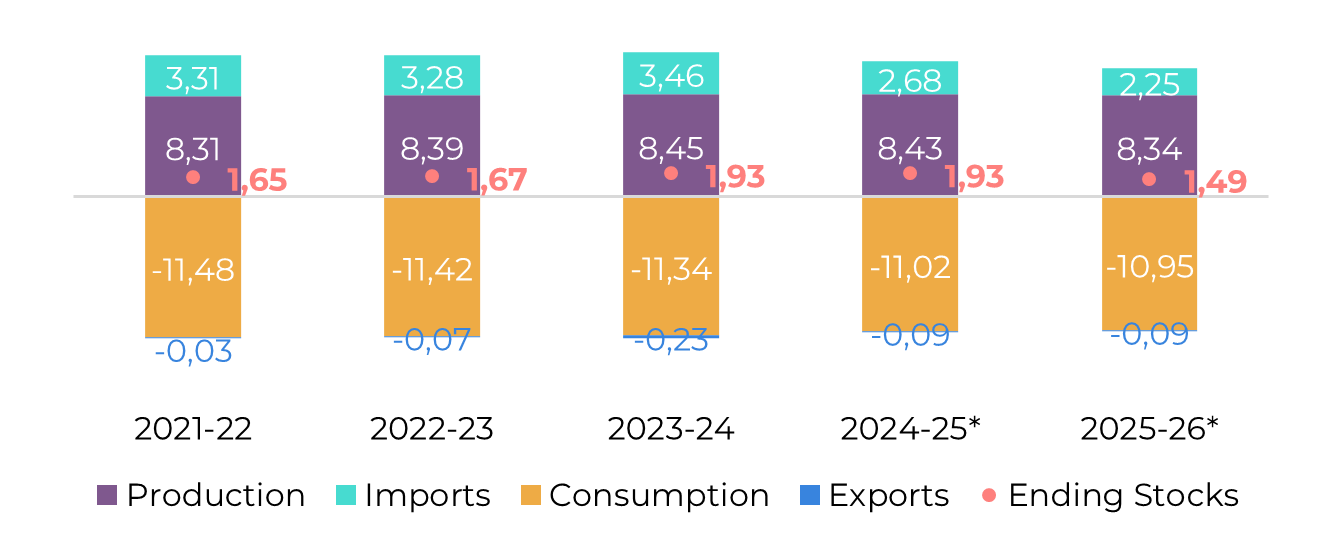
Source: USDA, Hedgepoint
The USDA has reported that national sugar production in 2025/26 is projected to decline slightly, from 8.43 Mtrv to 8.34 Mtrv. This decrease is primarily attributed to reduced beet output, as its yields are expected to be marginally lower, offsetting gains from cane-producing regions. As a result, beet’s share in total production shrunk.
In contrast, cane acreage in Louisiana is forecasted to expand for the sixth consecutive year, marking the fourth straight year it will surpass Florida in planted area.
Despite the lower production outlook, total sugar availability in the U.S. has been revised upward. This adjustment stems from reduced deliveries for human consumption expected in 2024/25, which will boost beginning stocks for 2025/26. Weak demand for food-use sugar is anticipated to persist in the next season. Consequently, the USDA has lowered its import forecast, with Mexican-origin sugar facing the largest reduction, -208ktrv.
Ukraine
Image 21: Sugar Balance - Ukraine (Mt Sep-Aug)
Source: Ukrsugar, Sugar.ru, Greenpool, hEDGEpoint
According to local reports, Taras Vysotsky, First Deputy Minister of Agrarian Policy, announced a significant reduction in Ukraine’s sugar beet planting for the 2025 season. The sown area fell from 259 thousand hectares in 2024 to 220 thousand hectares, marking a 15.4% decrease. This decline is largely a response to the reduction in EU import quotas, which had been the most profitable destination for Ukrainian sugar.
Russia
Image 22: Sugar Balance - Russia (Mt Sep-Aug)
Source: Ikar, Sugar.ru, Greenpool, Hedgepoint
China
Image 23: Sugar Balance - China (Oct-Sep Mt)
Source: GSMN, CSA, Refinitiv, Greenpool, Hedgepoint
Obs: stocks also account for bonded warehouses volume and imports include syrup and smuggling estimates
Image 24: Total Imports - China ('000t - exc. syrup and smuggling)
Image 25: Total Production - China ('000t)
Source: GSMM, Hedgepoint
Source: CSA, Refinitiv, Greenpool, Hedgepoint
Weekly Report — Sugar and Ethanol
livea.coda@hedgepointglobal.com
laleska.moda@hedgepointglobal.com
Sugar and Ethanol Desk
murilo.mello@hedgepointglobal.com
vipul.bhandari@hedgepointglobal.com
gabriel.oliveira@hedgepointglobal.com
etori.veronezi@hedgepointglobal.com
jose.torreao@hedgepointglobal.com
Disclaimer
This document has been prepared by Hedgepoint Schweiz AG and its affiliates (“Hedgepoint”) solely for informational and instructional purposes, without intending to create obligations or commitments to third parties. It is not intended to promote or solicit an offer for the sale or purchase of any securities, commodities interests, or investment products.

