
Live with Experts - Soy Complex and Vegetable Oils - Highlights
Soybean Complex and Vegetable Oils Scenarios Update
Macro Overview
Macro Overview
- Interest rates and exchange rates: Before the shutdown, the consensus was for a rate cut by the Fed in December. Now, the absence of inflation data (October CPI) and doubts about the labor market increase uncertainty, raising the probability that interest rates will remain unchanged. This keeps the Brazil-US interest rate differential stable, sustaining the real in the range of R$ 5.20-5.40.
- Impact on Brazil: This exchange rate directly influences soybean producer prices (Chicago + premium + dollar). A stronger real reduces the incentive to sell, which may delay commercialization.
- US-China agreement: The resumption of talks at the end of October provided support for Chicago. China purchased around 2.2 million tons of US soybeans between the end of October and the end of November, targeting 12 million tons by January. However, competitiveness clauses and a 13% Chinese tariff still limit the pace.
- Strategic implications: Exchange rate volatility and uncertainty about interest rates impact hedging decisions and sales timing in Brazil. Players should monitor "Super Wednesday" (Fed + Copom) and dollar movements, as any surprise could alter export parity.
Soybean Complex
Global Scenario
Soybean Complex
Soybean - World - Supply and Demand (M ton)
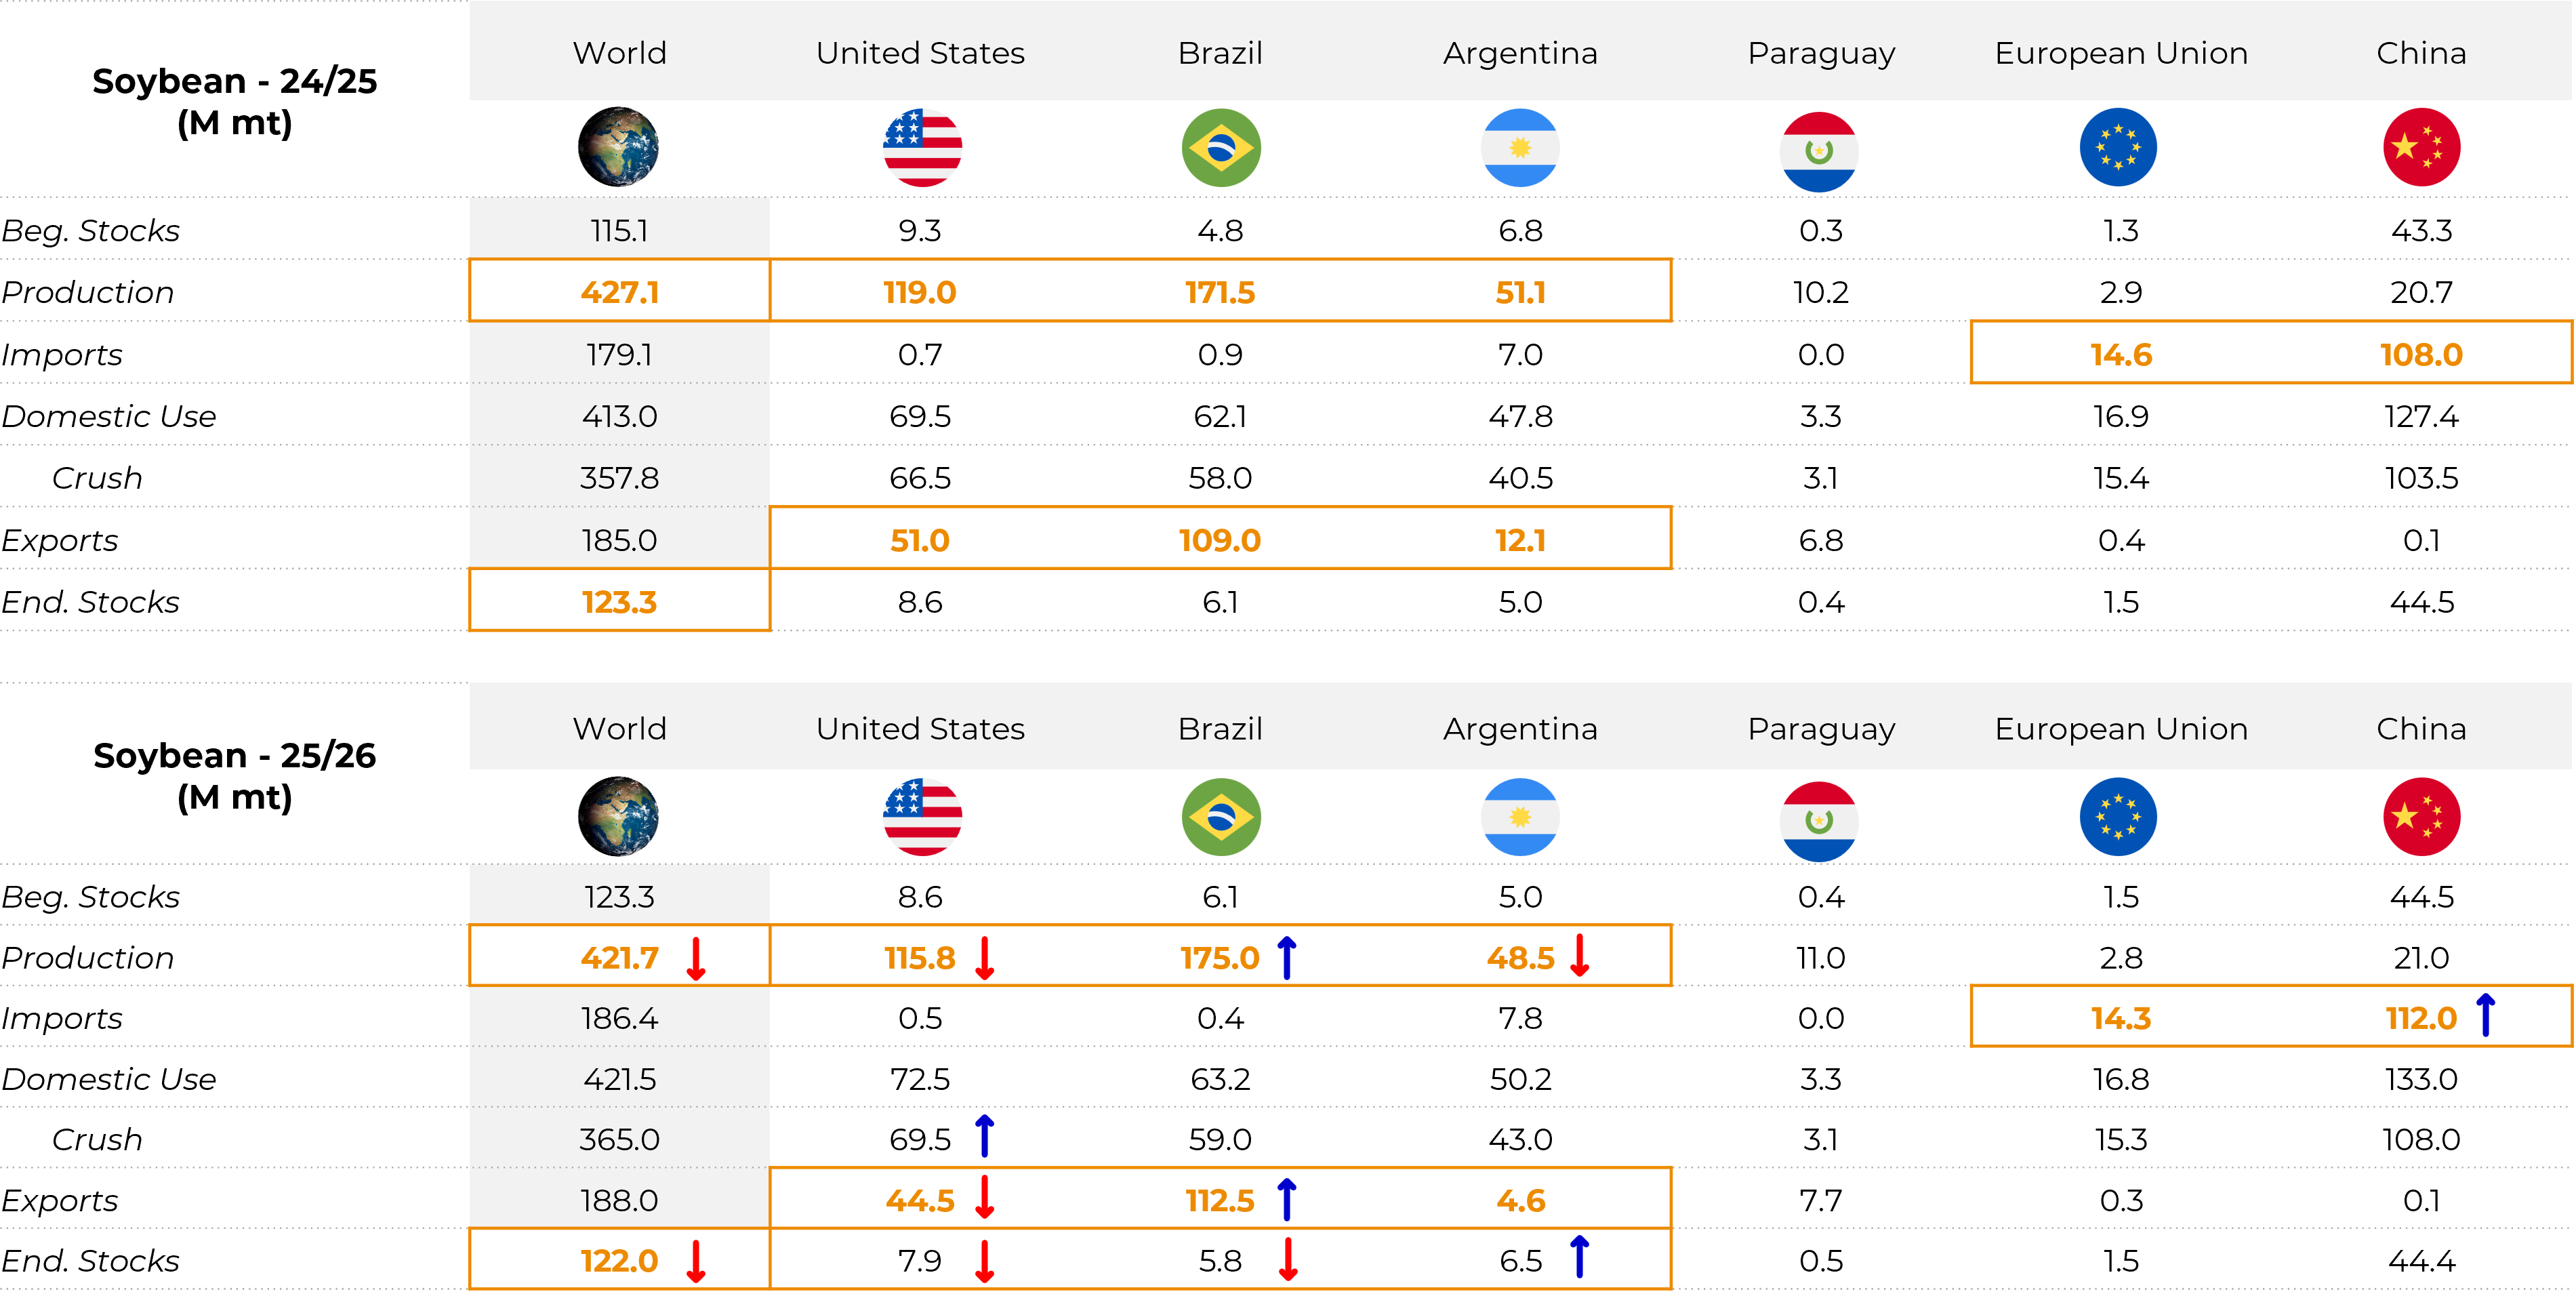
Source: USDA, Hedgepoint
China
China
- Stock Policy: China maintains its restocking strategy, with ending stocks close to 44 million tons, ensuring four months of consumption. This reduces the urgency to buy and price sensitivity.
- Imports and crushing: Imports are projected to reach 112 million tons in 2025/26, accompanying an increase in crushing to 108 million tons (vs. 103.5 million tons in the previous crop).
- Margins: Challenging scenario with tight margins for crushing, despite the volume commitment. Port stocks at historic highs are a limiting factor for demand.
- Competitiveness: American soybean remains more expensive than soybean from Brazil or Argentina, even without considering tariffs. Chinese movement signals more political "goodwill" than economic advantage.
- Strategic risk: If margins remain negative, the pace of purchases may slow, putting pressure on Chicago and premiums in Brazil.
China Soybean - Stocks and Stock/Use (M ton, %)
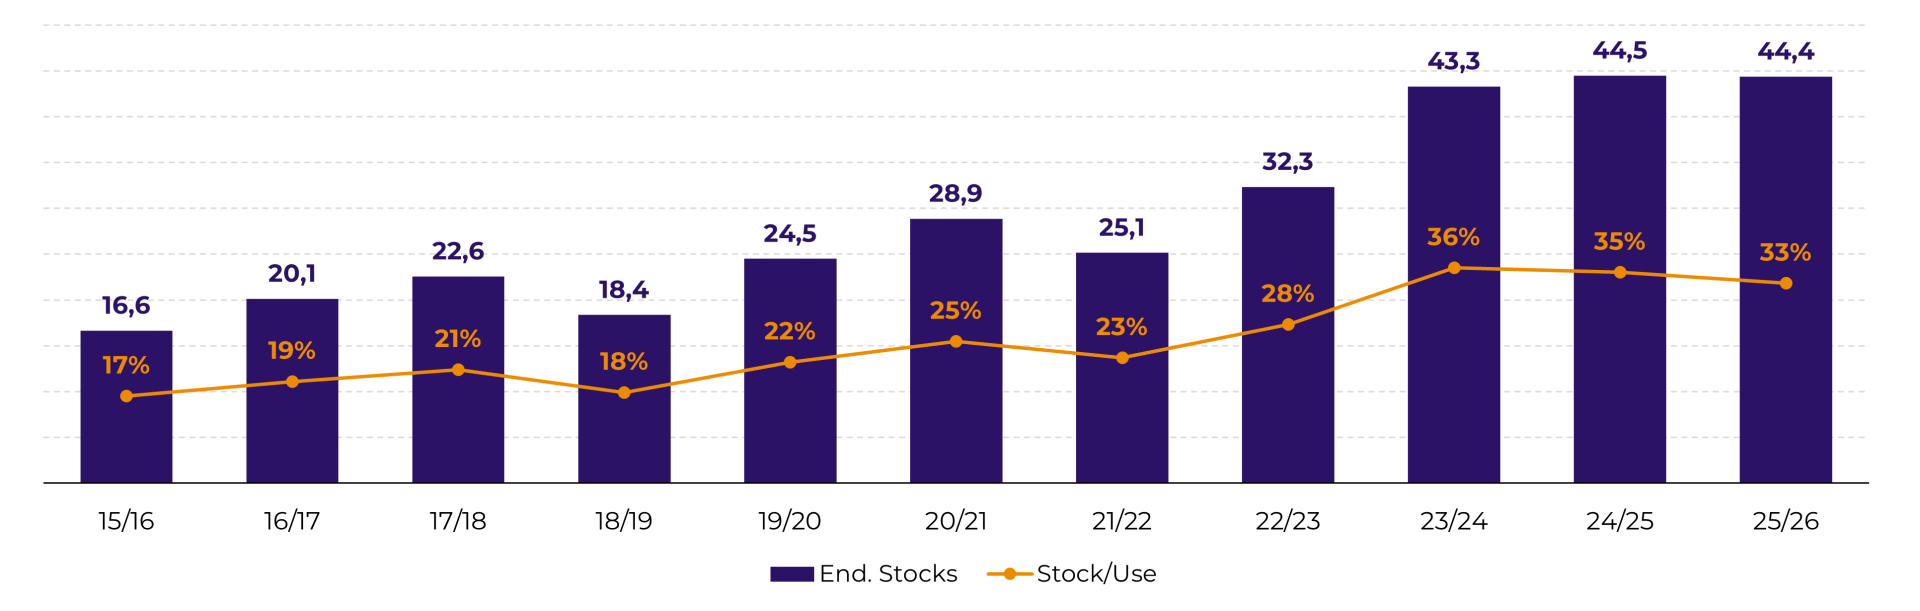
Source: USDA, Hedgepoint
Soybean - China - Supply and Demand (M ton)
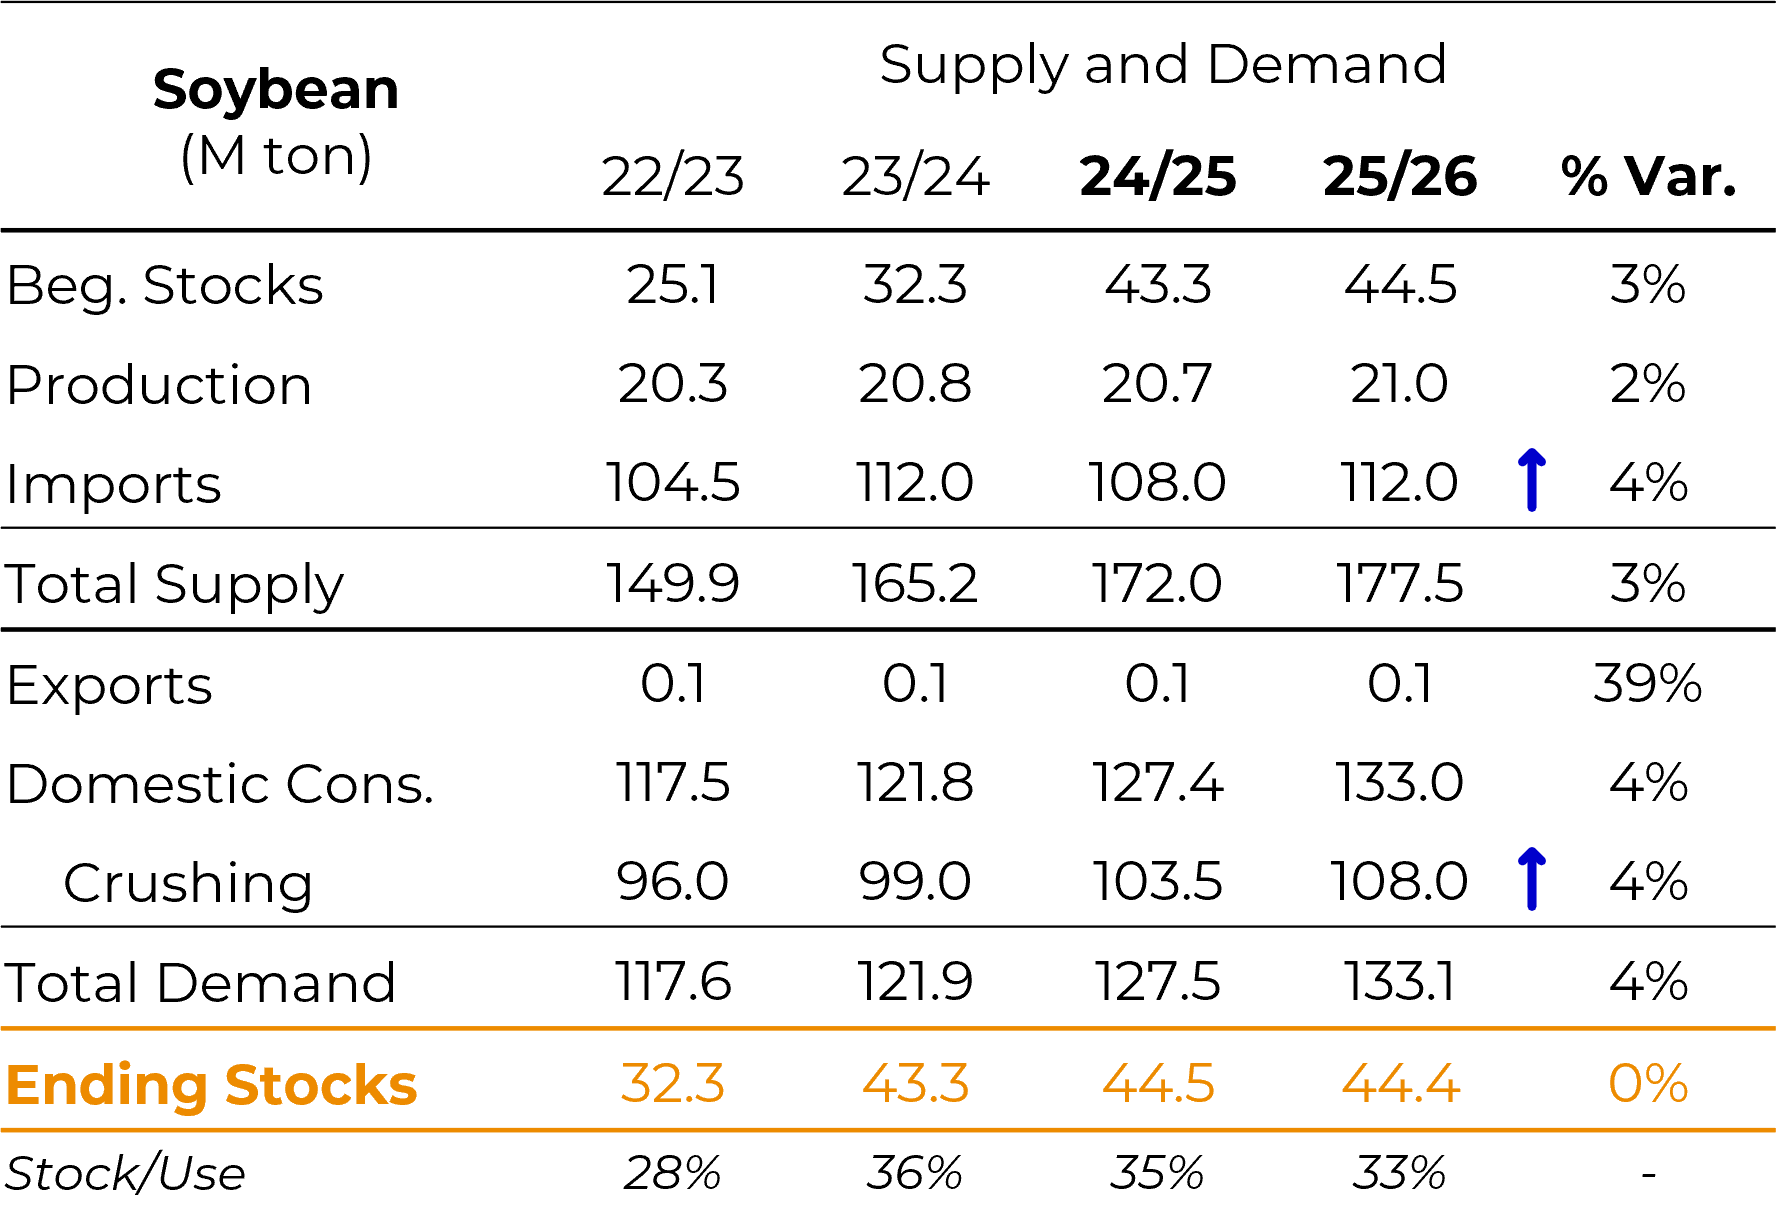
Source: USDA, Hedgepoint
Soybean - FOB Prices - Main Origins - in USD/ton
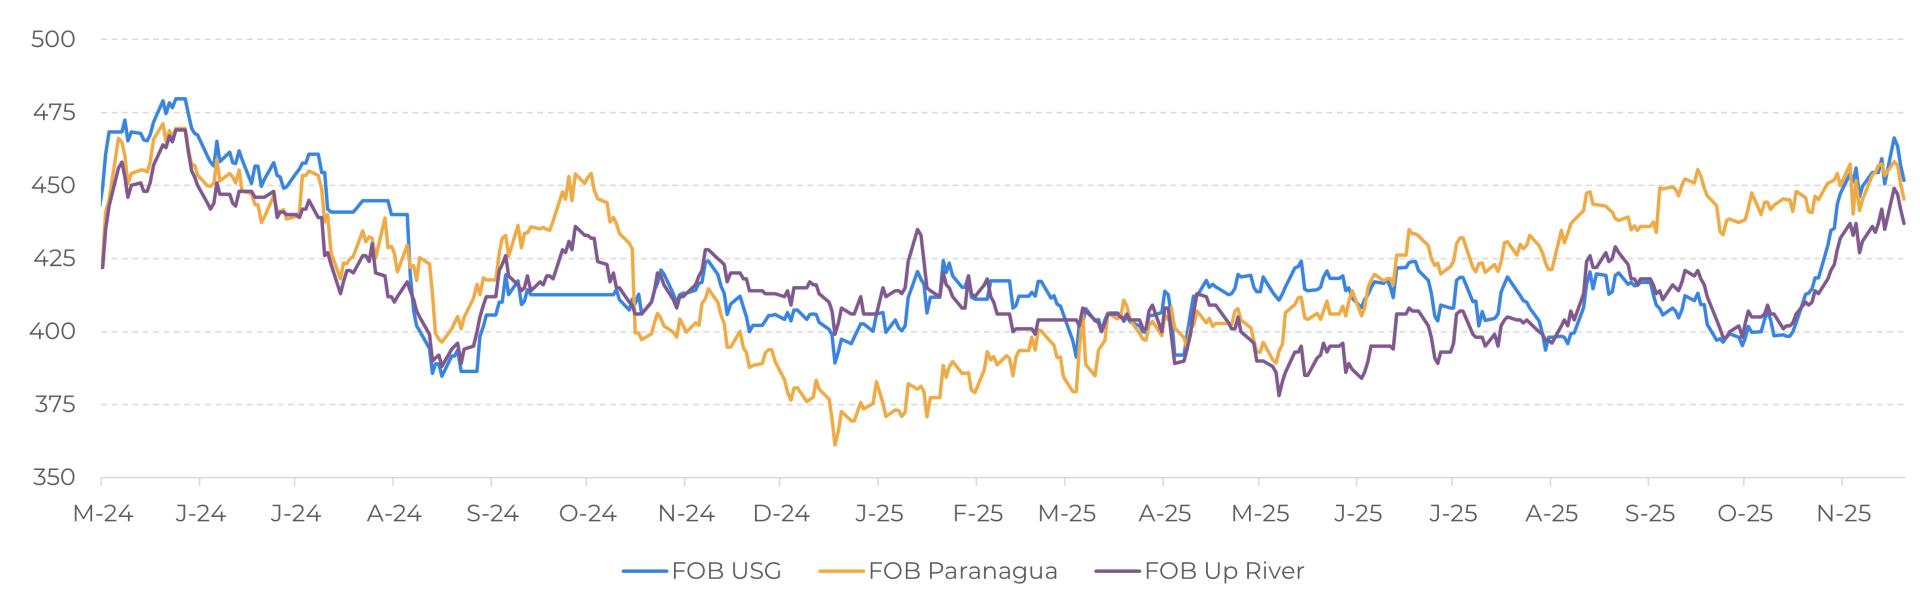
Source: LSEG, Hedgepoint
USA
USA
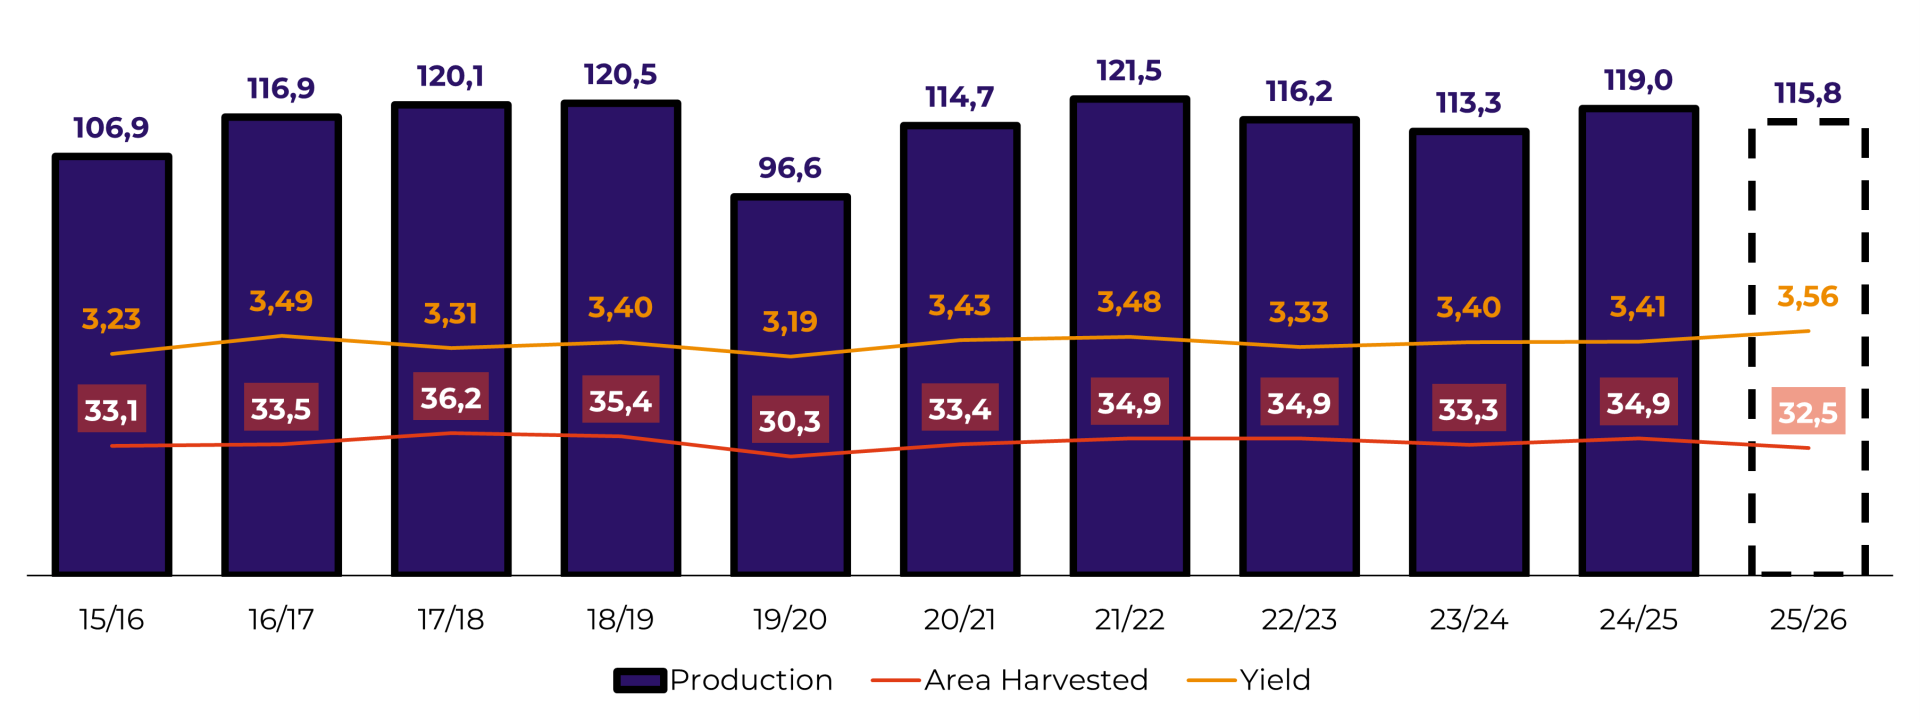
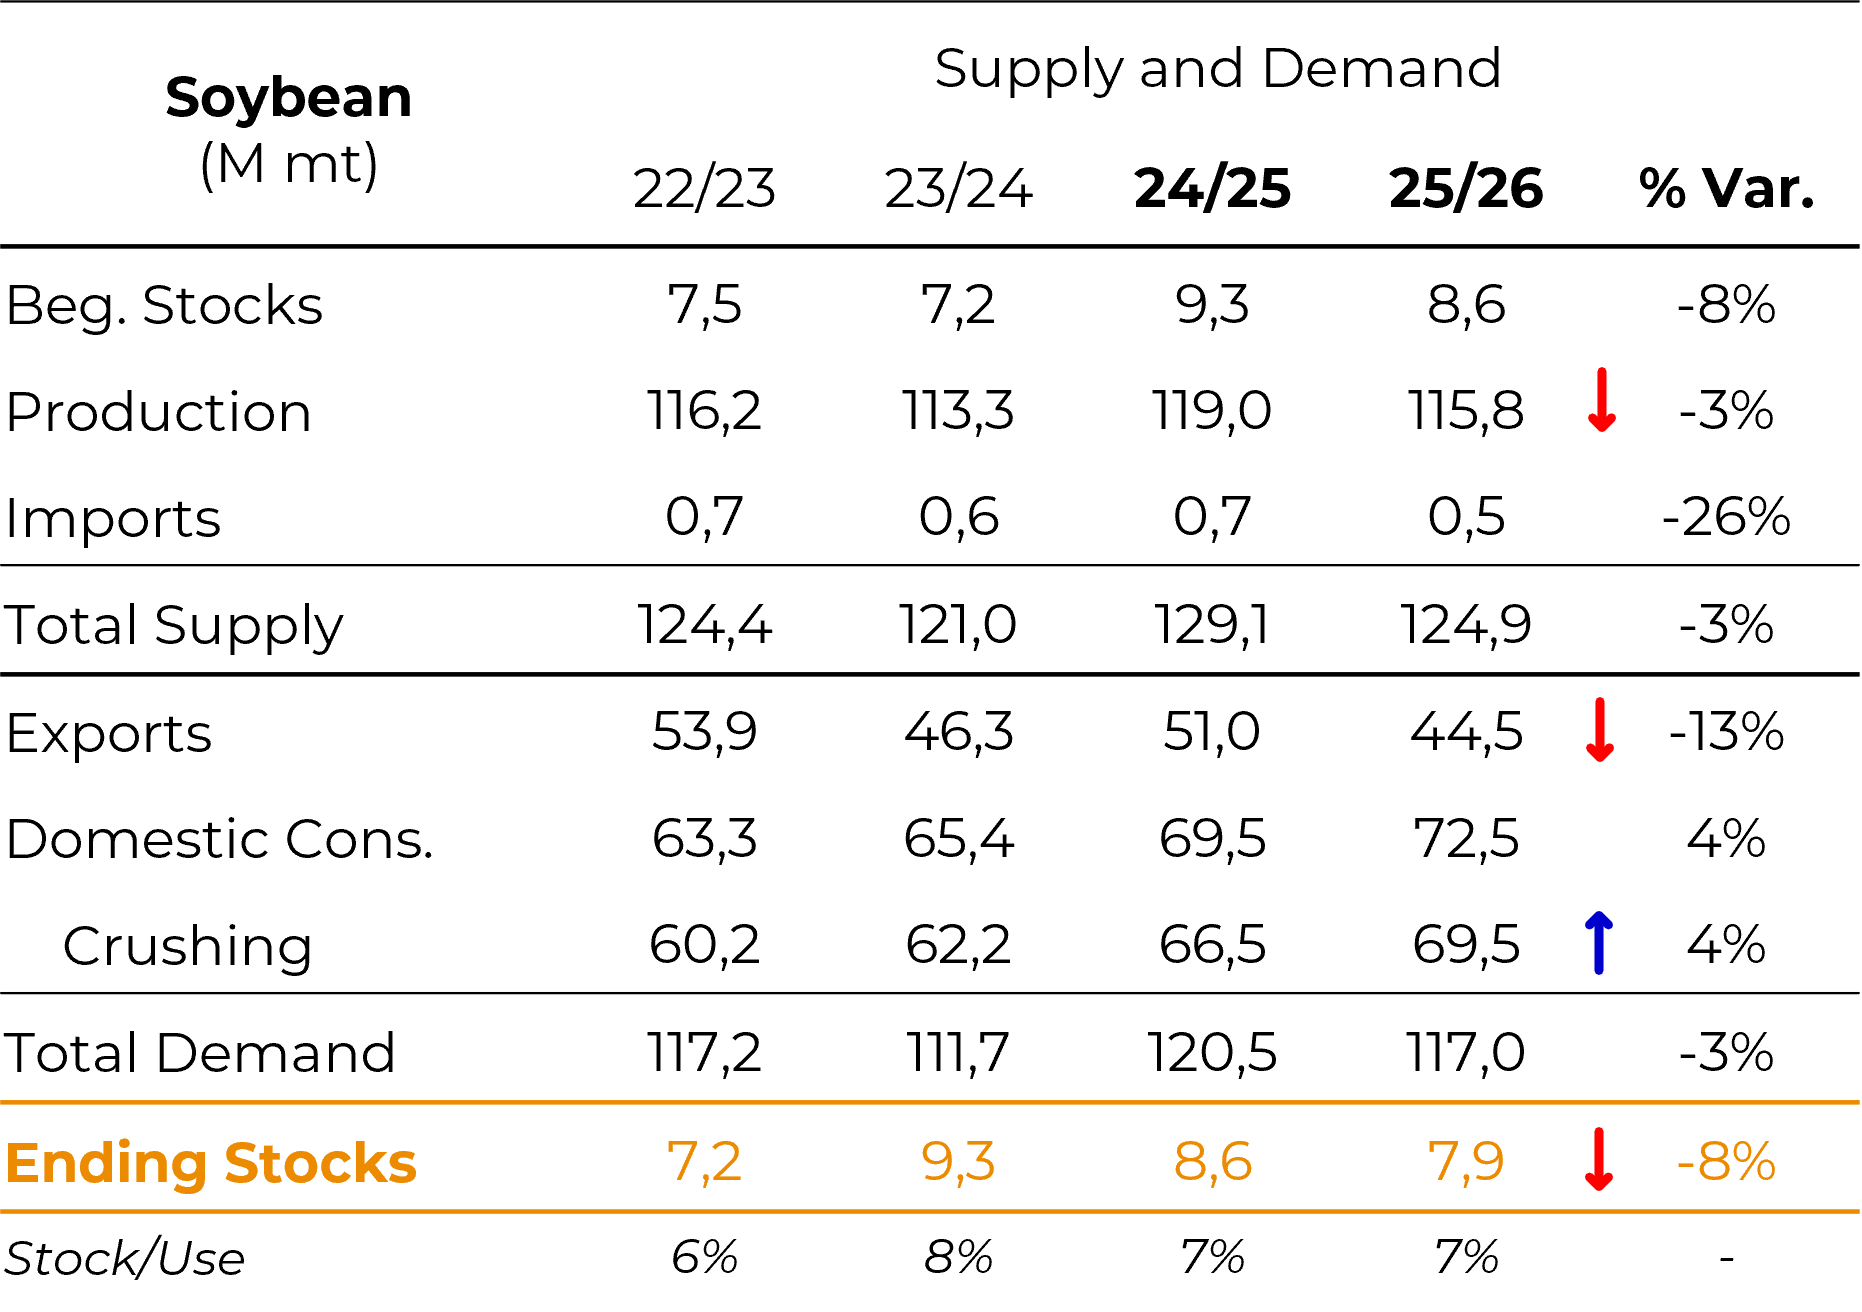
- Production: The USDA revised the 2025/26 crop to 115.8 million tons (down from the previous estimate), despite record yield. A reduction in the planted area (approximately -2.5 million ha) limited production potential.
- Exports: Projection fell to 44.5 million tons (vs. 51 million tons in the previous crop). The current pace of export sales is approximately 7 million tons below the previous year, a direct reflection of China's absence until October.
- Crushing: Historic record, supported by exports of soymeal and soyoil and expectations of an increase in the biofuel blend (EPA proposal still pending). If approved, the proposal could reduce soybean and soyoil stocks and increase meal stocks.
- Prices: Chicago broke through the US$ 10-10.80 range, reaching US$ 11.30-11.40/bu, with room to reach US$ 12/bu according to regression studies regarding the stock/use ratio vs. prices.
- Implications: Possible EPA approval could provide further support and momentum for soybean and soyoil prices (strong domestic consumption), but generate excess of soymeal (putting pressure on international prices). Soybean exports depend on China meeting its purchase target.
USA Soybean - Production (M ton), Harvested Area (M ha) and Yield (ton/ha)
Source: USDA, Hedgepoint
Soybean - USA - Supply and Demand (M ton)
Source: USDA, Hedgepoint
Brazil
Brazil
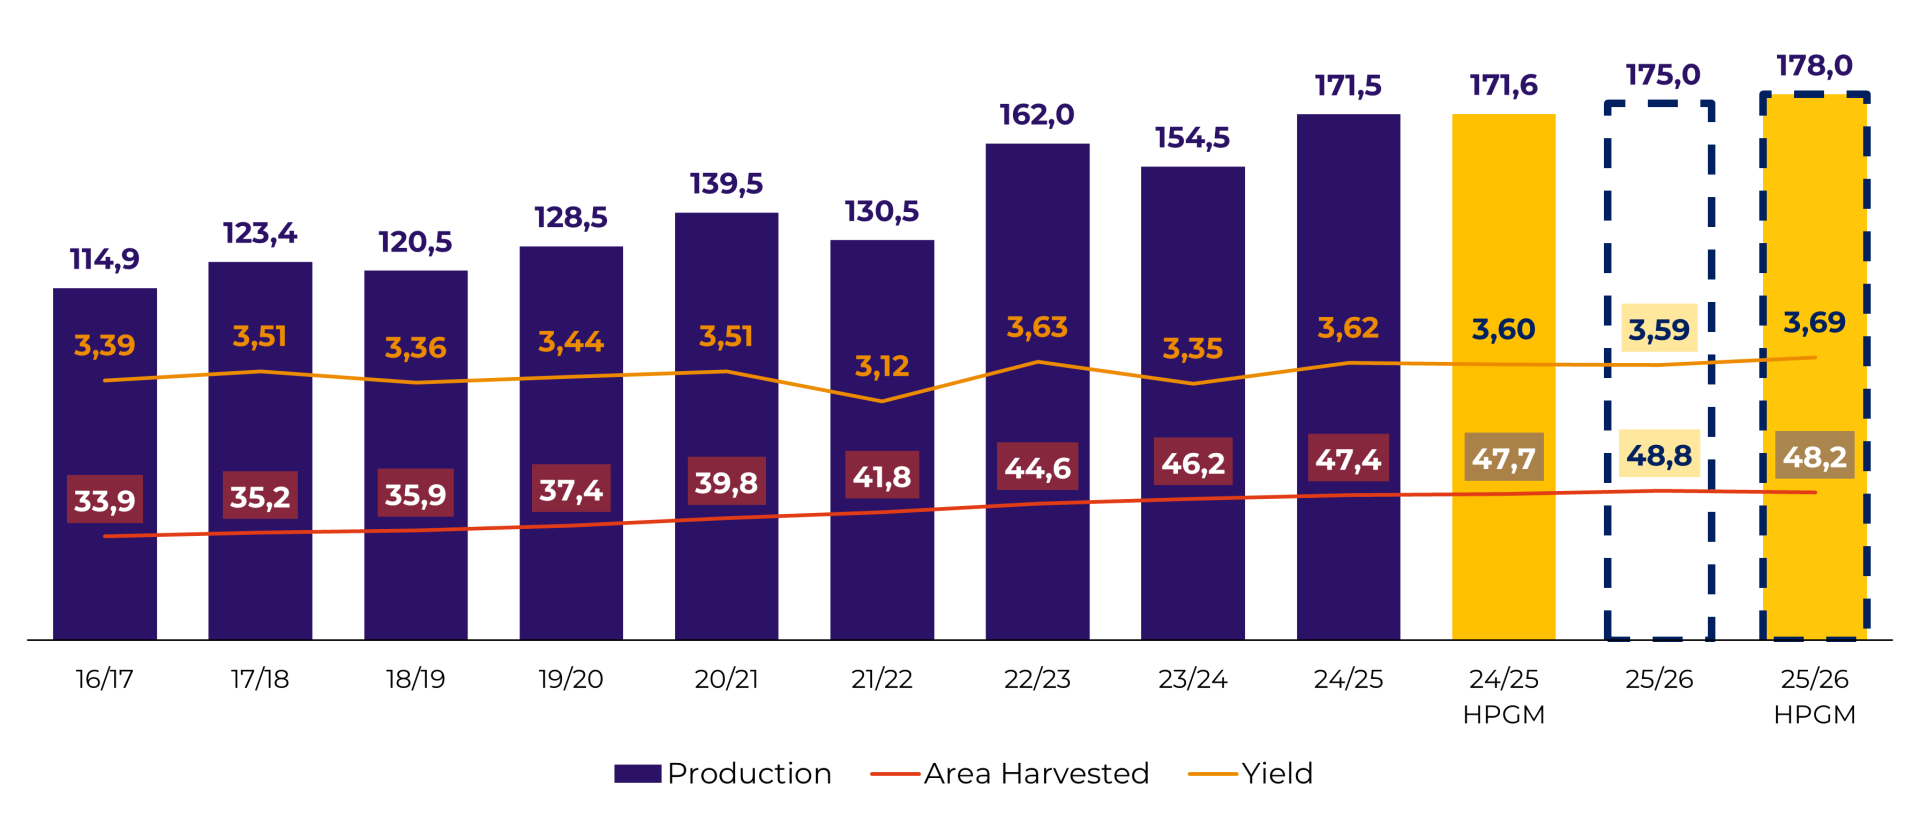
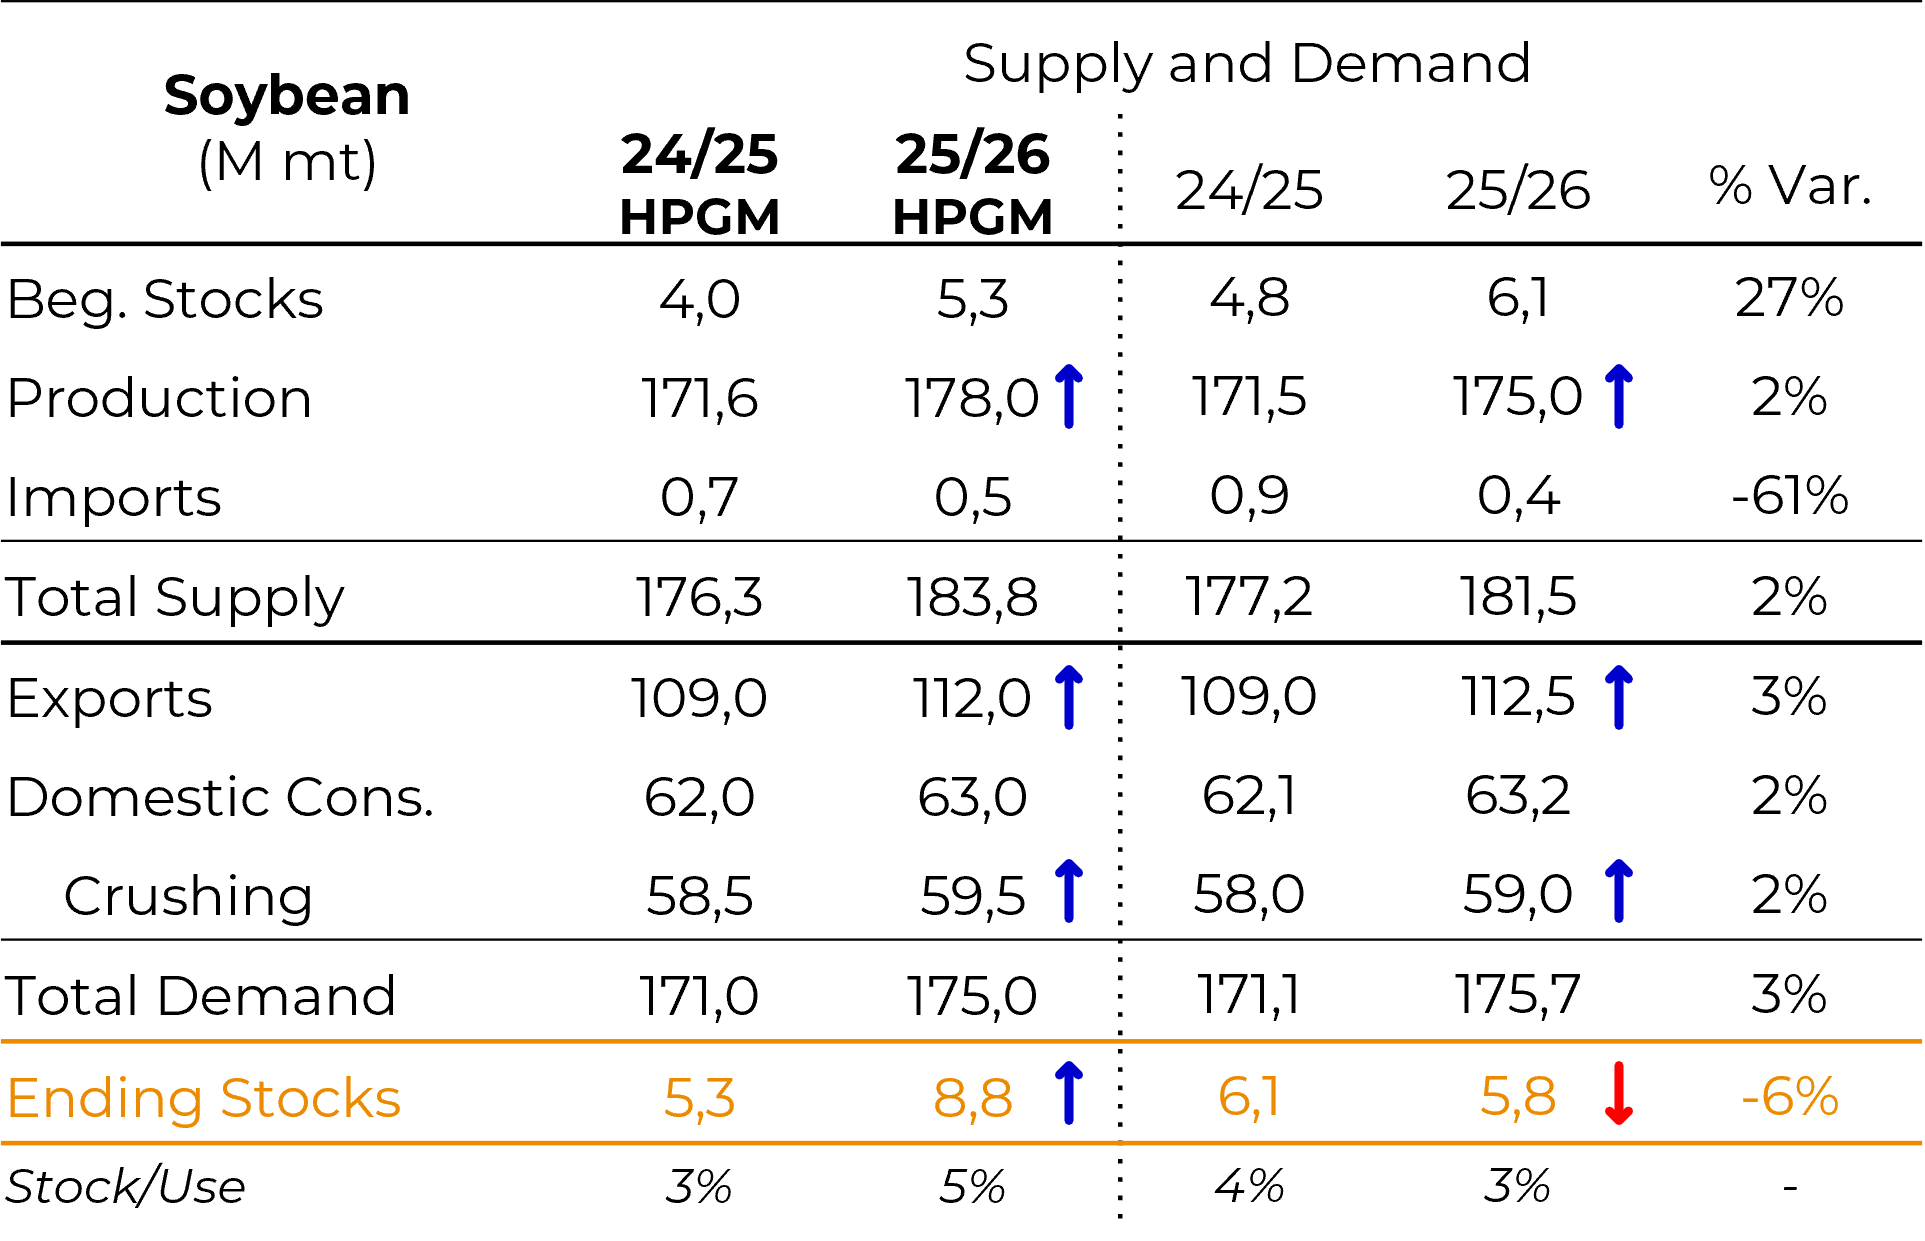
- Crop: Projected at 178 million tons for 2025/26, with room for adjustments. The stock-to-use ratio may rise from 3% to 5%, with more comfortable stocks. Exports are expected to close 2024/25 at a record level of 109 million tons, supported by Chinese demand.
- Planting: Delays in planting progress caused concern, but the pace has improved in recent days (around 80% completed, only 4 p.p. below average). Despite the delays, there is no relevant historical correlation between delays and production losses. A greater impact is expected for the "second crop" of corn, which may have a reduced window for planting.
- Weather: La Niña active until January (~69% probability), bringing drought risk to southern Brazil and Argentina. Possible above- al temperatures between December and January increase the risk of water stress, but no extremes are expected.
- Domestic demand: Low crushing margins limit industrial appetite, putting pressure on premiums and basis. Slow sales: only 25% of the new crop sold.
- Soymeal and soyoil: Growth potential, but there are challenges for meal exports (competition with Argentina and the US and EU deforestation policy). A further increase in demand for soyoil still depends on B16 (unlikely in an election year).
- Strategic risk: Delays in planting are likely to lead to delays in harvesting, which could shift Chinese demand to the US until the end of January.
Brazil Soybean - Production (M ton), Harvested Area (M ha) and Yield (ton/ha)
Source: USDA, Hedgepoint
Soybean - Brazil - Supply and Demand
Source: USDA, Hedgepoint
Argentina
Argentina
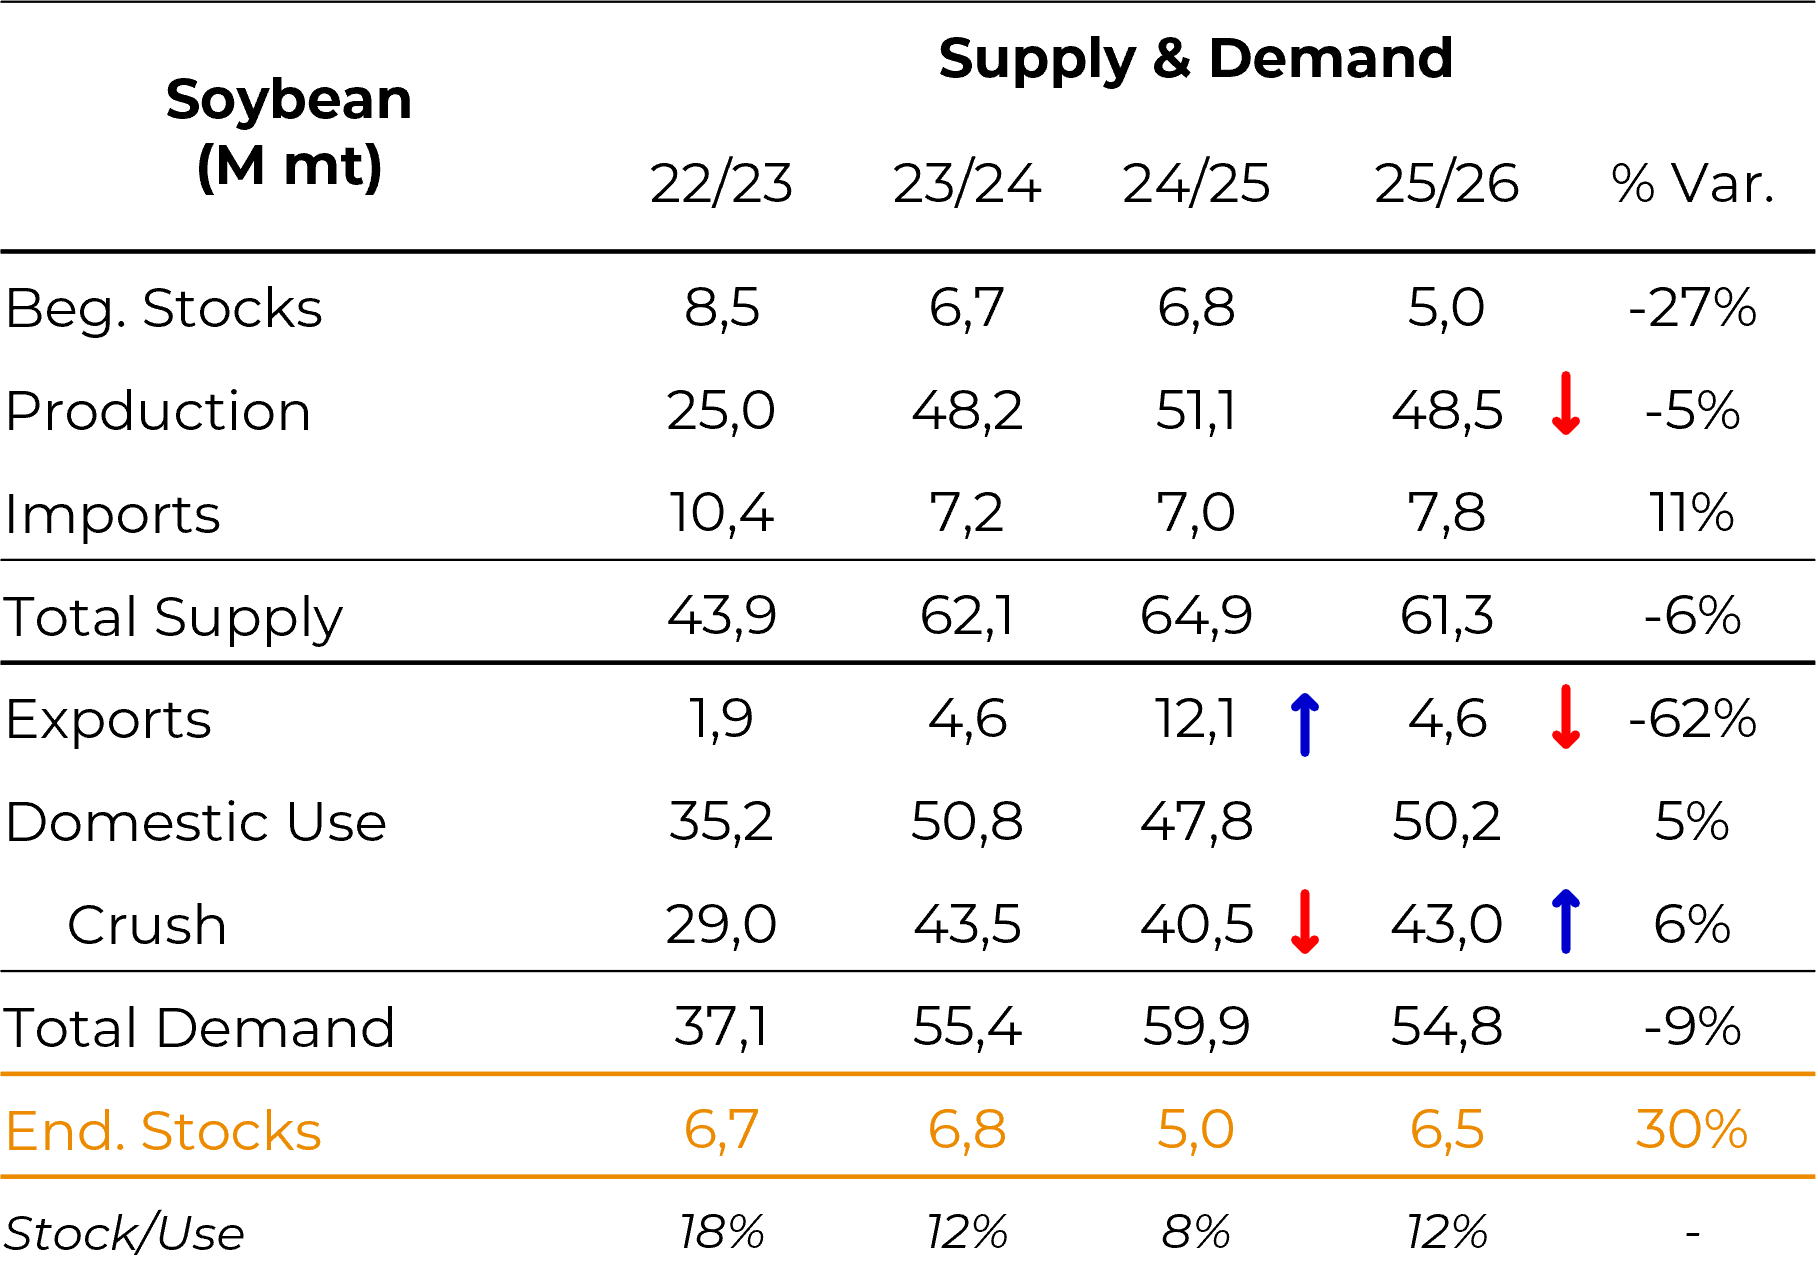
- 24/25 crop: Production revised to 51-52 million tons. Surprising exports: 12 million tons (double the initial estimate), driven by higher Chinese demand (trade war) and temporary tax cuts (September).
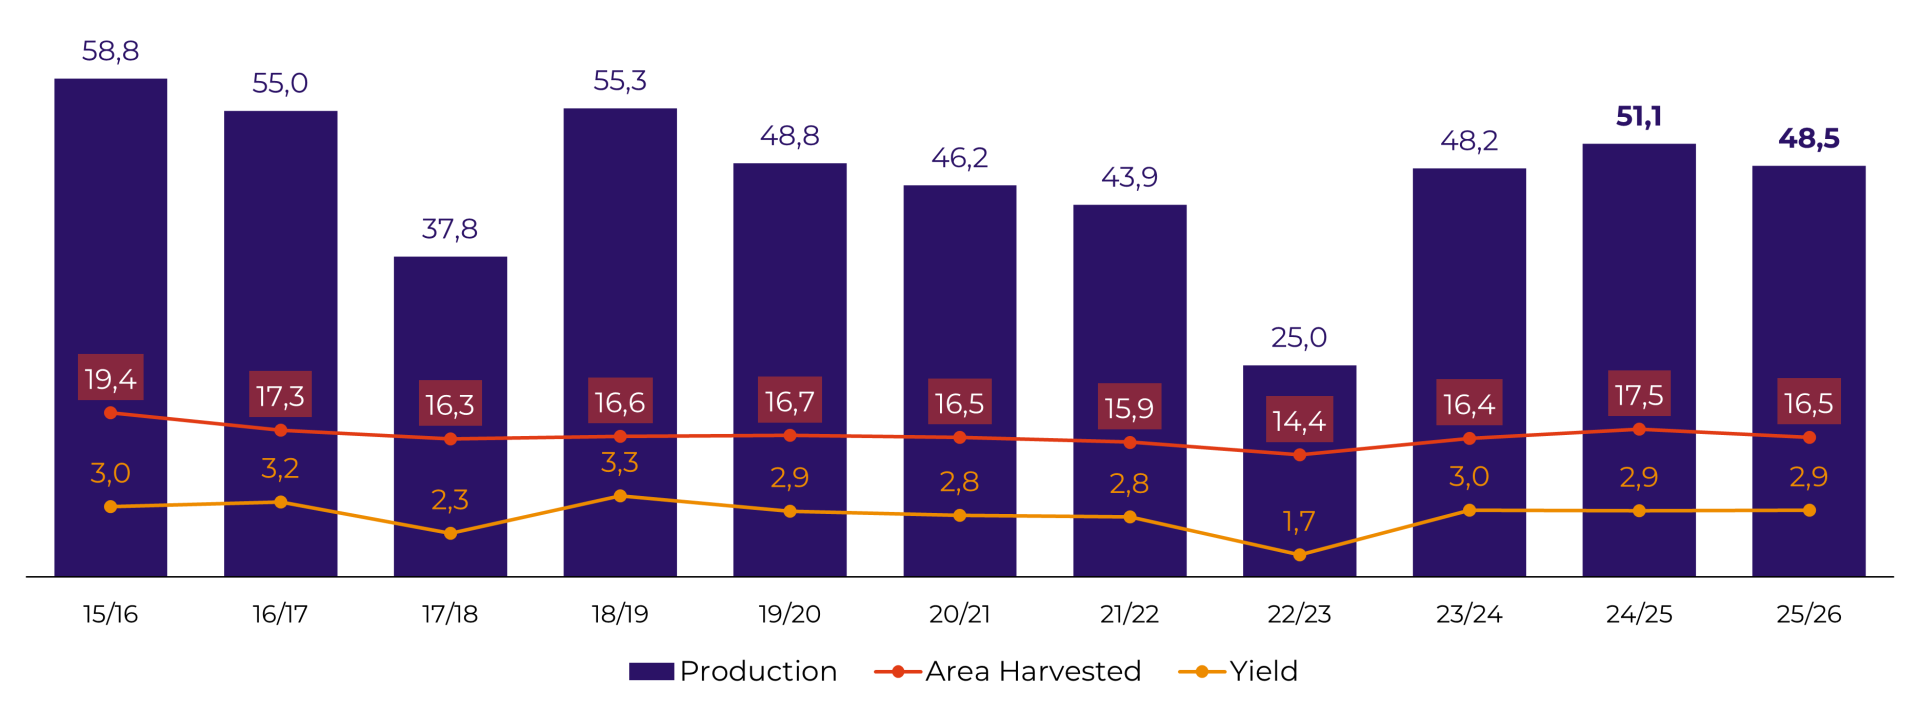
- 25/26 crop: Trend toward smaller soybean area (tight margins), with estimated production of 48.5 million tons. Exports should "return to normal" (4-6 million tons). La Niña may affect crop development, requiring monitoring.
- Soymeal and Soyoil: Argentina is expected to regain prominence in 2025/26, with exports close to 30 million tons of meal and 7 million tons of soyoil.
- Implications: Competition with Brazil will be intense in the meal market, especially if the EU moves forward with environmental restrictions. In addition, the US is also likely to be a major competitor (EPA proposal could increase US meal supply).
Argentina Soybean - Production (M ton), Harvested Area (M ha) and Yield (ton/ha)
Source: USDA, Hedgepoint
Soybean - Argentina - Supply and Demand
Source: USDA, Hedgepoint
Palm Oil
Indonesia & Malaysia
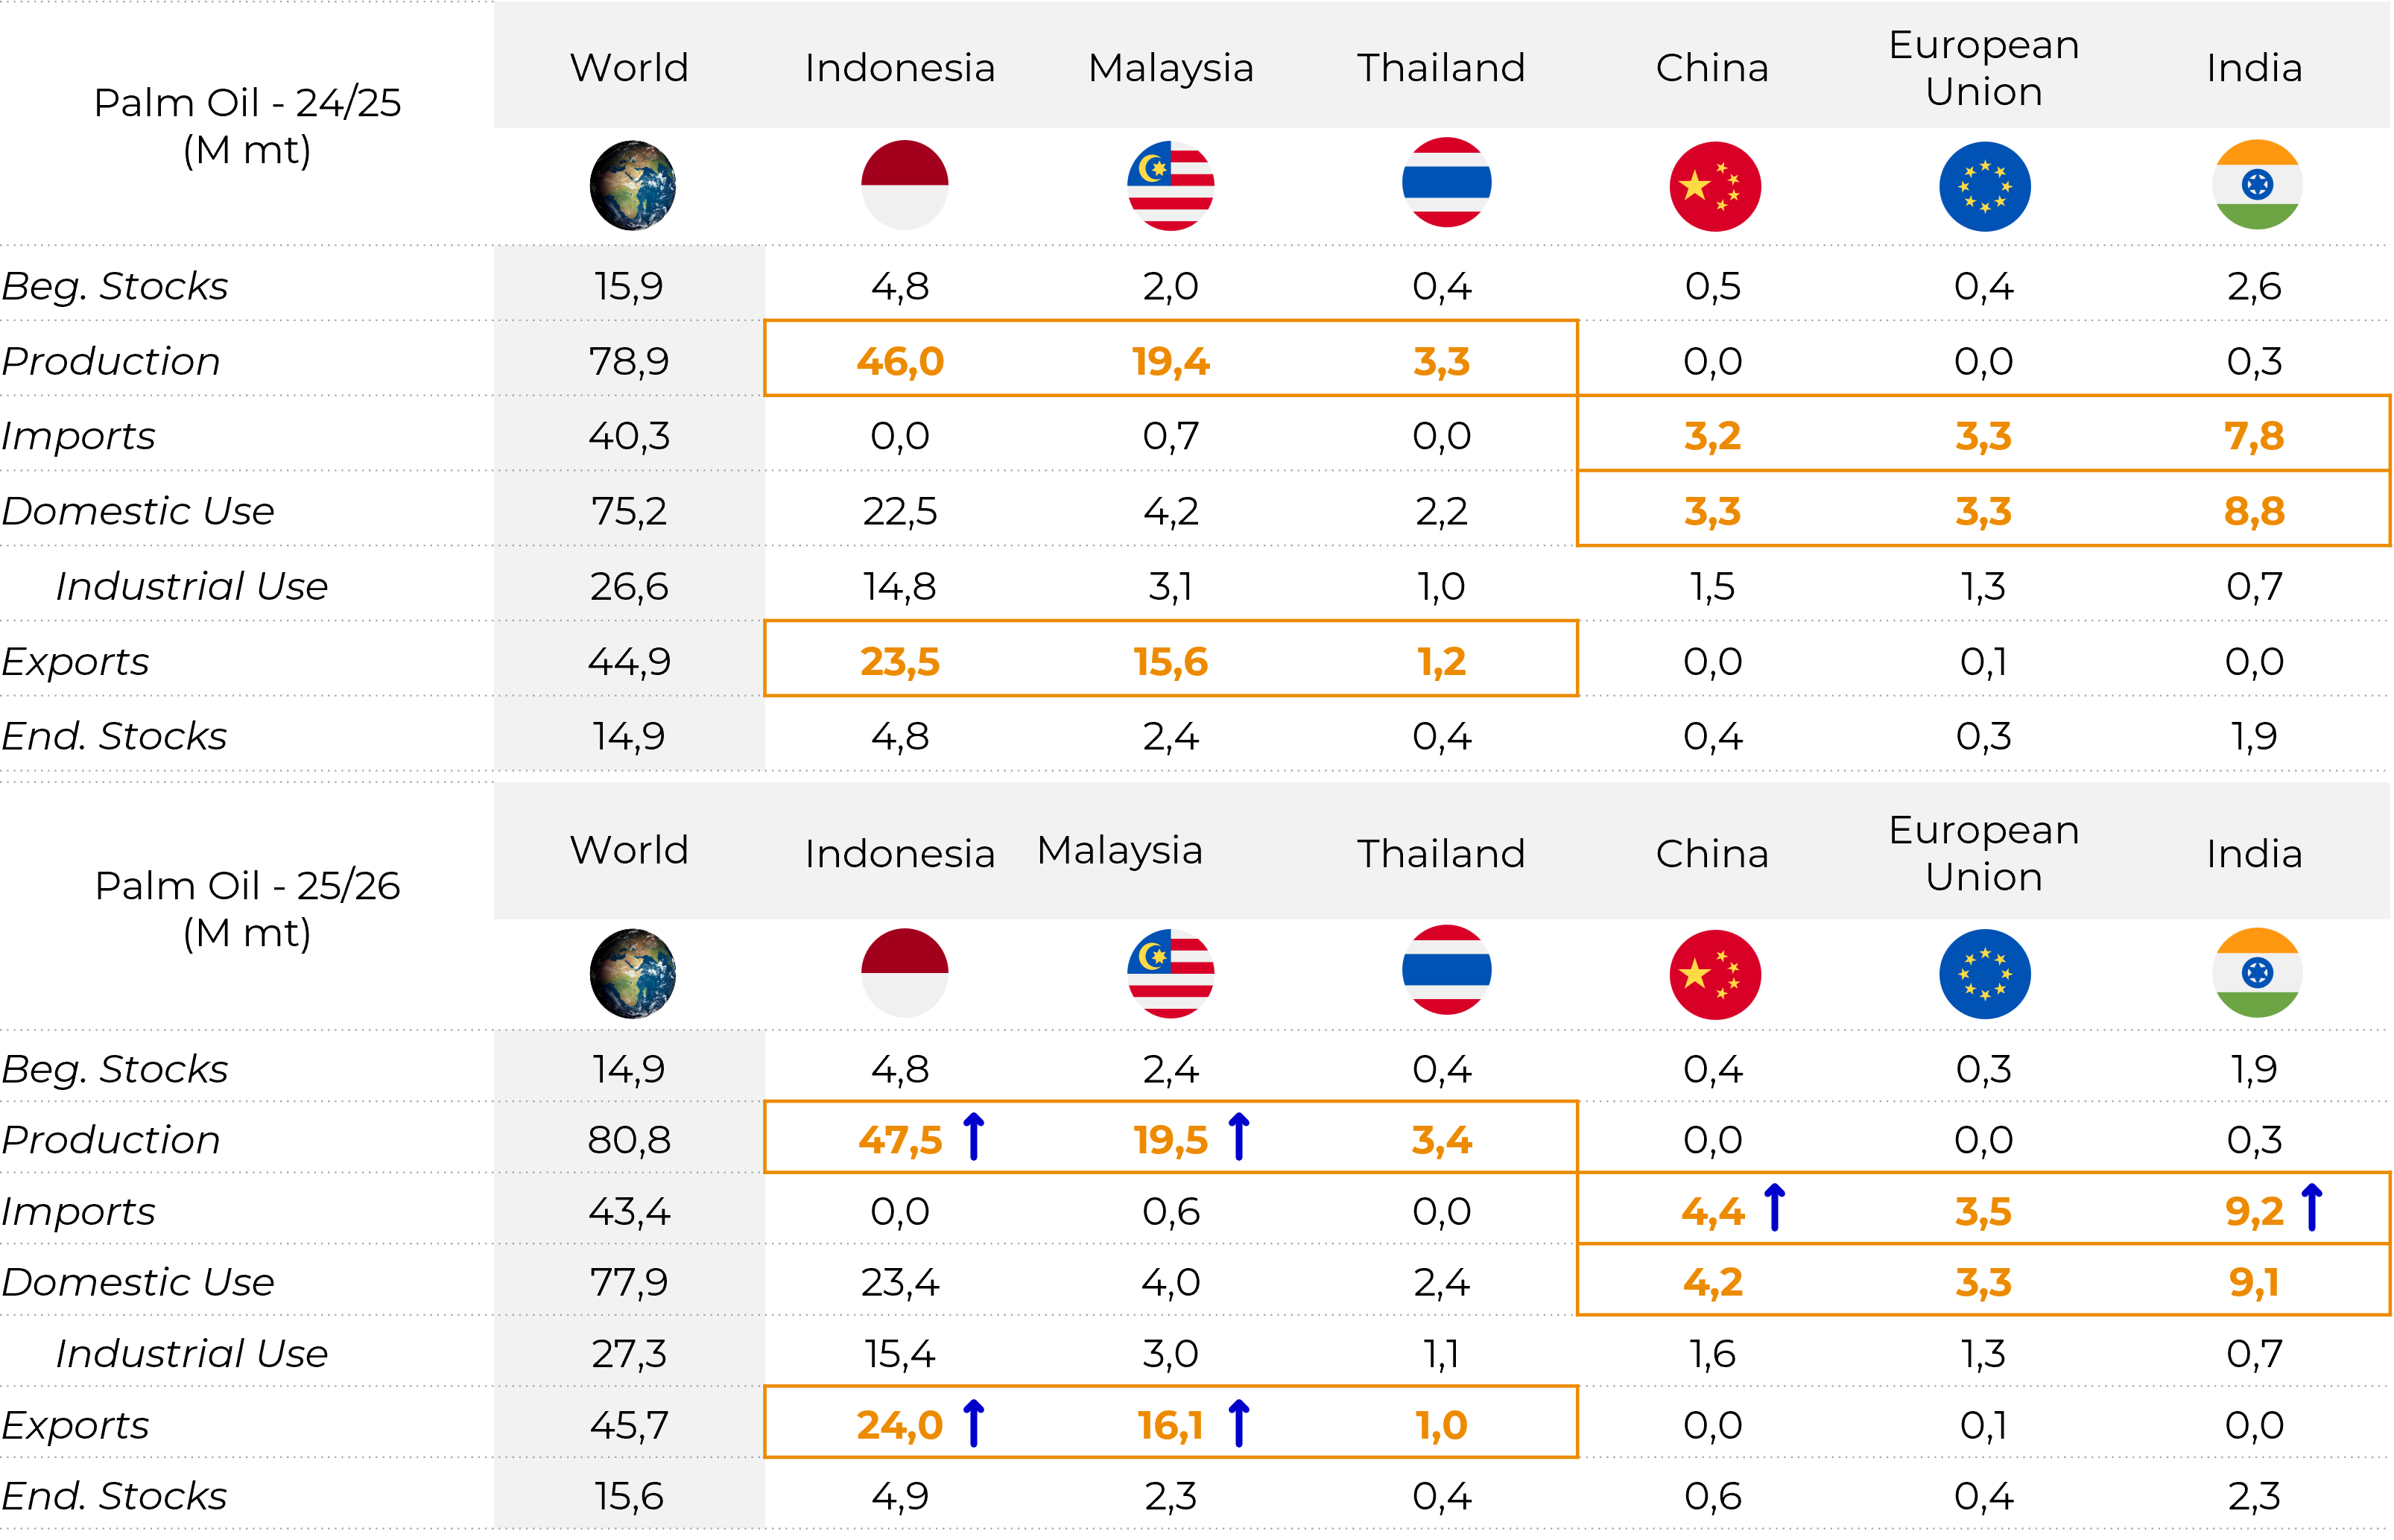
- Production and exports: Upward trend in Indonesia and Malaysia in 2025/26. India and China remain the main drivers of demand for palm oil from Southeast Asia.
- Weather: La Niña may bring above-average rainfall, posing more of a logistical risk (flooding) than a productive one.
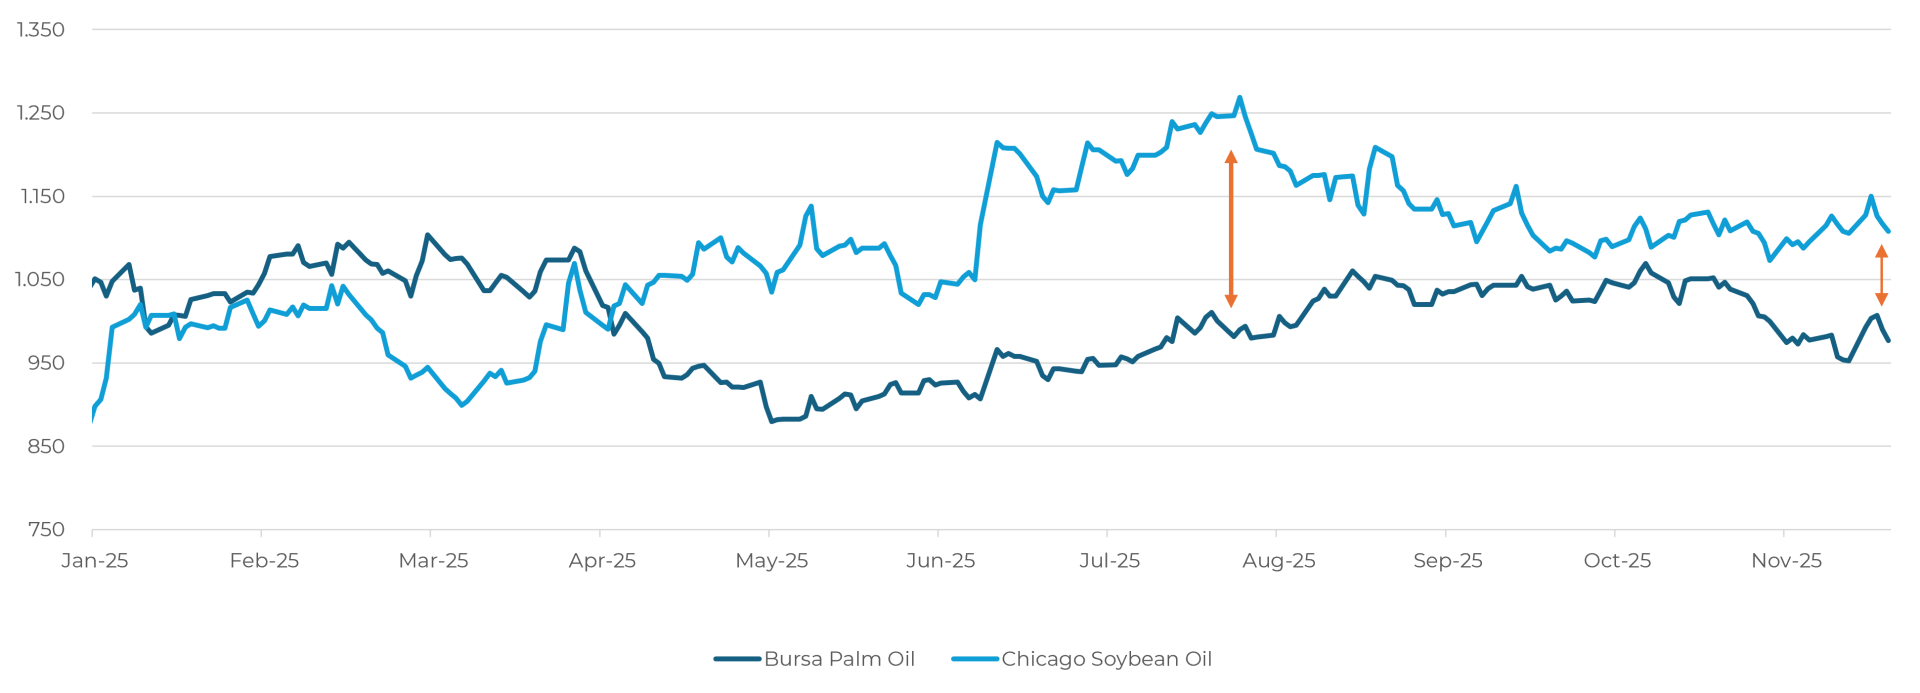
- Prices: The spread between soyoil and palm oil narrowed again after peaking in August, reducing the competitiveness of palm oil by-products. Regarding the relationship, it may change in 2026, requiring attention.
- Implications: Any logistical disruption could cause volatility in prices and spreads, affecting margins globally.
Palm Oil - World - Supply and Demand (M ton)
Source: USDA, Hedgepoint
Prices Comparison - Palm Oil vs Soybean Oil (USD)
Source: LSEG, Hedgepoint
Bulls and Bears
Bullish factors
- Agreement between the US and China: new purchases of American soybean
- South American weather market: La Niña alert
- New EPA proposal could boost crushing in the US in 2026
- US soybean stock tighter in 25/26 (lower production)
Bearish factors
- Possible new record crop in South America
- Tight crushing margins in China may limit demand
- Low margins in Brazilian crushing may affect domestic demand
Final considerations
Final considerations
Link - November's Call
Written by Luiz F. Roque
Luiz.Roque@hedgepointglobal.com
Reviewed by Thais Italiani
Disclaimer


Contact us
Check our general terms and important notices.
We have updated our Terms & Conditions to reflect improvements to our platform, data handling practices, and the overall experience we provide to our clients.