
Fundamentals back in focus: U.S. Prospective Plantings point to new soybean and corn acreage
Fundamentals back in focus: U.S. Prospective Plantings point to new soybean and corn acreage
The important and highly anticipated U.S. “Prospective Plantings” report, released on March 31 by the U.S. Department of Agriculture (USDA), once again drew the market’s attention to fundamentals, providing the first official figures regarding the areas to be planted in the new 2026/27 U.S. crop year.
Soybeans | U.S. Planted Area (in millions of acres)
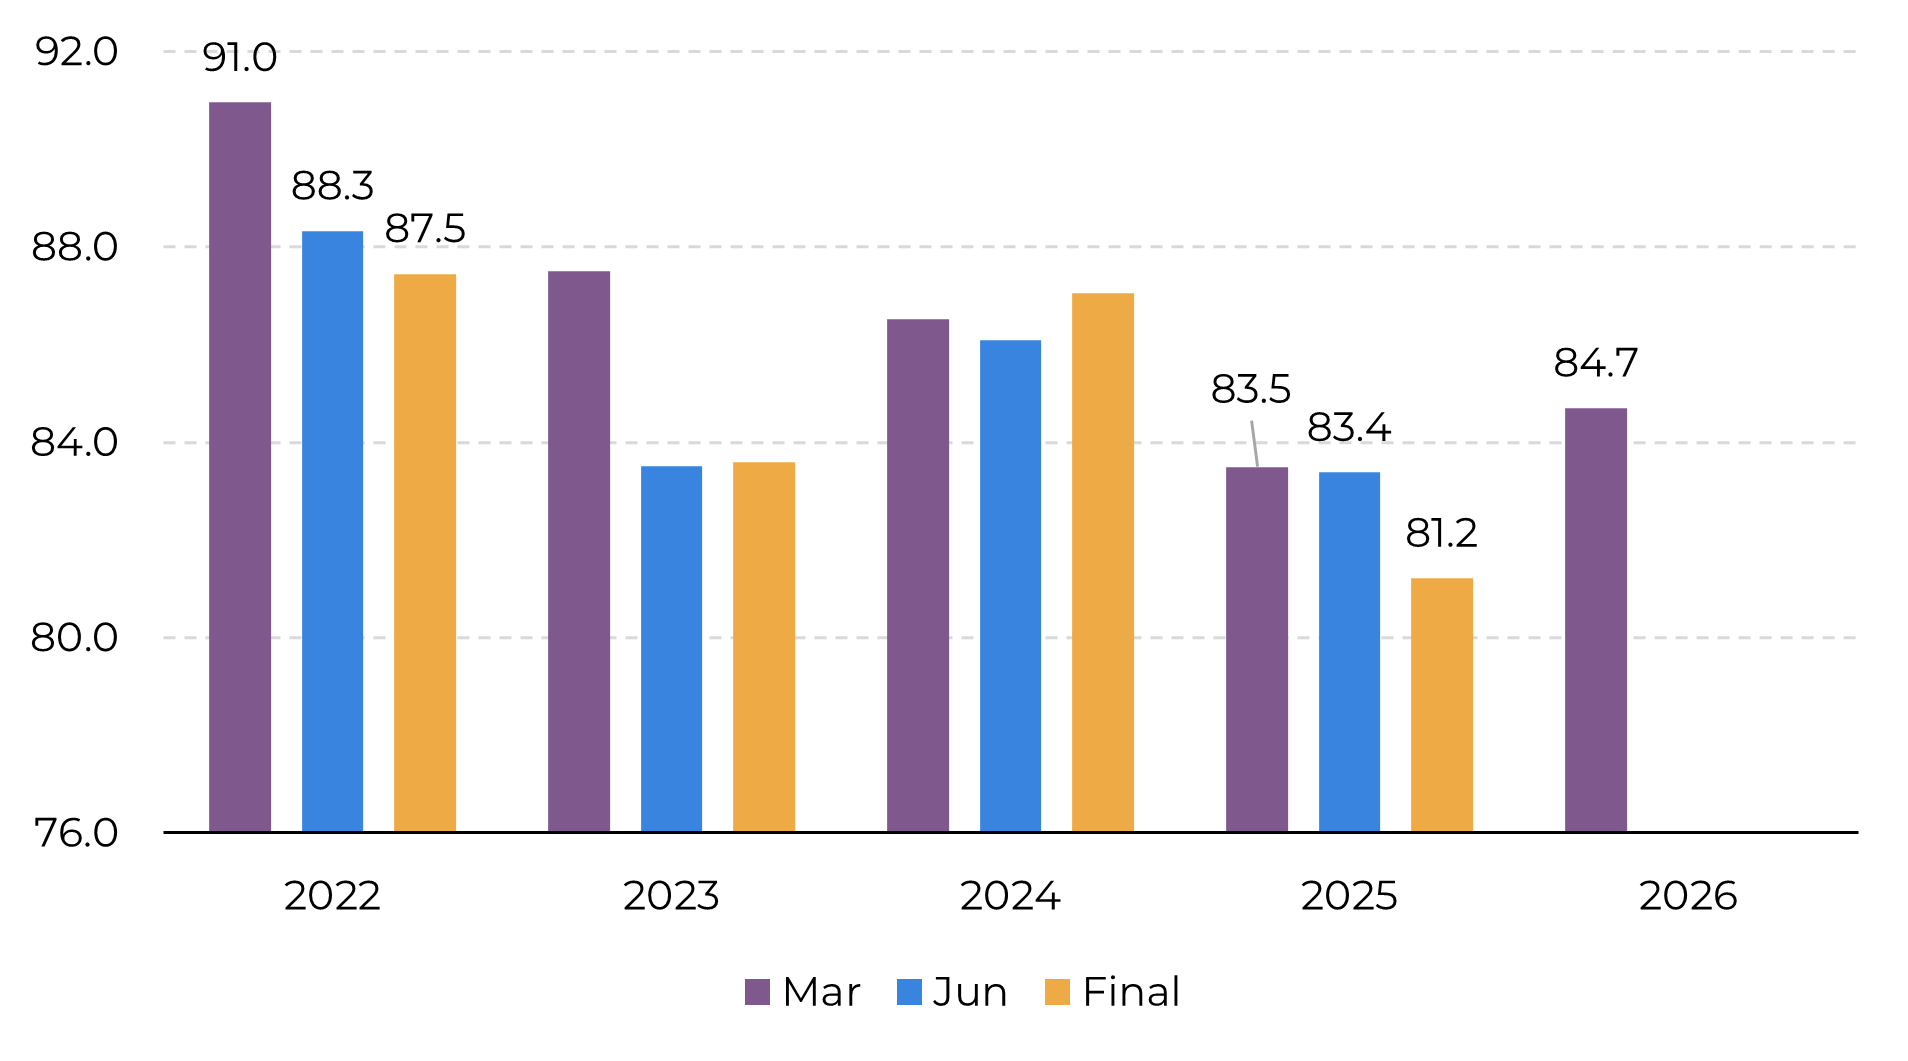
Source: USDA, Hedgepoint
Soybeans | U.S. Planted Area | States | 2026/27 vs. 2025/26 (% change)
Soybeans | U.S. Planted Area | States | 2026/27 vs. 2025/26 (% change)
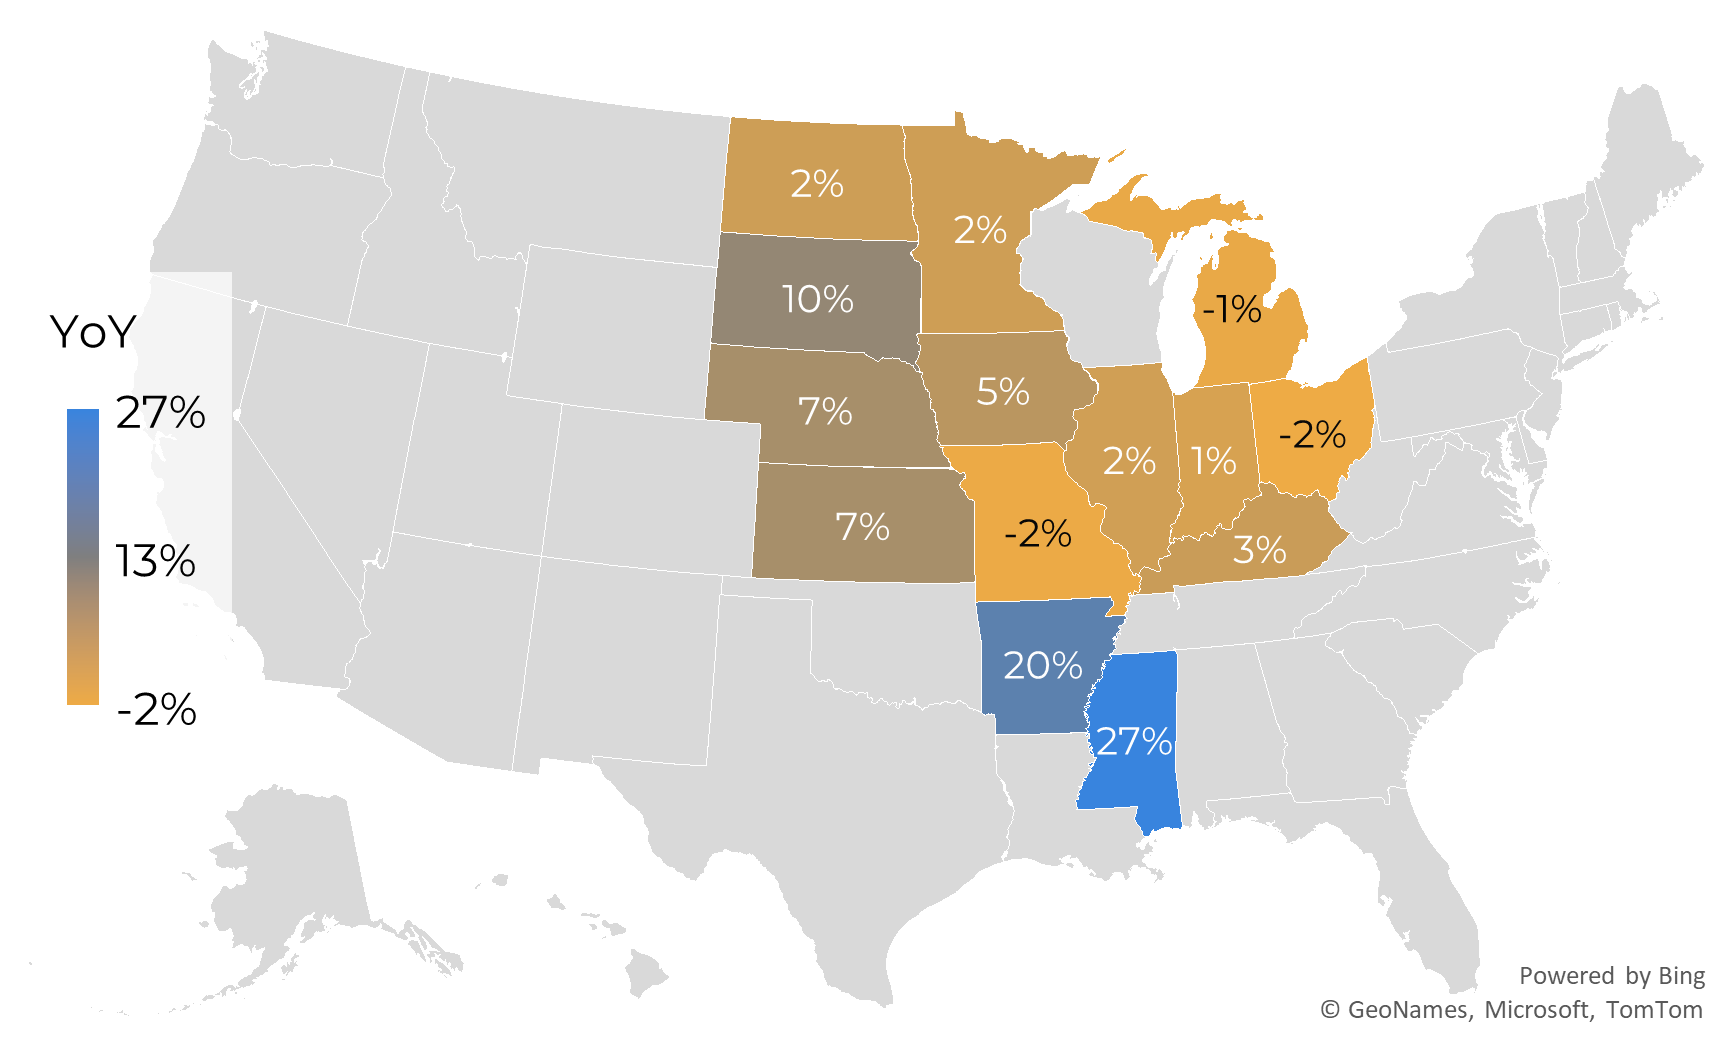
Source: USDA, Hedgepoint
As for corn, the USDA estimates that U.S. producers will plant 95.3 million acres in 2026/27, a decrease of 3.5 million acres from last season (98.8 million acres), or -3.5%. Unlike soybeans, the figure was 1.0% above market expectations (or 0.9 million acres), which had projected a corn area of 94.4 million acres.
Corn | U.S. Planted Area (in millions of acres)
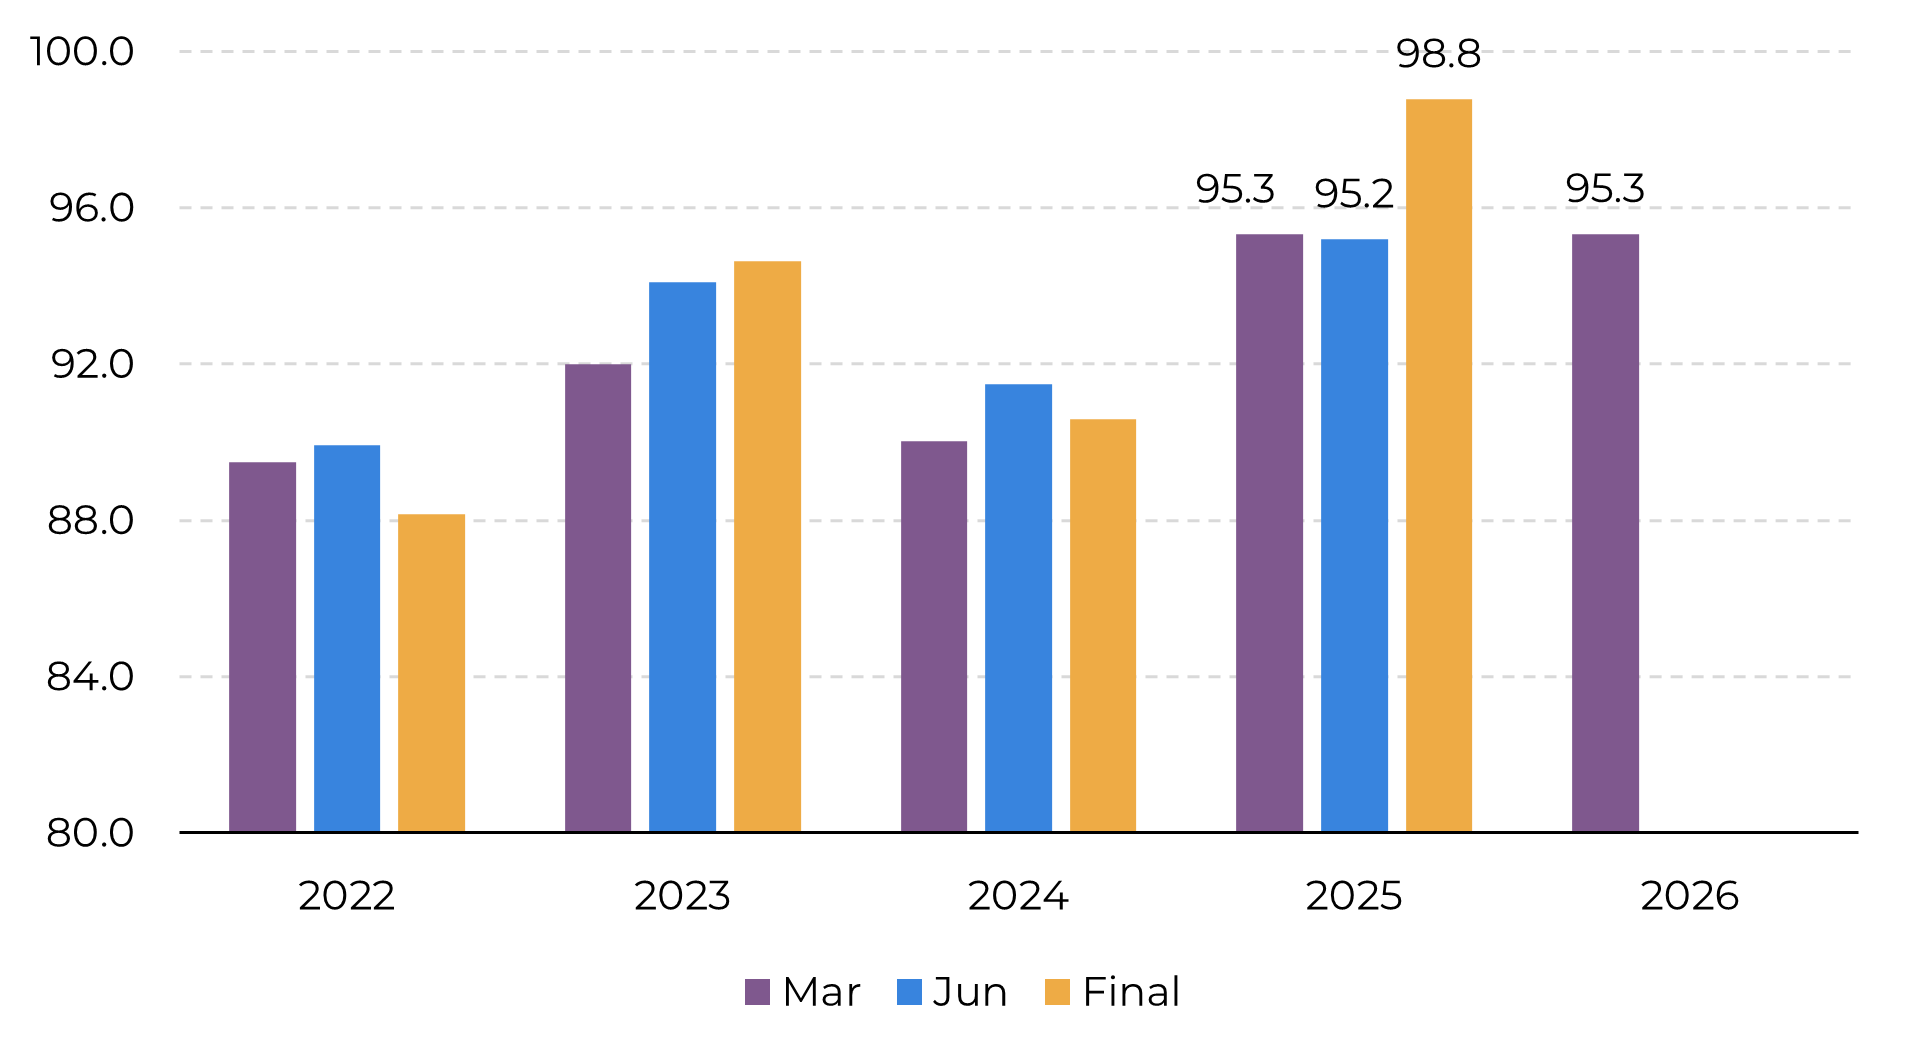
Source: USDA, Hedgepoint
Corn | U.S. Planted Area | States | 2026/27 vs. 2025/26 (% change)
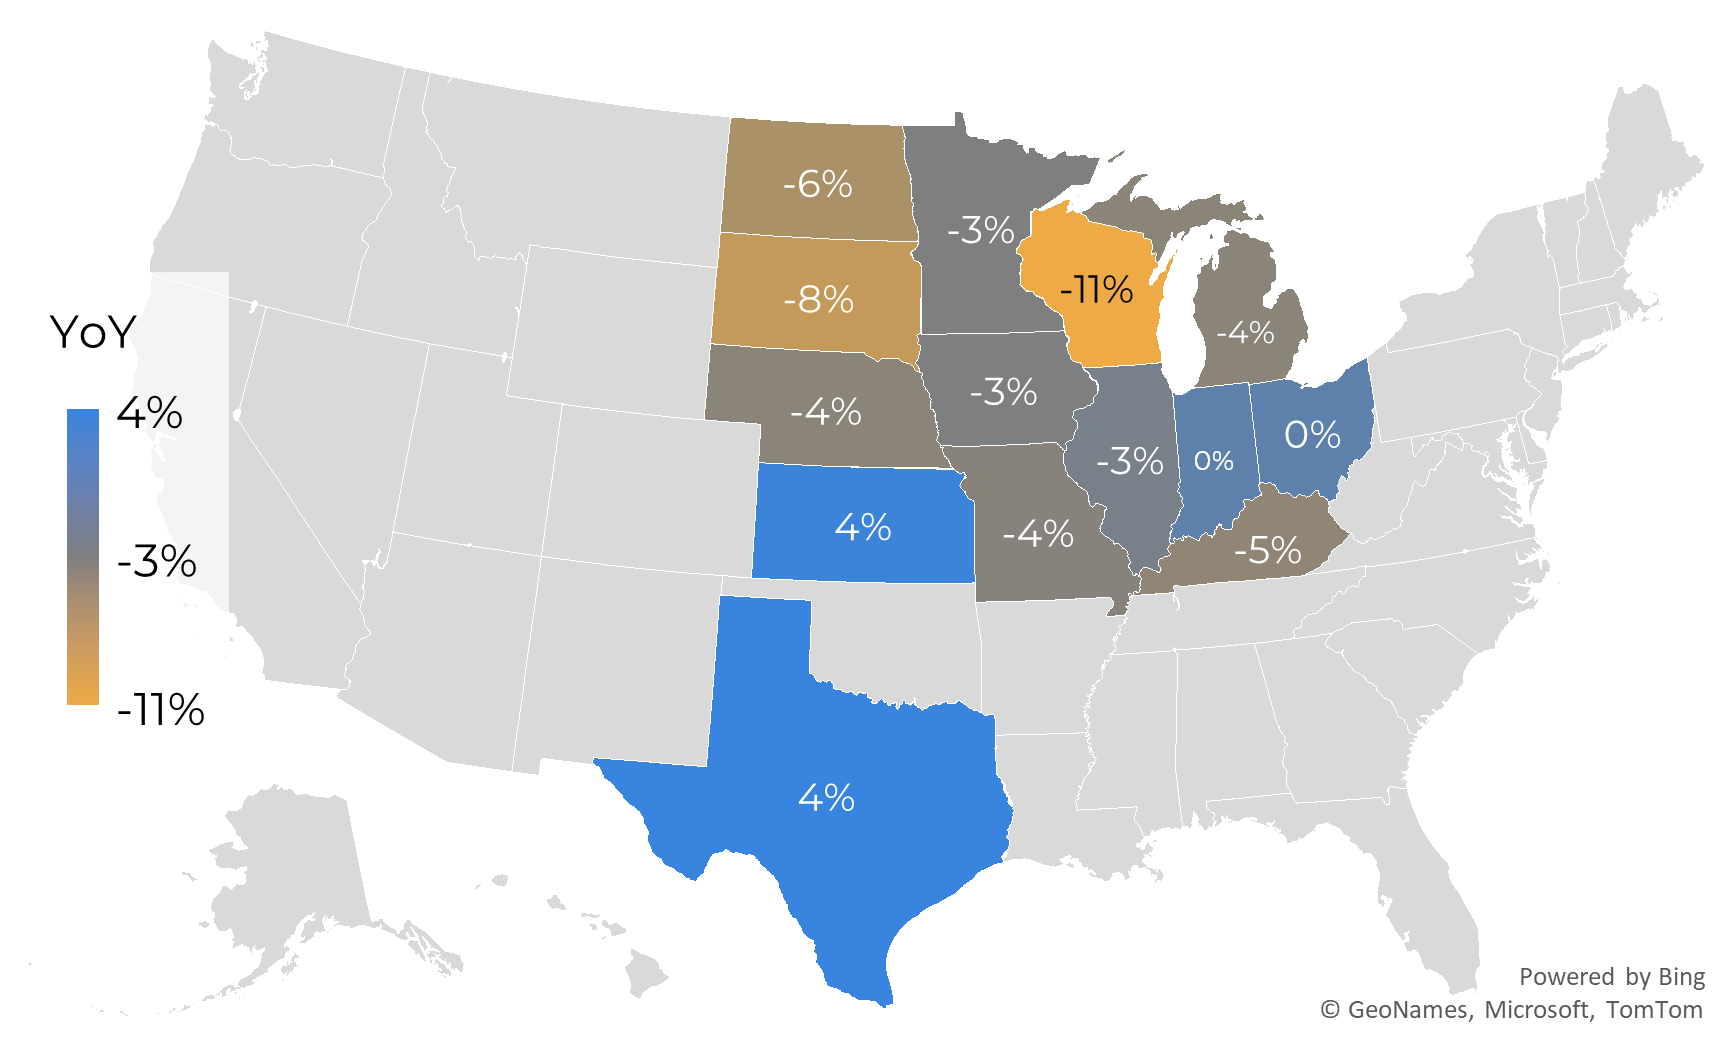
Source: USDA, Hedgepoint
Market expectations of an increase in soybean acreage and a reduction in corn acreage are supported by an improvement in the soybean-to-corn price ratio in favor of soybeans, a trend that has emerged in recent months. However, the high volatility triggered by the conflict between the U.S. and Iran since late February has brought significant uncertainty regarding production costs and prices for both commodities, impacting their price ratio. At this time, the soybean-to-corn ratio has once again become more favorable to corn, although the rise in international fertilizer prices brings new uncertainties, given the greater need for nitrogen fertilizers in corn cultivation.
Soybeans vs. Corn | CBOT Futures Ratio
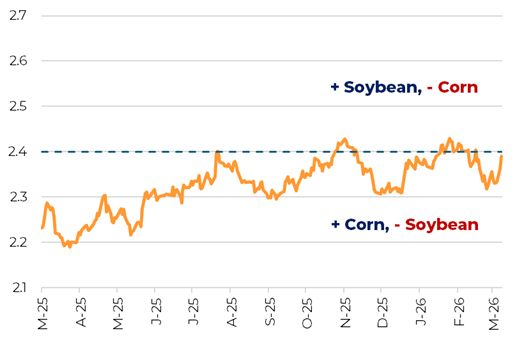
Source: LSEG, Hedgepoint
Given these factors, we highlight that there is a high probability of significant differences between the areas estimated in the “Planting Intentions” report (March 31) and the areas that will be reported in the “Planted Area” report, to be released on June 30.
Soybeans | U.S. | Supply and Demand (in M tons)
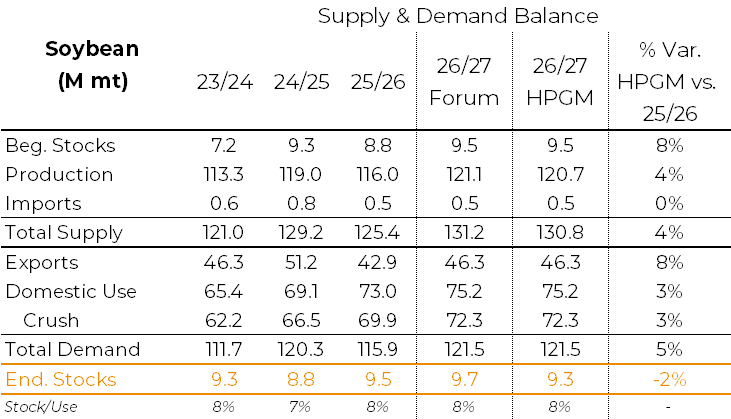
Source: USDA, Hedgepoint
Soybeans | U.S. | Supply and Demand (in M bushels)
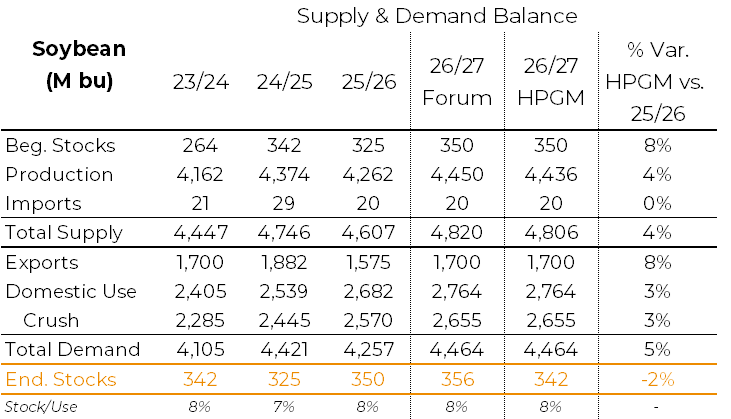
Source: USDA, Hedgepoint
Soybeans | U.S. | Stock/Use vs. Price
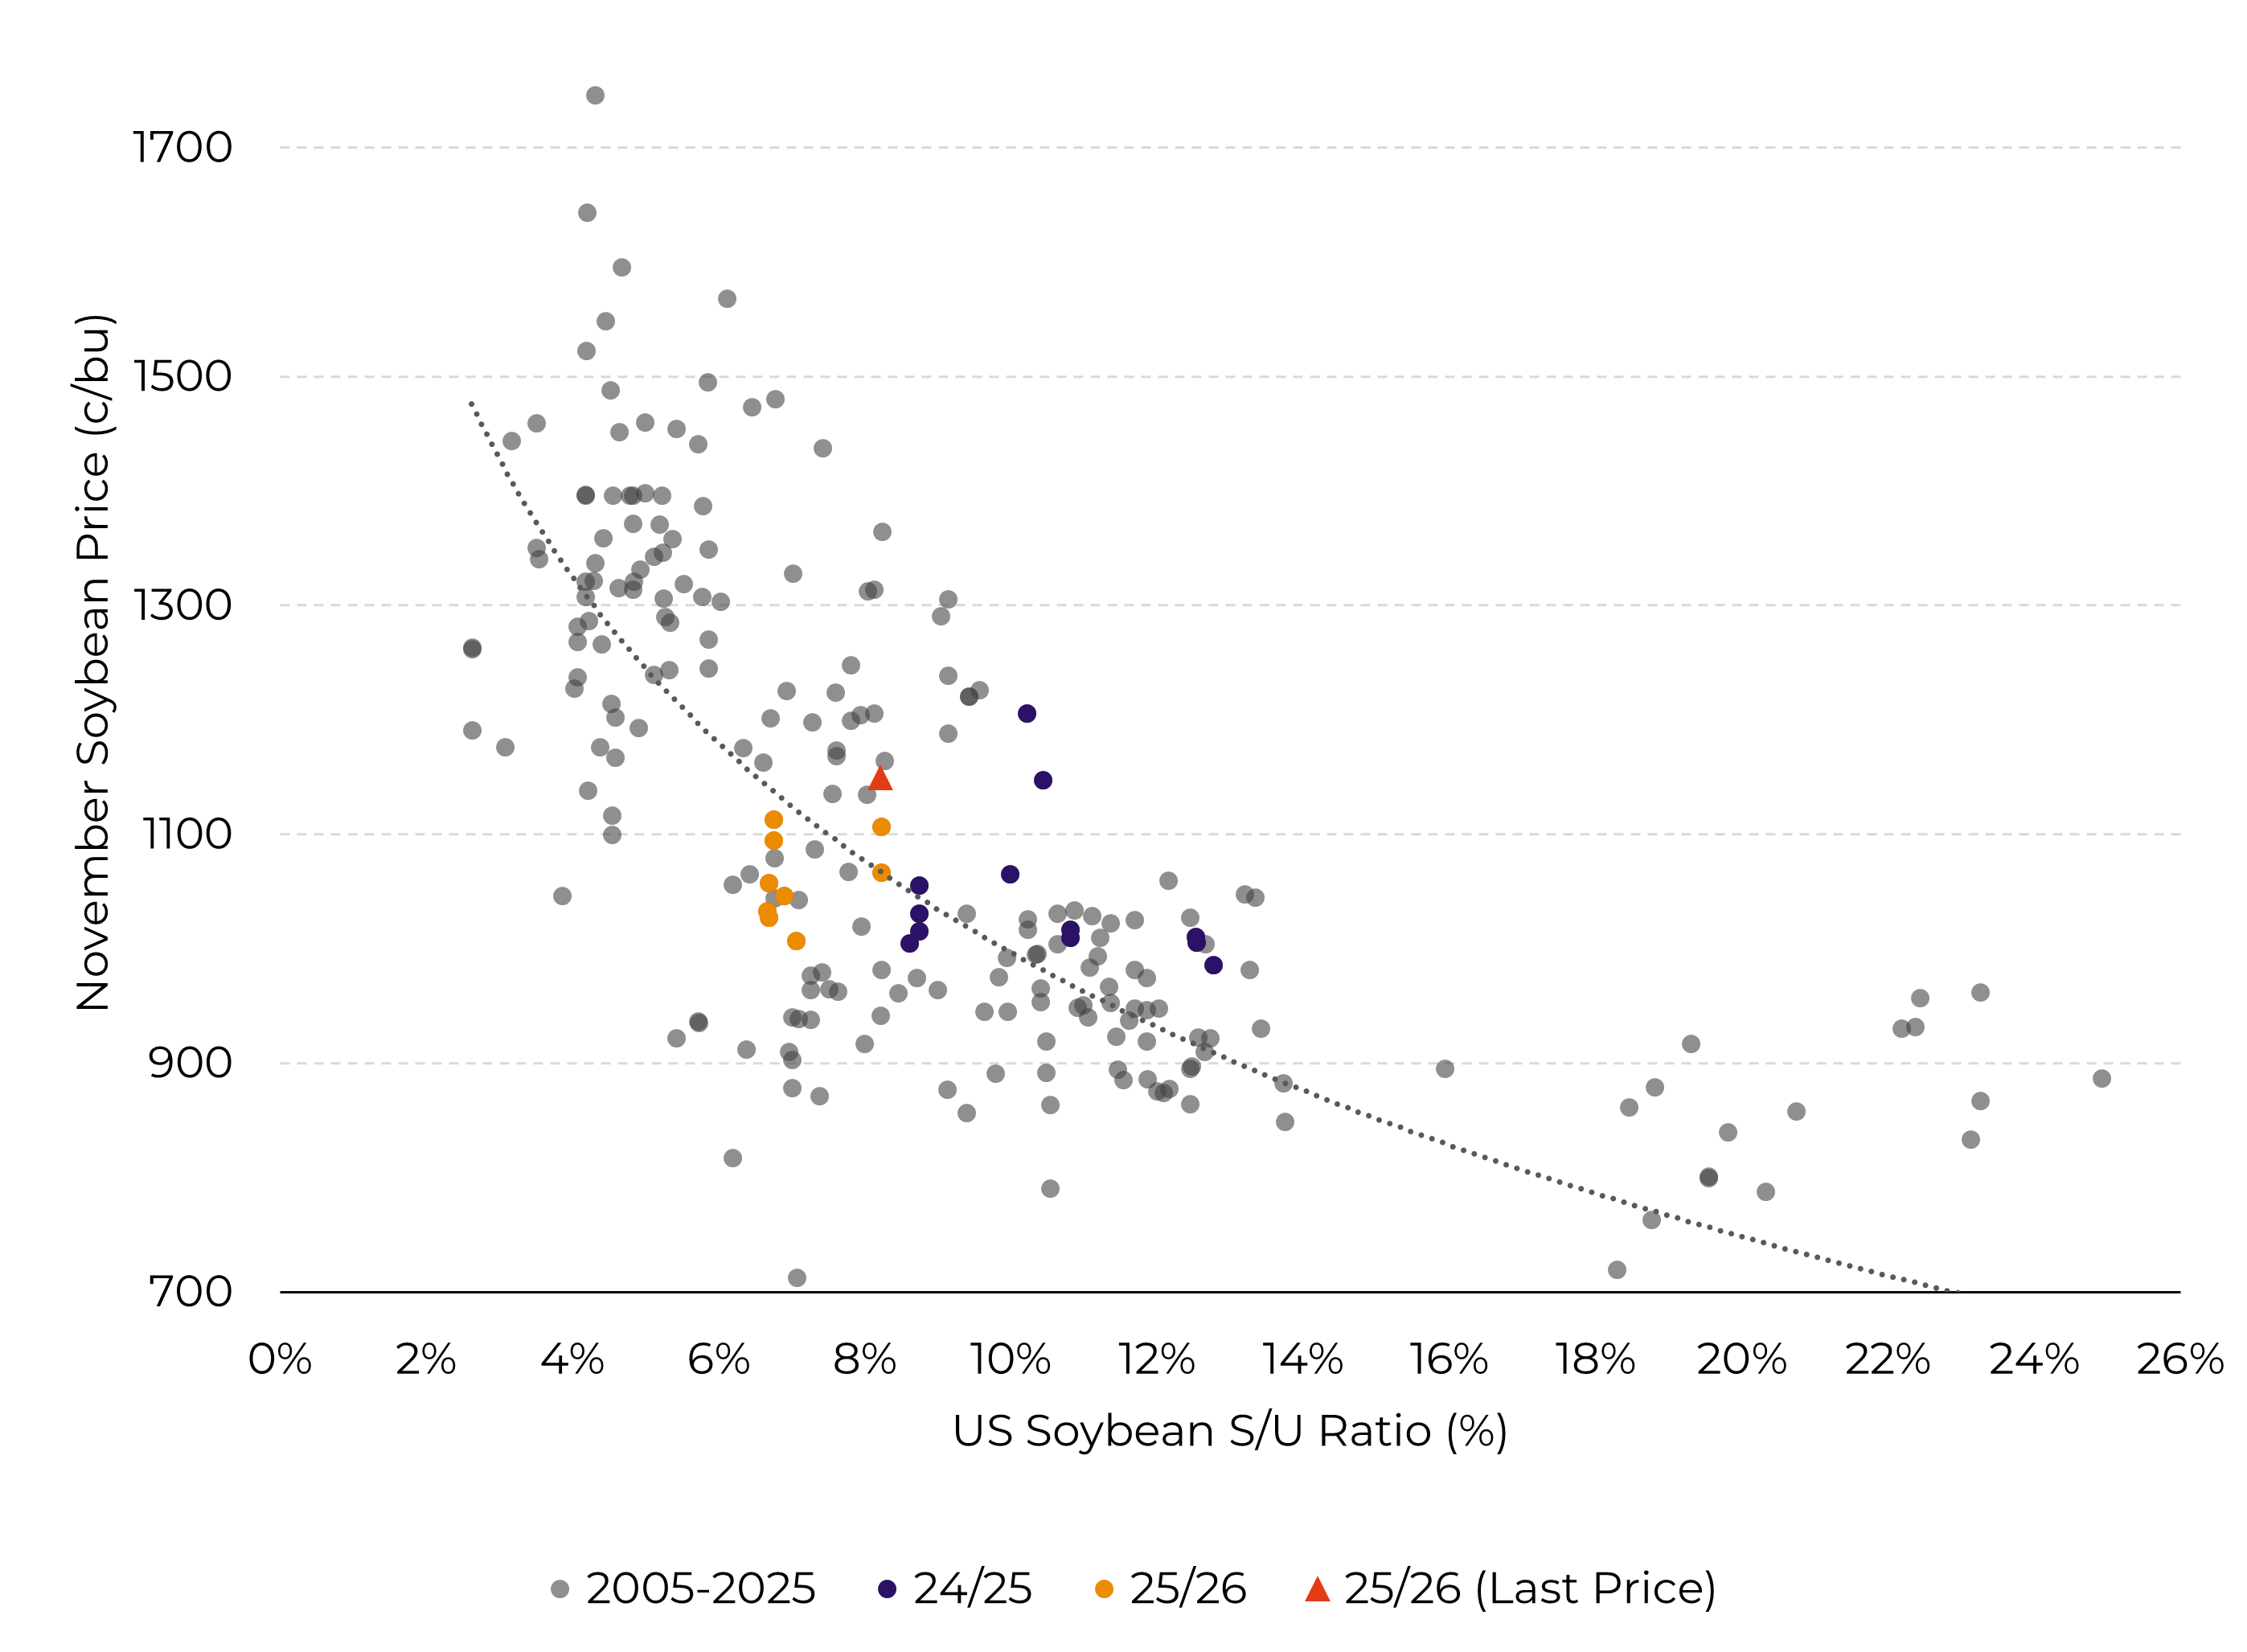
Source: USDA, Hedgepoint
As for corn, potential production is estimated at 405.9 million tons, a 6% decline from the previous season. If confirmed, this production would also be the second-highest in U.S. history, trailing only the 2025/26 production.
In our historical correlation analysis, this corn stock-to-use ratio of 13% would suggest equilibrium prices in Chicago of around 4.00–4.10 USD/bu.
Corn | US | Supply and Demand (in M tons)
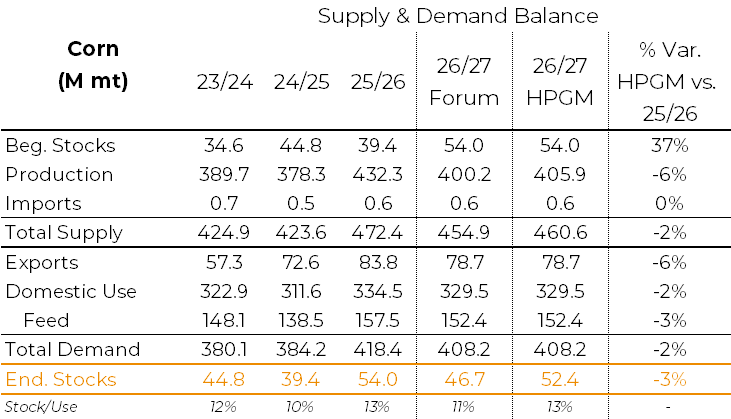
Source: USDA, Hedgepoint
Corn | US | Supply and Demand (in M bushels)
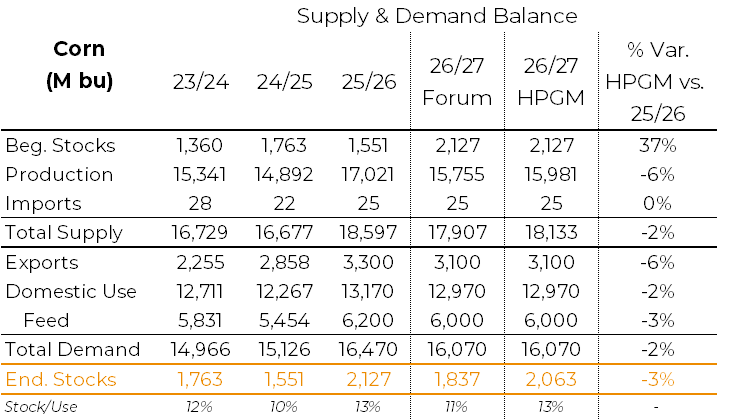
Source: USDA, Hedgepoint
Corn | U.S. | Stock/Use vs. Price
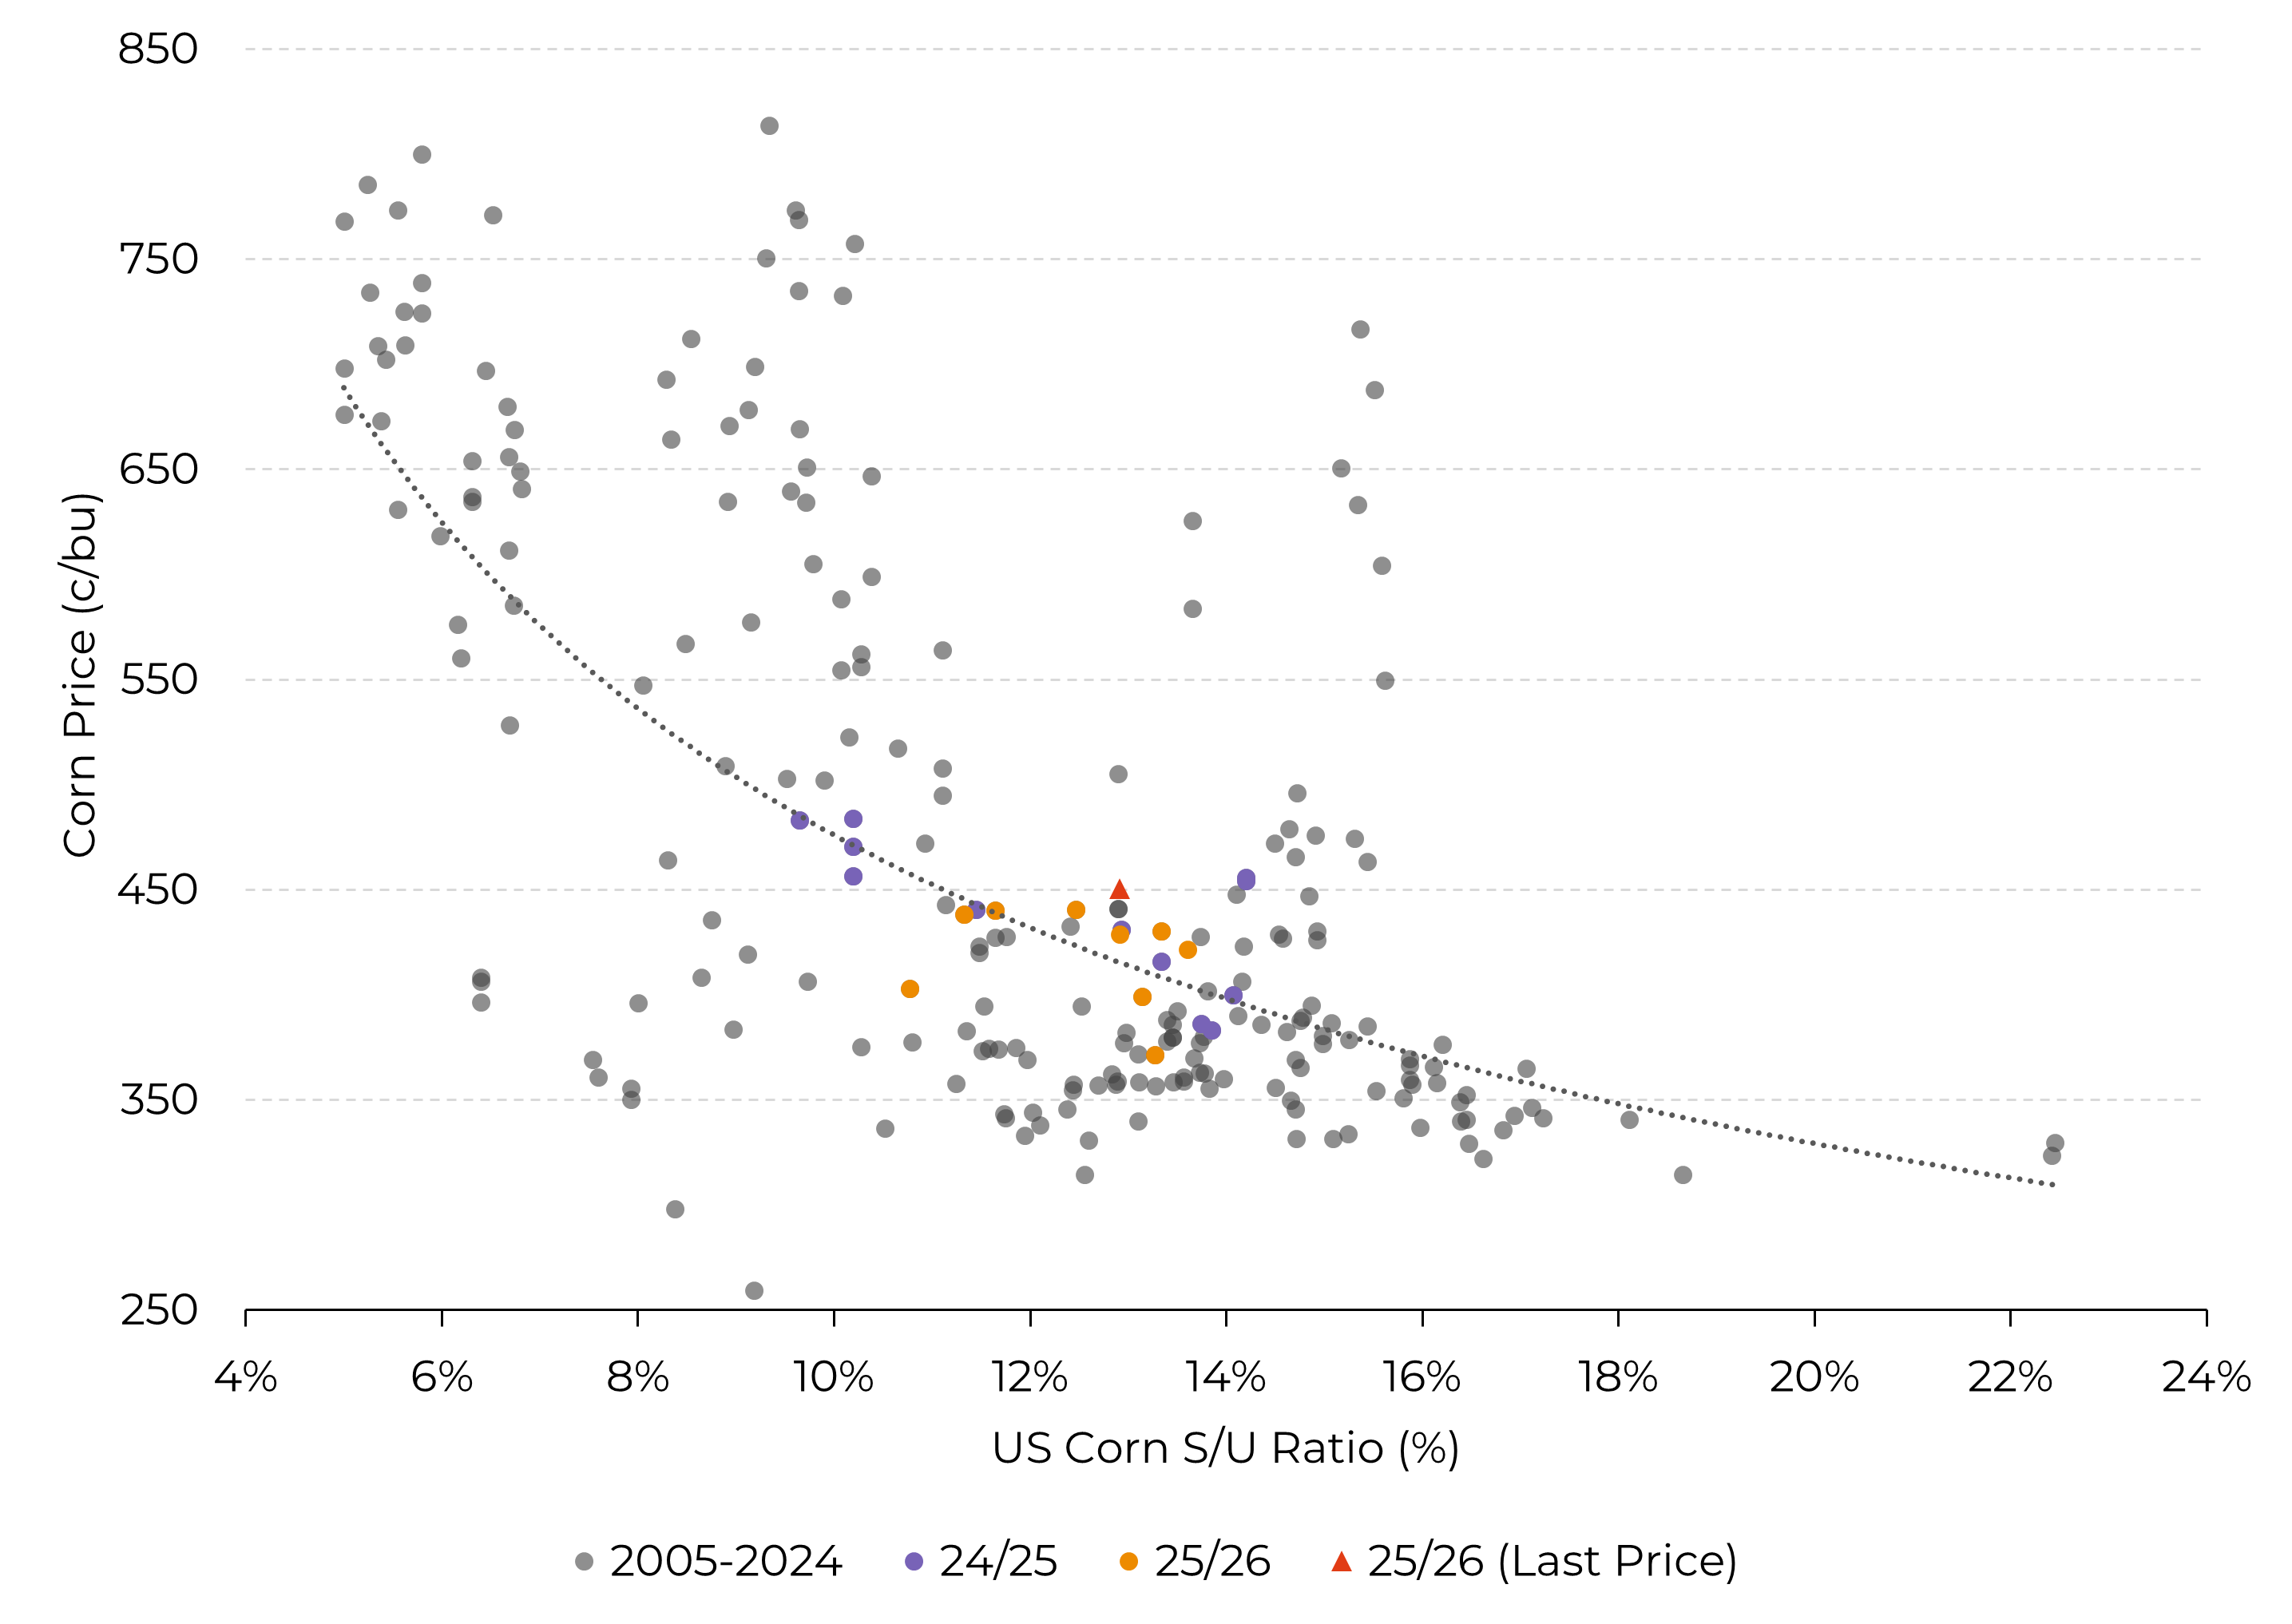
Source: USDA, Hedgepoint
With planting for this new U.S. crop season just beginning, attention now turns to weather conditions for the progress of planting and crop development over the next 150 days.
U.S. Precipitation Anomaly Forecast (%) - April
Source: NOAA
When we look at the snow cover and compare it to the same period last year, we notice that there is more snow in North Dakota and Minnesota, which could hinder the machines’ initial progress. However, we do not see any major potential problems at this time.
U.S. | Snow Cover | April 7, 2025 U.S. | Snow Cover | April 7, 2026
Source: NOAA Source: NOAA
Looking a little further ahead, the precipitation anomaly forecast map points to “normal” rainfall between April and June across most of the U.S. Corn Belt, also indicating favorable conditions for crop development. However, some states in the western half of the Corn Belt may experience below-average rainfall during this period, which warrants attention.
U.S. Precipitation Anomaly Forecast (%) – April, May, and June
Source: NOAA
When we look at the Drought Monitor, we note that some states in the southern and western parts of the production belt are currently experiencing low soil moisture, which is also a factor that warrants attention. For these states, it is essential that rainfall returns with greater volume and more regularity in the coming weeks so that soil moisture can recover and conditions become more favorable for crop development.
U.S. Drought Monitor | March 31
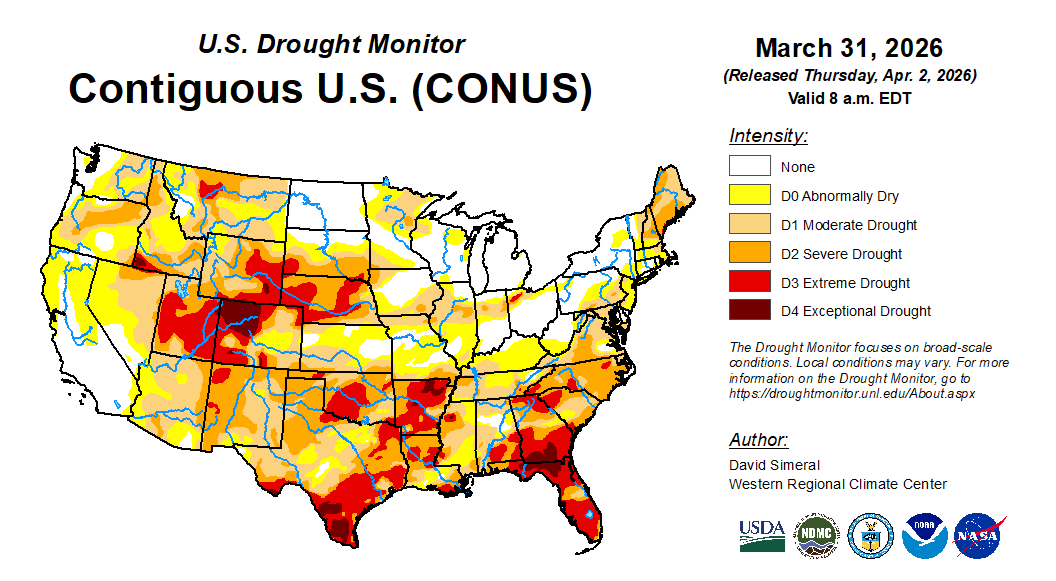
Source: USDA, NOAA
The speculative period regarding the U.S. weather market is officially open! Fasten your seatbelts!
Written by Luiz F. Roque
Luiz.Roque@hedgepointglobal.com
Revised by Thaís Italiani

